Solana [SOL] saw rising institutional demand, with digital asset investment products recording $9.1 million in net inflows last week.
That marked the 6th straight week of inflows, pushing year-to-date totals to $181 million. Only Bitcoin [BTC] recorded higher inflows.
That trend pointed to sustained institutional interest, often linked with improving market confidence.
In fact, capital appeared to rotate beyond Bitcoin as investors diversified into Solana-linked products.
Consistent inflows typically supported price stability and could reinforce short-term bullish momentum.
However, flows alone rarely sustained rallies without confirmation from spot demand.
Spot market confirms buyer dominance
Spot Taker CVD data confirmed strong buyer dominance in recent weeks. Aggressive buyers lifted offers, indicating sustained Spot demand.
That shift aligned with stronger upward pressure building across the market.
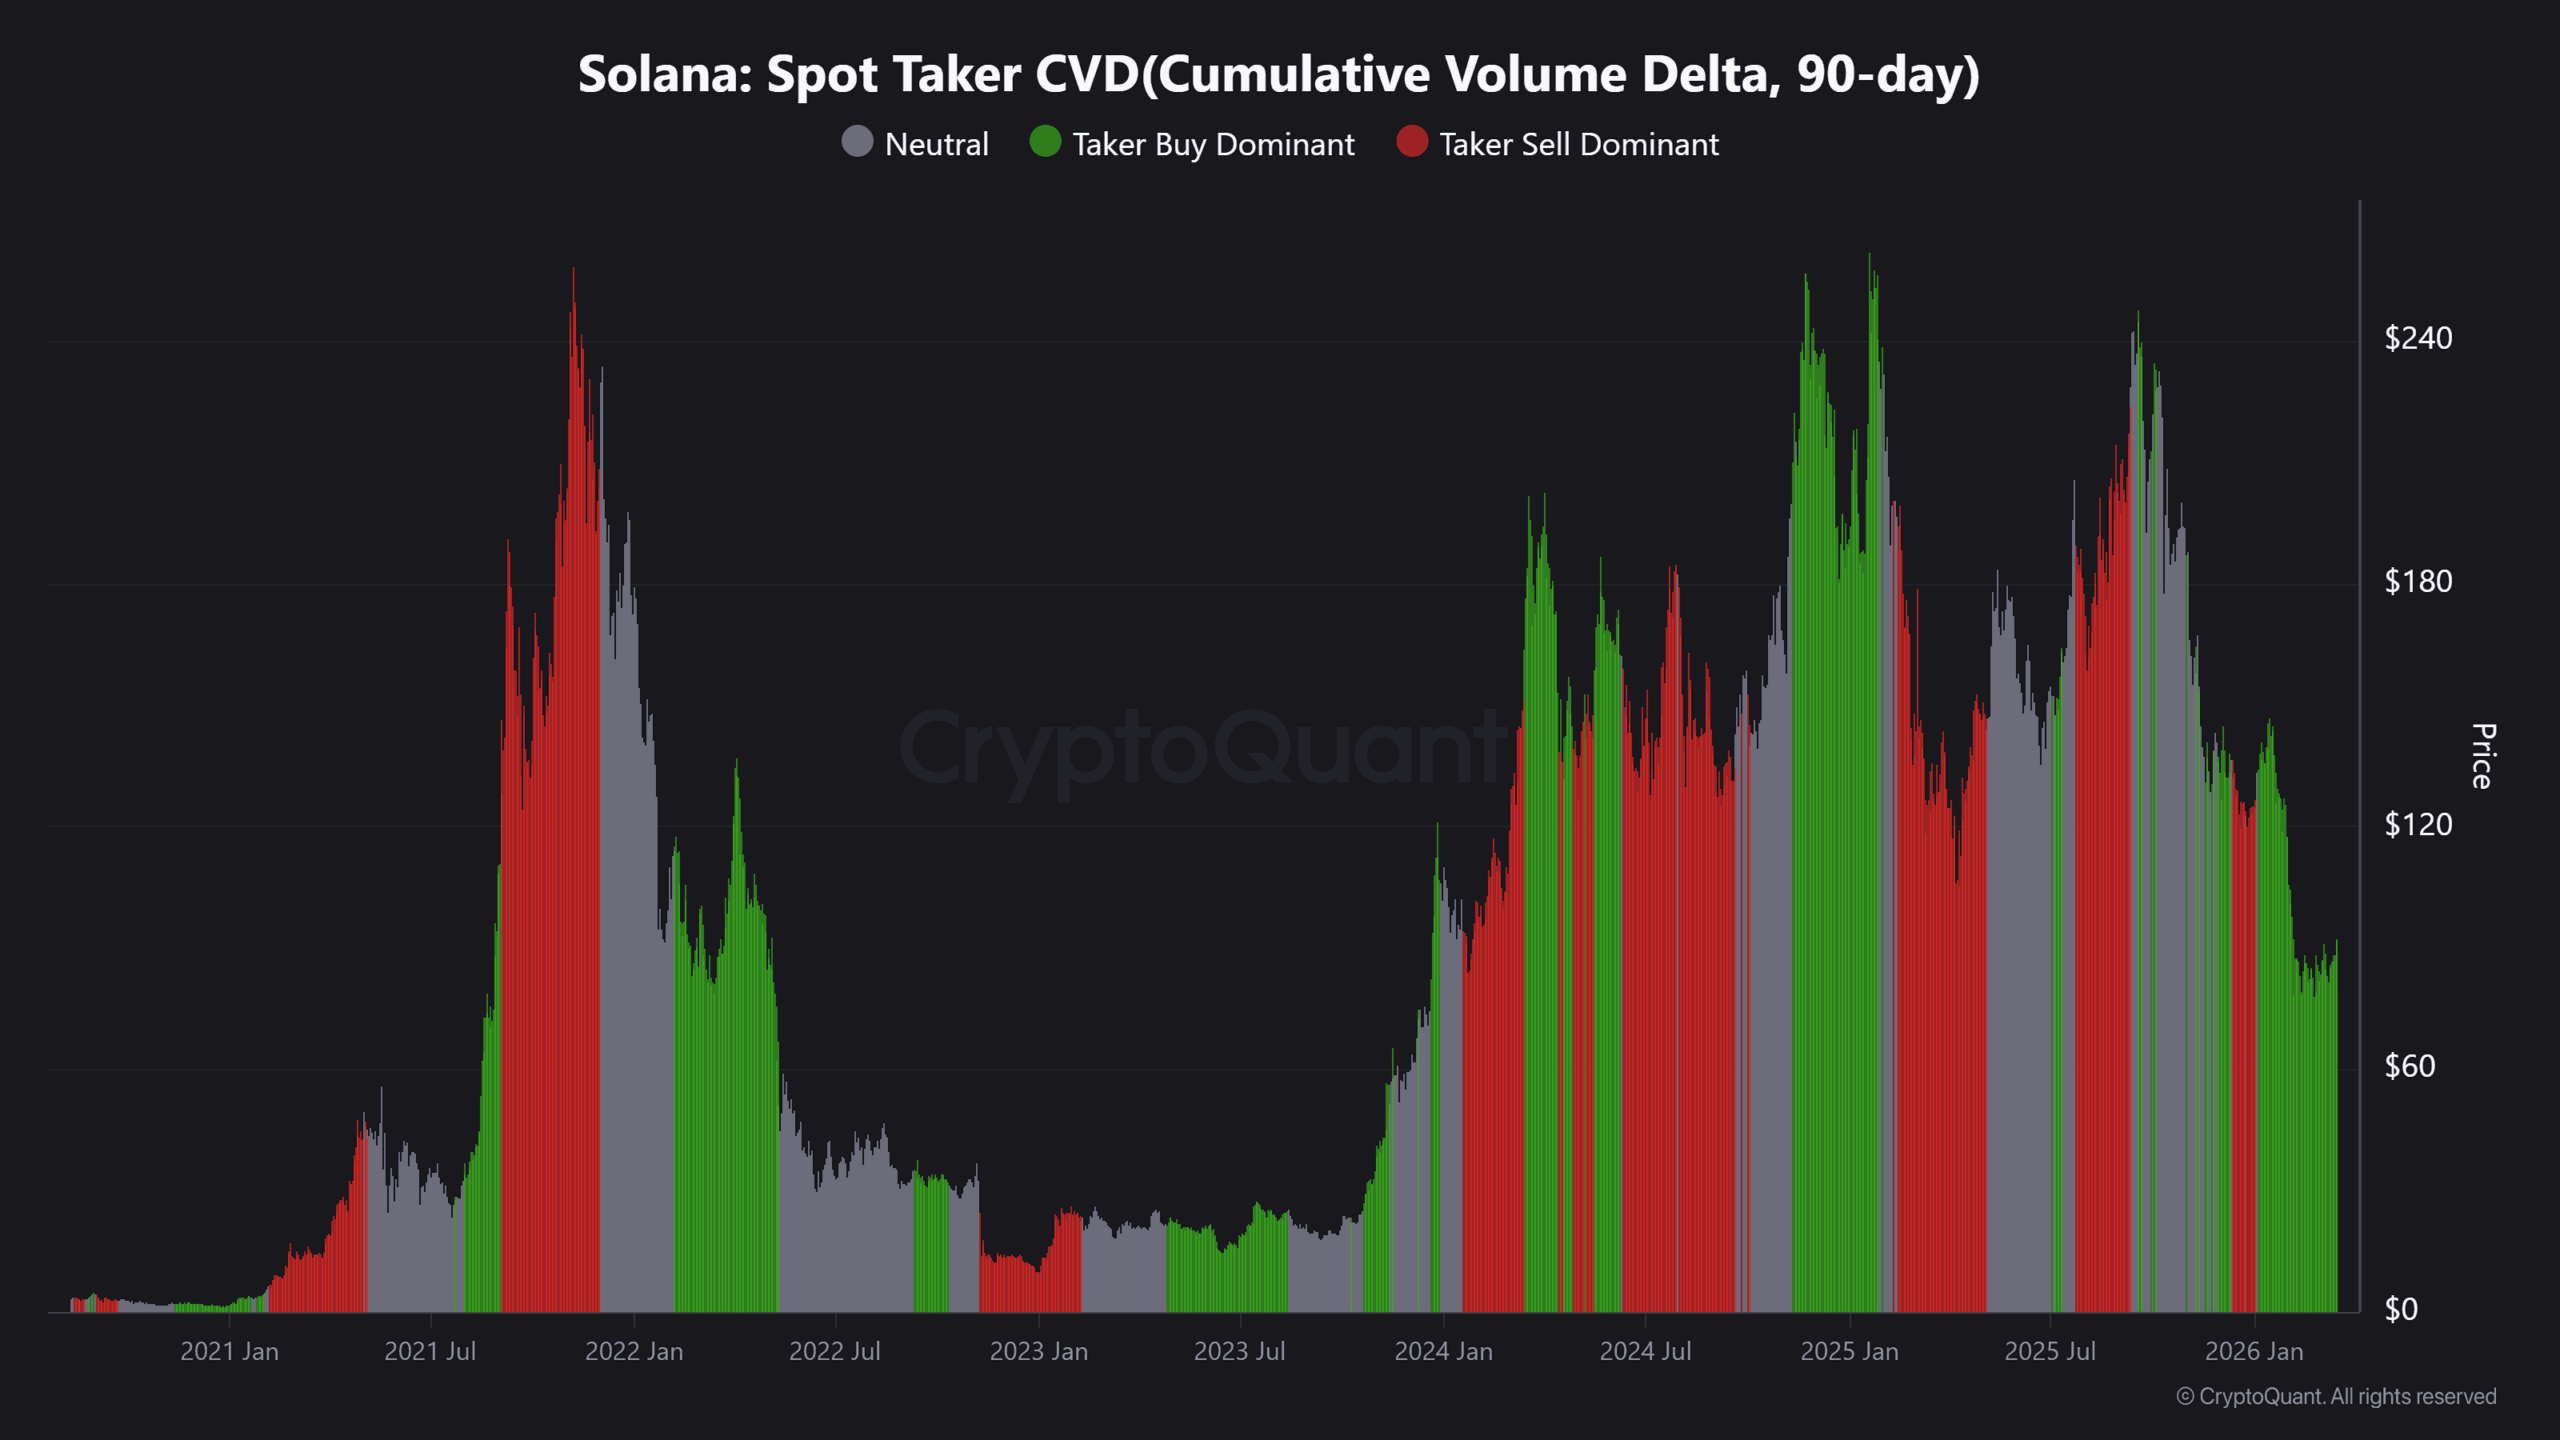

When Spot demand leads, price trends tend to hold better over time. Even so, momentum still depended on structure holding above breakout levels.
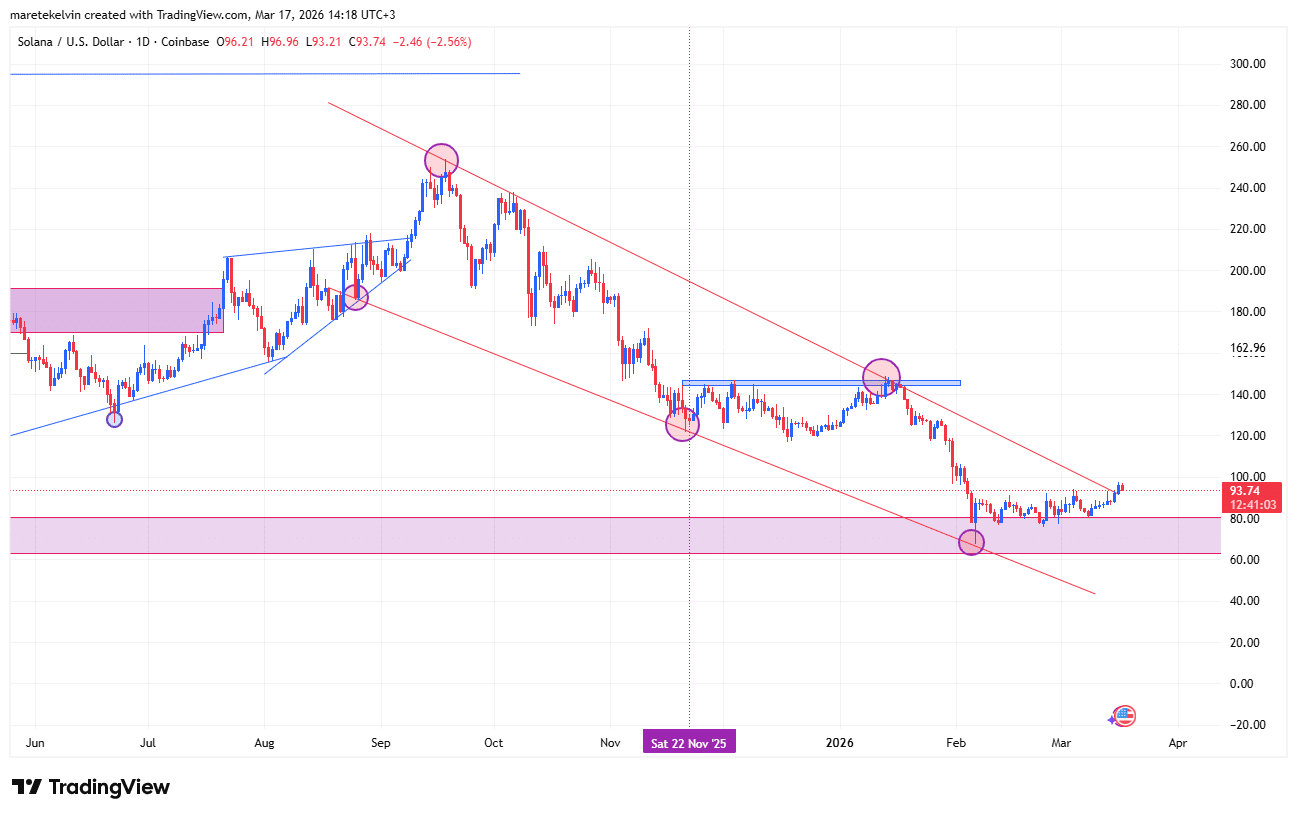
Technical breakout shifts momentum
Price action aligned with the improving demand profile.
On the daily chart, SOL broke out of a wedge consolidation pattern, signaling a potential trend shift. At press time, SOL traded near $93.74 after a short-term pullback.
That move suggested a classic retest phase following the breakout.
Retests often allow investors to re-enter positions and confirm breakout strength. If the level holds, the breakout may extend into a stronger trend phase.

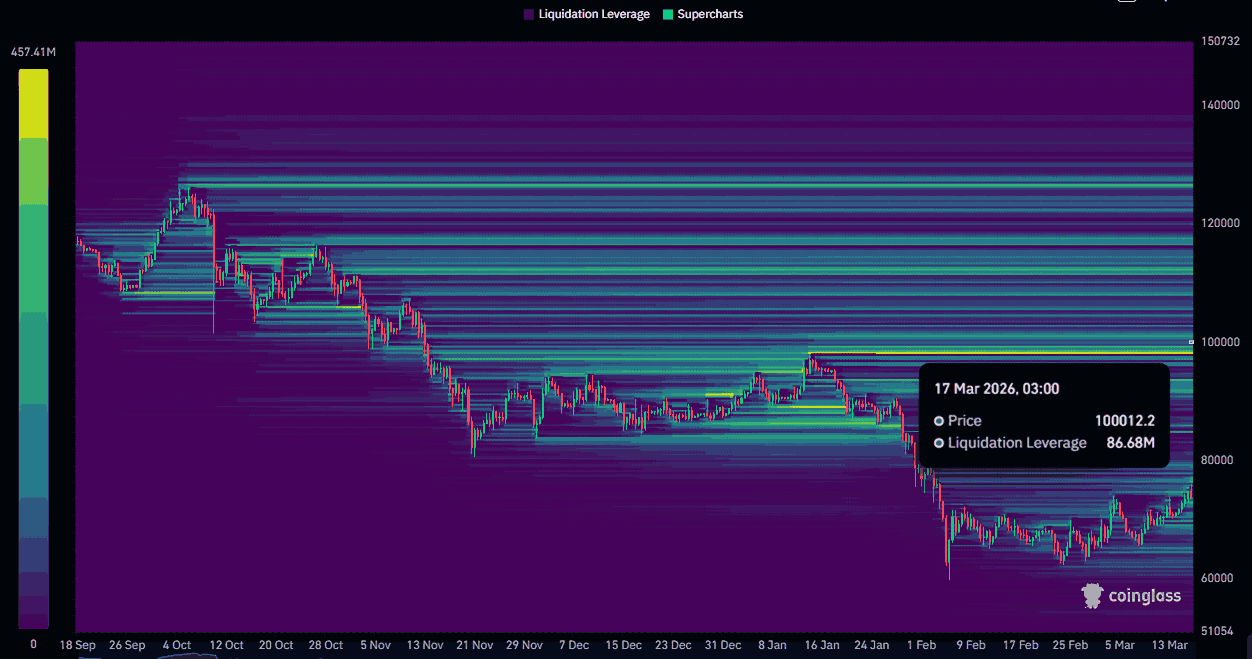
$100 emerges as the next key target
Market focus shifted toward the next liquidity zone near $100.
CoinGlass data showed a Liquidation cluster worth $86.68 million around that level. That concentration made $100 a key magnet for price action.
On top of that, clustered liquidity often attracts price as traders target leveraged positions.
However, failure to hold current levels could delay any move toward that zone.

What could be next for SOL
The setup remained constructive at the time of writing.
Institutional inflows stayed strong, while Spot demand supported the price structure. If both trends persisted, SOL could extend toward the $100 liquidity zone.
Even so, the breakout needed to hold to maintain bullish momentum.
Final Summary
- Solana recorded $9.1M inflows, extending its streak to six consecutive weeks.
- Year-to-date inflows reached $181M, second only to Bitcoin.