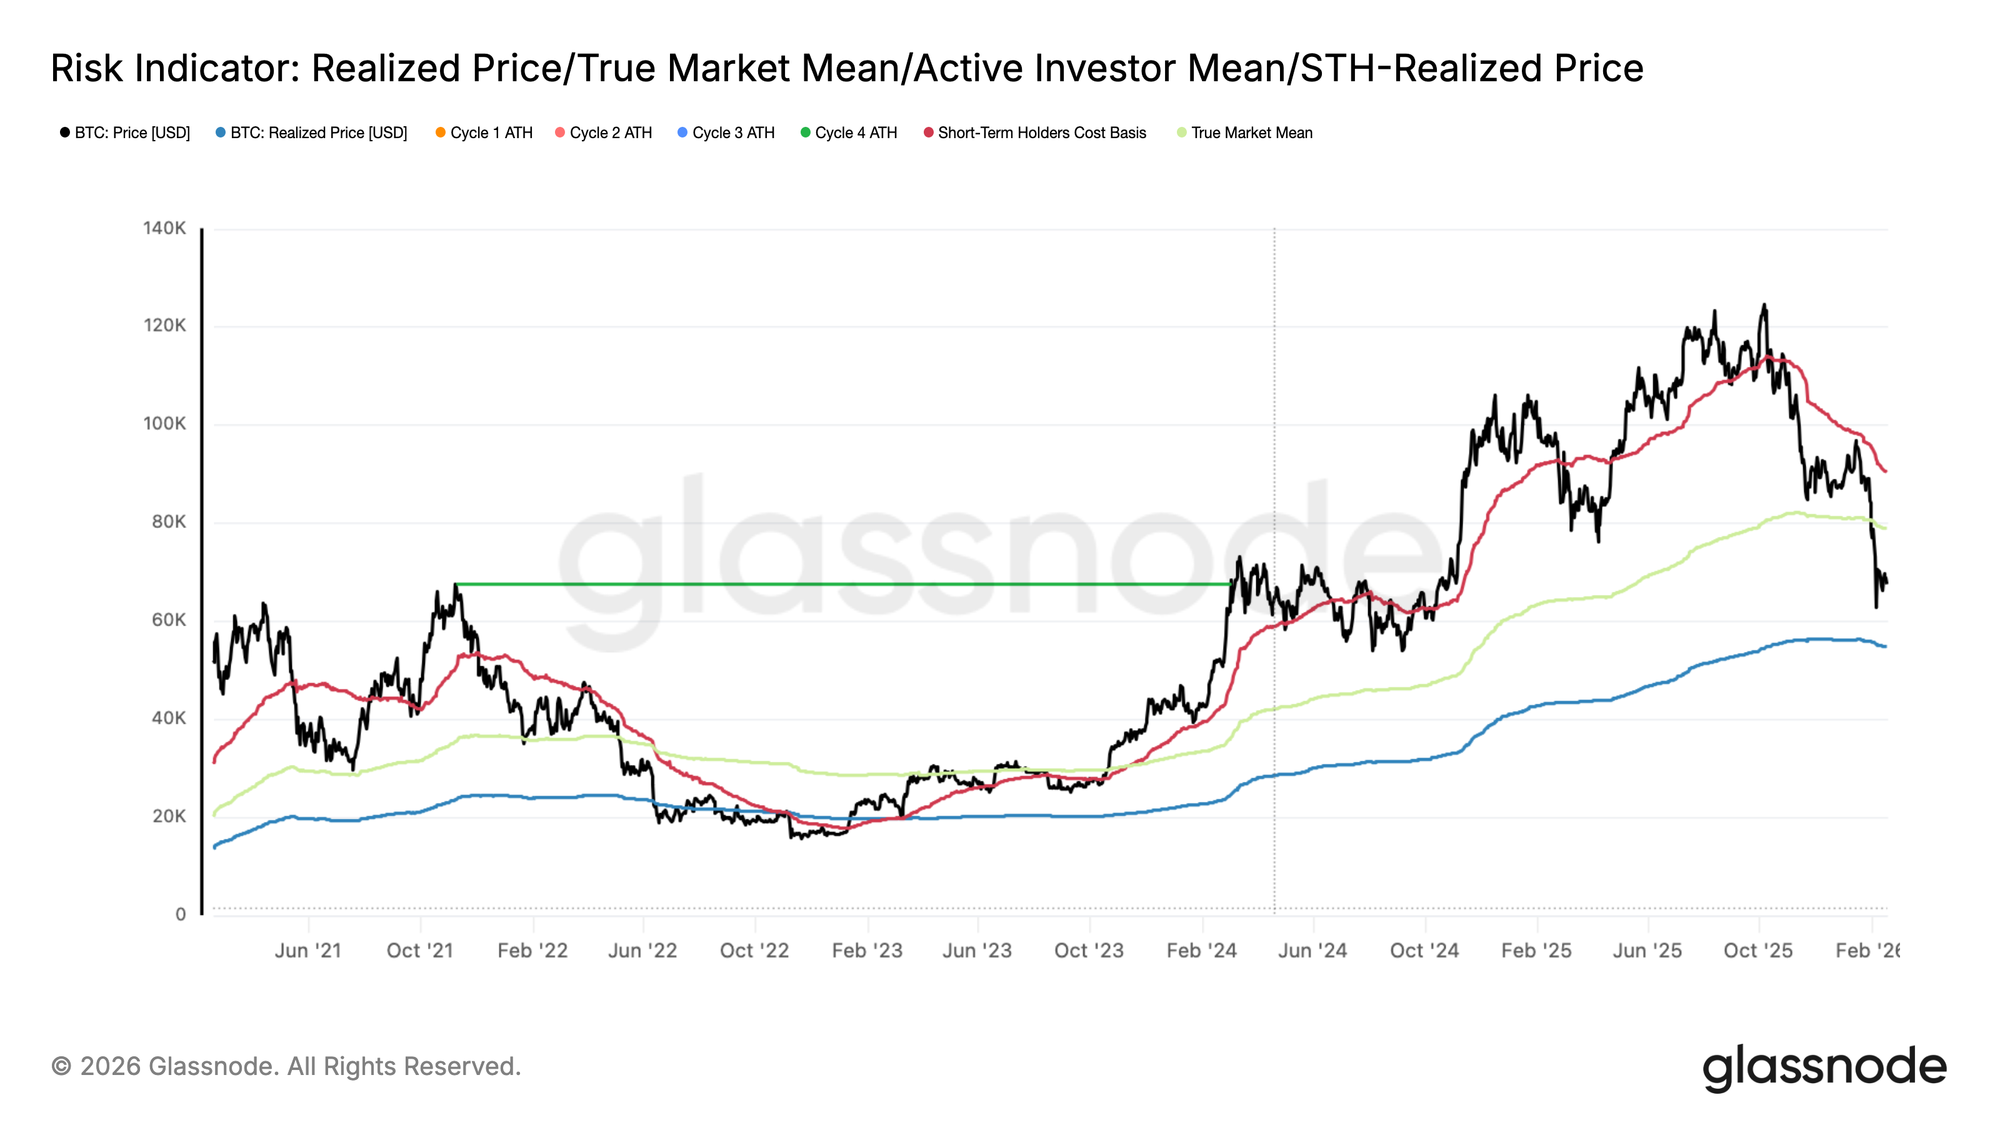
Новая фаза сокращения рынка началась в конце января, ознаменовавшись решительным прорывом ниже Истинной Рыночной Средней (True Market Mean) — базовой ончейн-модели цены, отслеживающей совокупную себестоимость активного предложения, которая в настоящее время находится в районе $79 тыс. Исторически более глубокие фазы медвежьего рынка находили свою нижнюю структурную границу вокруг Реализованной Цены (Realized Price), которая оценивает среднюю стоимость приобретения всех монет в обращении и сейчас составляет около $54,9 тыс.
В предыдущих циклах эти два ценовых ориентира формировали продолжительные периоды сжатия и поглощения. При отсутствии неожиданного макро-катализатора, Истинная Рыночная Средняя на уровне $79 тыс. и Реализованная Цена на уровне $54,9 тыс., вероятно, будут определять основной коридор сопротивления и поддержки для среднесрочной структуры рынка.
Кластер спроса поглощает давление
Более пристальное изучение поведения цены после пробоя ниже Истинной Рыночной Средней указывает на то, что давление на понижение в значительной степени было поглощено в плотной зоне спроса между $60 тыс. и $69 тыс. Этот кластер в основном сформировался в фазе консолидации в первом полугодии 2024 года, где инвесторы накапливали позиции в течение продолжительного диапазона и с тех пор удерживают их уже более года.
Позиционирование этой когорты near breakeven levels, по-видимому, смягчило дополнительное давление продаж, способствуя формированию еще одной боковой структуры с конца января 2026 года. Защита диапазона $60–$69 тыс. предполагает, что среднесрочные держатели остаются устойчивыми, позволяя рынку перейти от импульсного снижения к поглощению в рамках диапазона.
Агрессия покупателей в фокусе
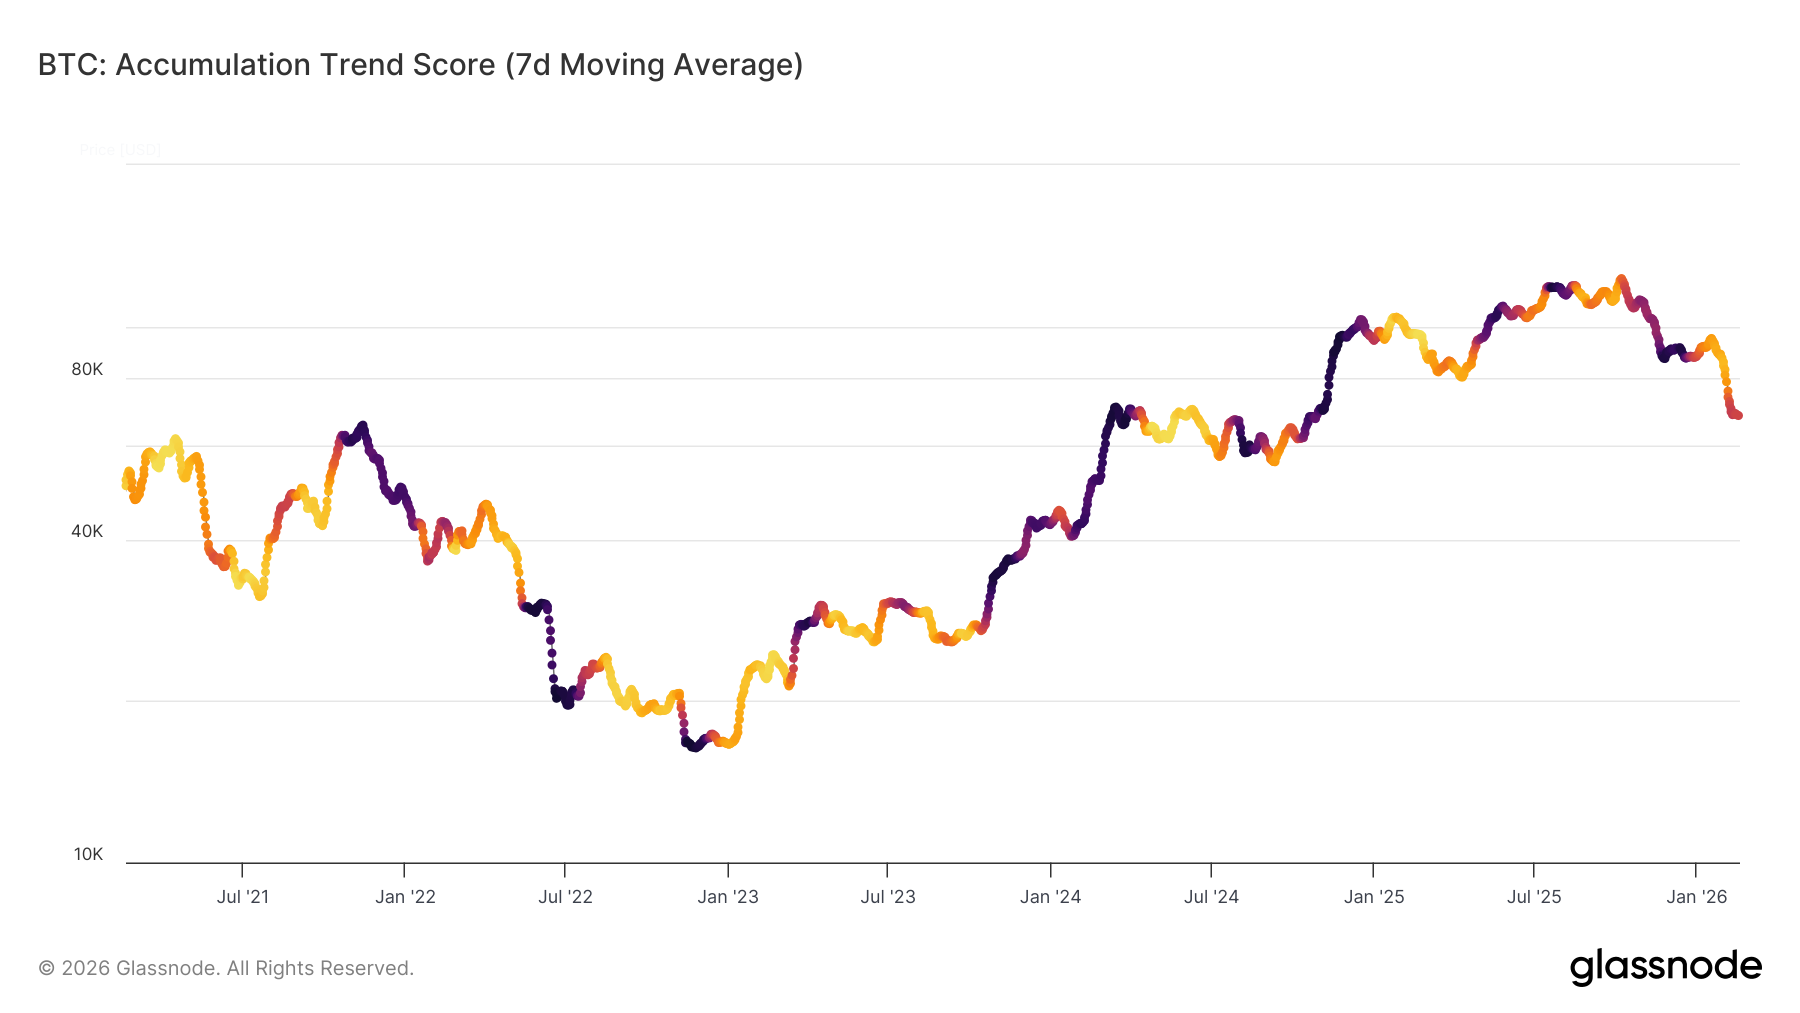
Продолжительность текущей диапазонной структуры будет в значительной степени зависеть от силы и устойчивости активности покупателей. Чтобы количественно оценить это поведение, мы исследуем Score Тренда Накопления (Accumulation Trend Score, ATS), который измеряет изменения баланса по когортам кошельков, присваивая больший вес более крупным entities.
7-дневная скользящая средняя ATS отражает заметный поведенческий сдвиг: от сильной дистрибуции после потери Истинной Рыночной Средней (ATS < 0,1) к более нейтральному и хрупкому равновесию near 0,43. Эта стабилизация предполагает, что агрессивные продажи ослабели, но убежденное накопление еще не полностью возобновилось.
Устойчивый рост ATS к 1 сигнализировал бы о возобновлении накопления крупными entities, потенциально расширяя текущий диапазон, тогда как неспособность укрепиться усилила бы underlying структурную хрупкость.
Ликвидность остается ограниченной
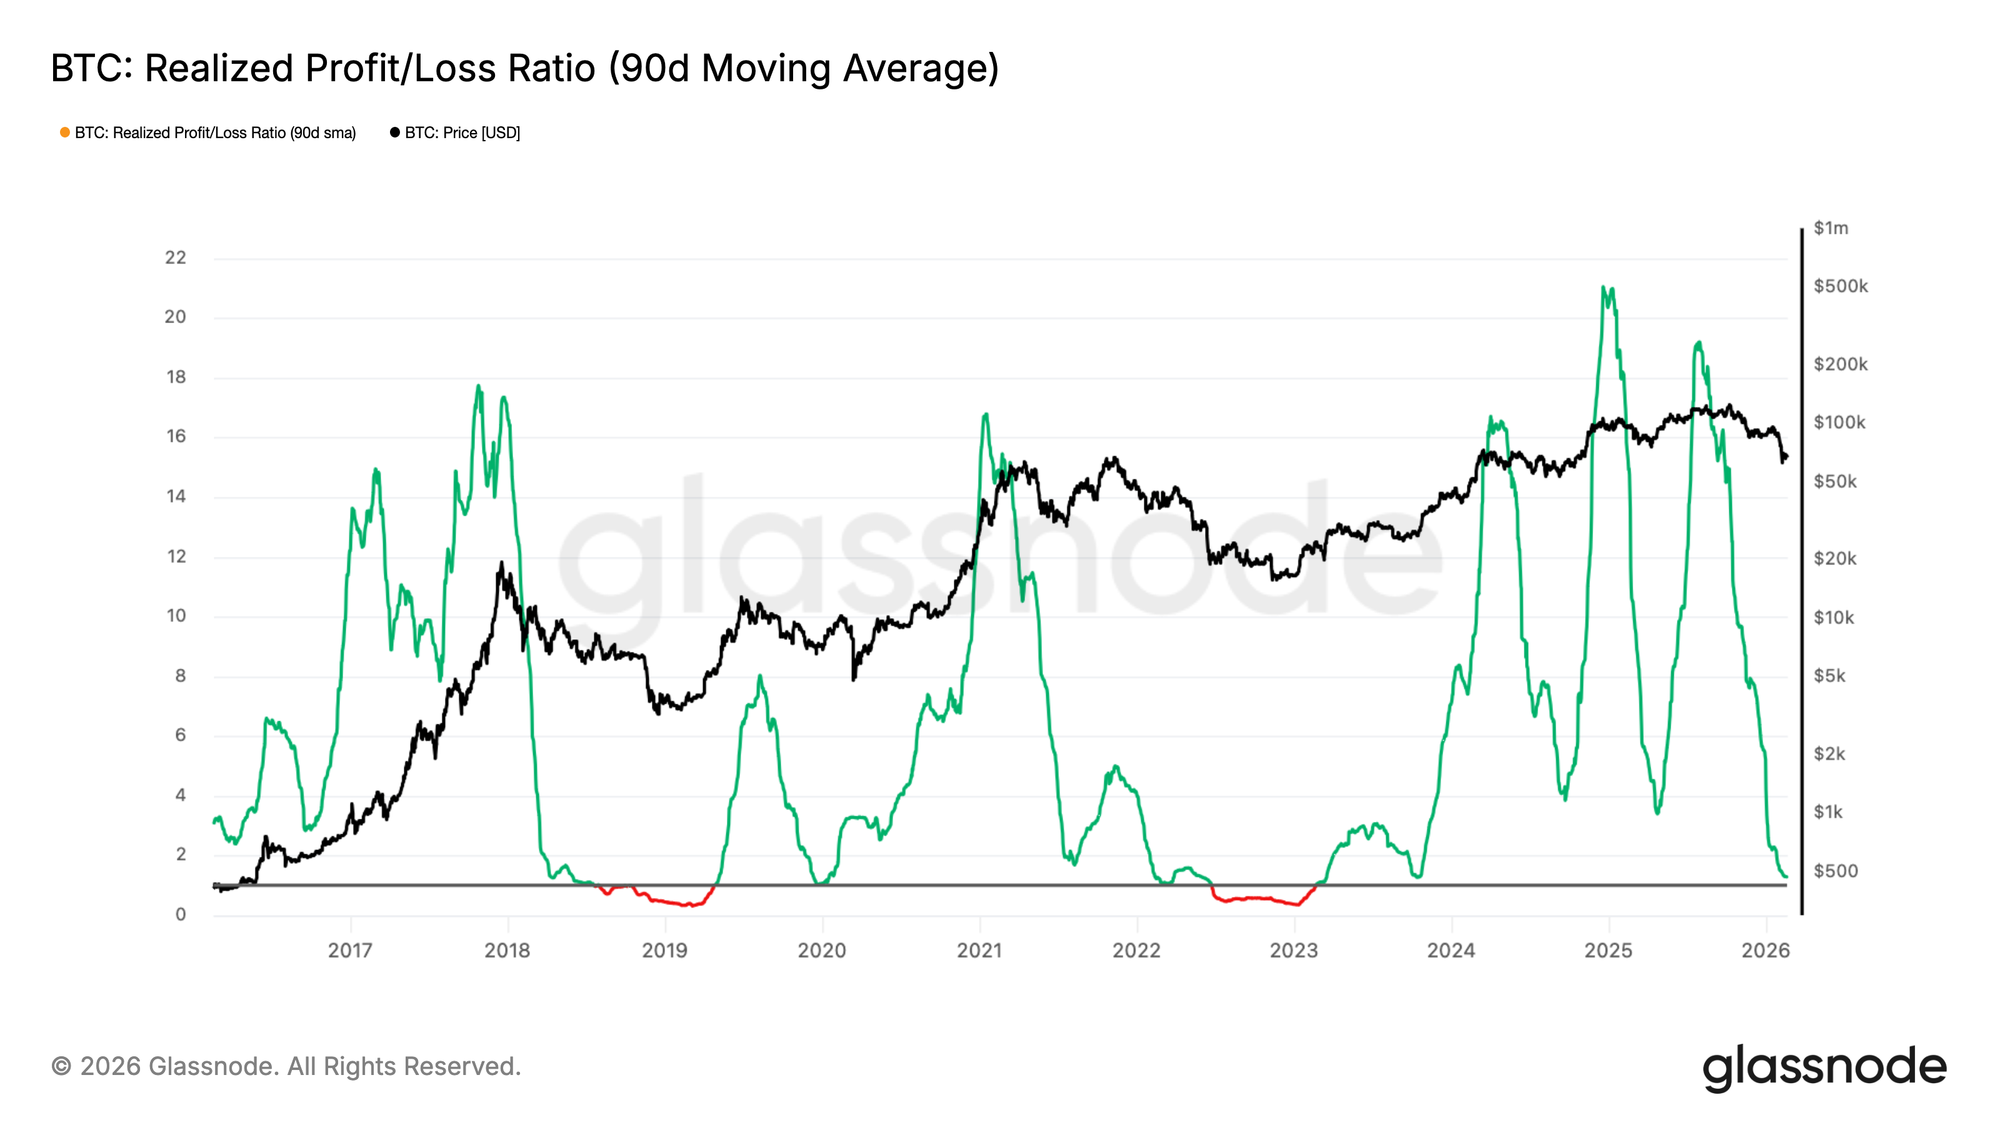
Помимо отсутствия сильного накопления, более широкие условия ликвидности продолжают отражать структурную слабость. В качестве прокси для рыночной ликвидности, Коэффициент Реализованной Прибыли/Убытка (Realized Profit/Loss Ratio) дает представление о динамике потоков капитала, измеряя среднюю стоимость в долларах США реализованной прибыли на каждый доллар реализованного убытка.
90-дневная скользящая средняя этого показателя снижалась обратно в диапазон 1–2 — зону, которая исторически характеризует переход от ранних медвежьих фаз к более стрессовым условиям, где реализованные убытки начинают доминировать (Коэффициент Реал. Прибыли/Убытка < 1). Это сжатие указывает на то, что фиксация прибыли остается subdued, а ротация капитала ограничена.
Пока Коэффициент Реализованной Прибыли/Убытка не reclaims уровни выше 2, сигнализируя о renewed прибыльности и более сильных притоках ликвидности, общий рыночный bias, вероятно, останется структурно негативным.
Офф-чейн инсайты
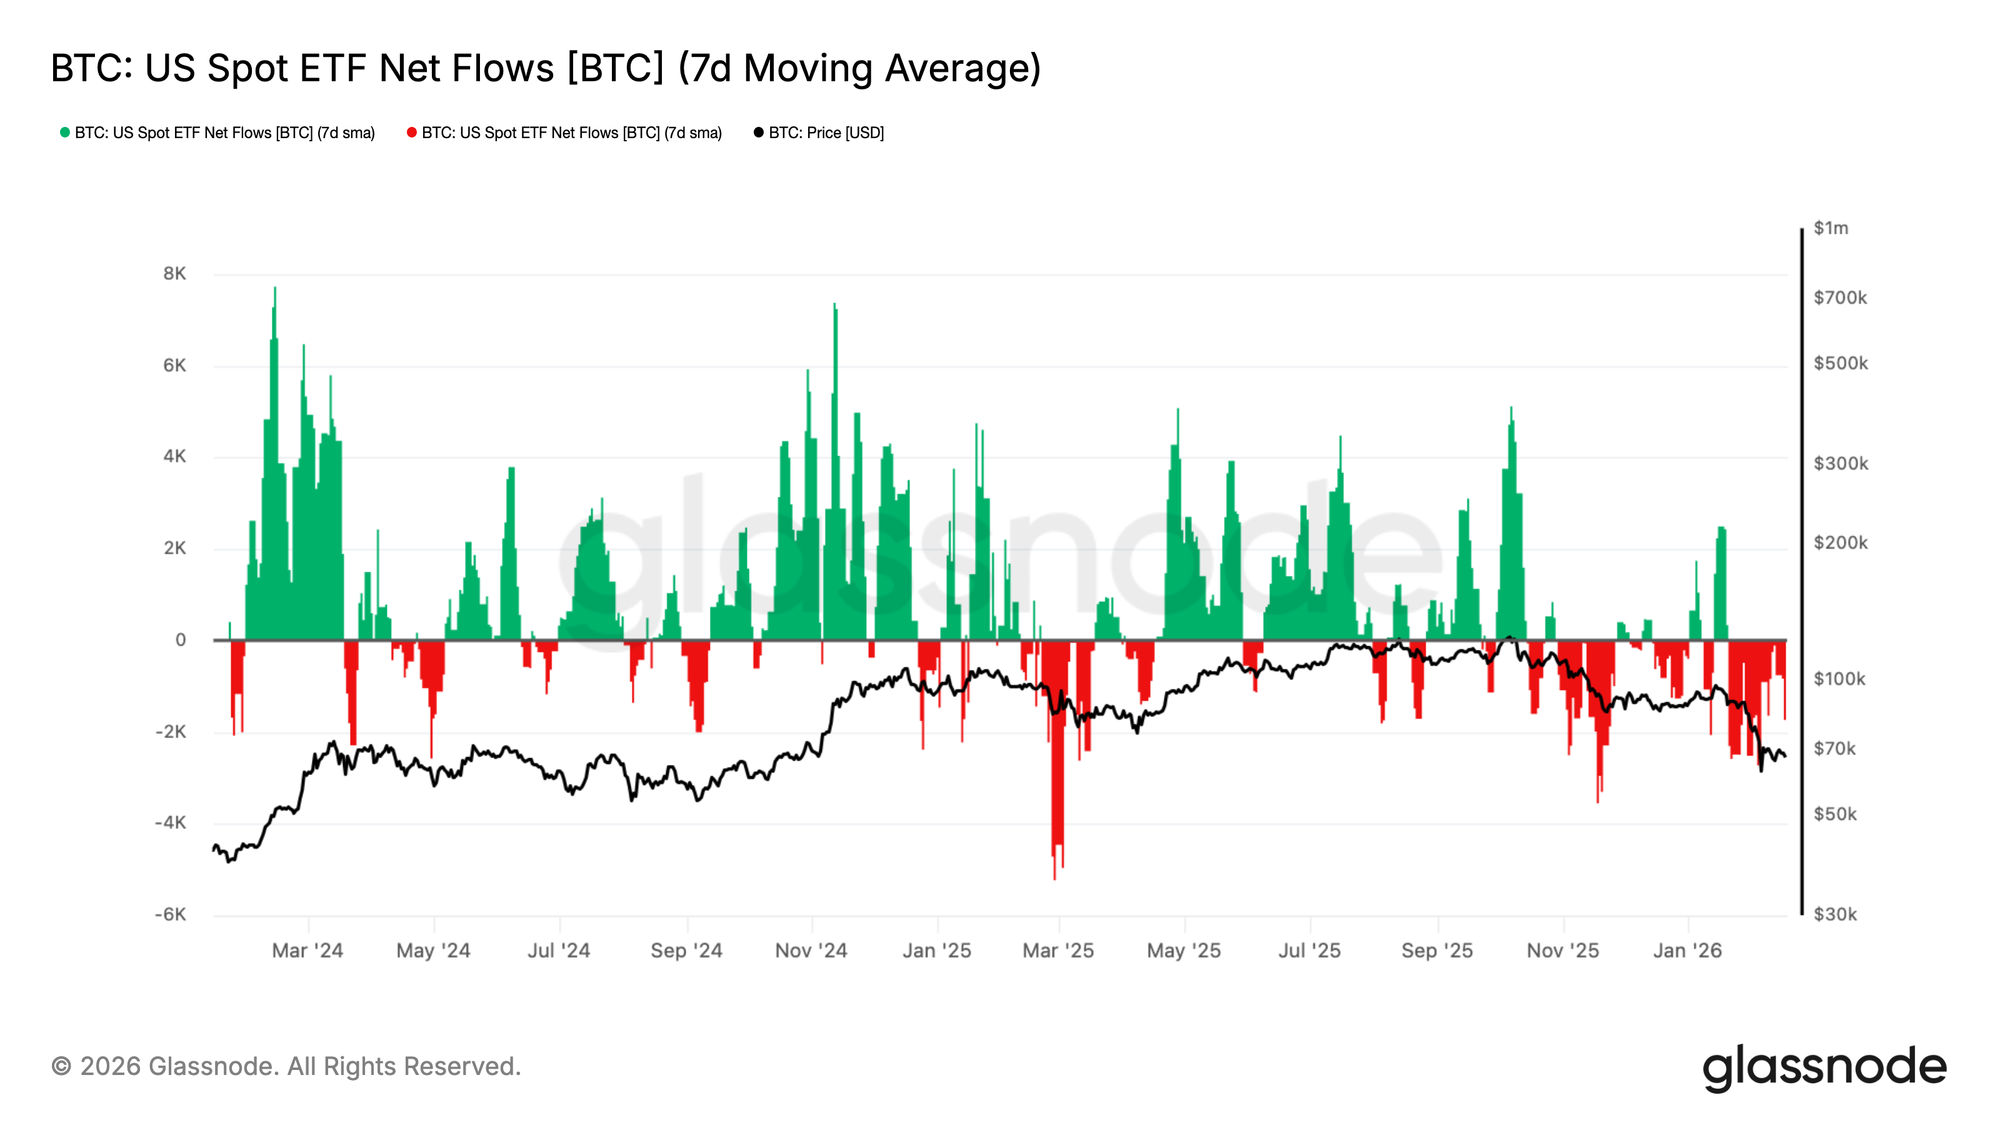
ETF все еще фиксируют оттоки
Спрос на американские спотовые ETF значительно ухудшился, при этом 7-дневная скользящая средняя чистых потоков вернулась к устойчивым оттокам по мере отката BTC к региону $70 тыс. То, что ранее действовало как устойчиственный структурный бид, теперь смягчилось, сигнализируя о сокращении маржинального институционального спроса.
Это знаменует заметный сдвиг по сравнению с предыдущим экспансионистским режимом, где постоянные притоки помогали поглощать предложение и поддерживать более высокий price discovery. Вместо этого потоки теперь в целом отрицательные, что укрепляет точку зрения, что аллокаторы капитала отступают, а не развертываются в слабости.
Поскольку спрос на ETF больше не обеспечивает надежной поддержки под рынком, downside risk остается повышенным, и любые попытки восстановления, вероятно, будут struggle, пока чистые потоки не стабилизируются и не re-accelerate в устойчивые притоки.
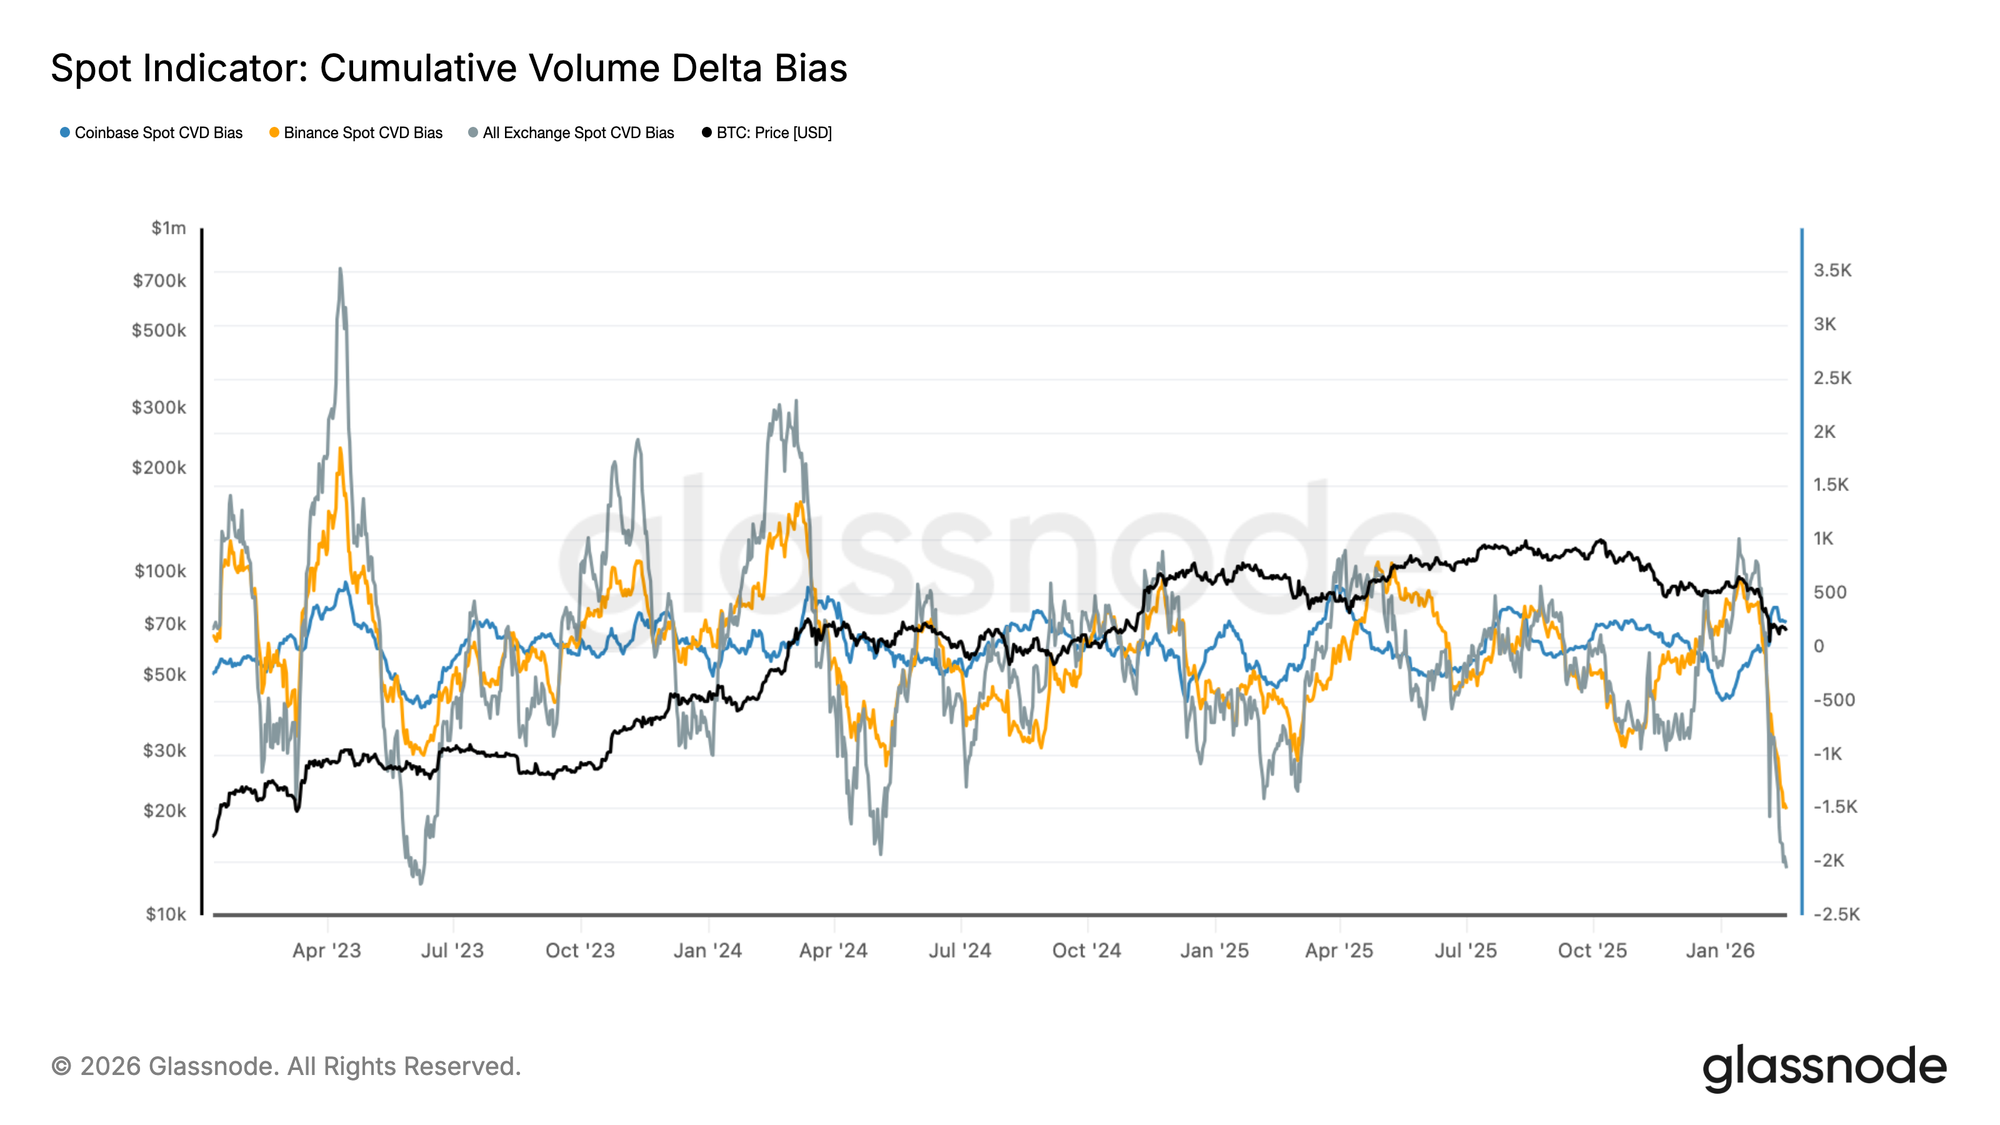
Спотовый bias решительно становится негативным
Спотовая Кумулятивная Дельта Объемов (Spot Cumulative Volume Delta) на крупных биржах резко развернулась, при этом bias как на Binance, так и в целом по всем биржам решительно сменился на негативный. Этот сдвиг отражает ускорение агрессивной sell-side активности, поскольку рыночные ордера все чаще лифтуют биды, а не оферы.
Примечательно, что спотовая CVD Coinbase также смягчилась, сигнализируя, что спрос из США больше не обеспечивает последовательного противовеса глобальному sell pressure. Совпадение негативной CVD на всех площадках suggests, что недавняя слабость обусловлена active distribution, а не пассивными gaps ликвидности.
При том, что спотовые потоки skewed в сторону sell aggression, price action остается уязвимым. Стабилизация CVD, в частности конструктивная дивергенция между ценой и спотовой дельтой, потребовалась бы для сигнала, что органический спрос начинает более эффективно поглощать предложение.
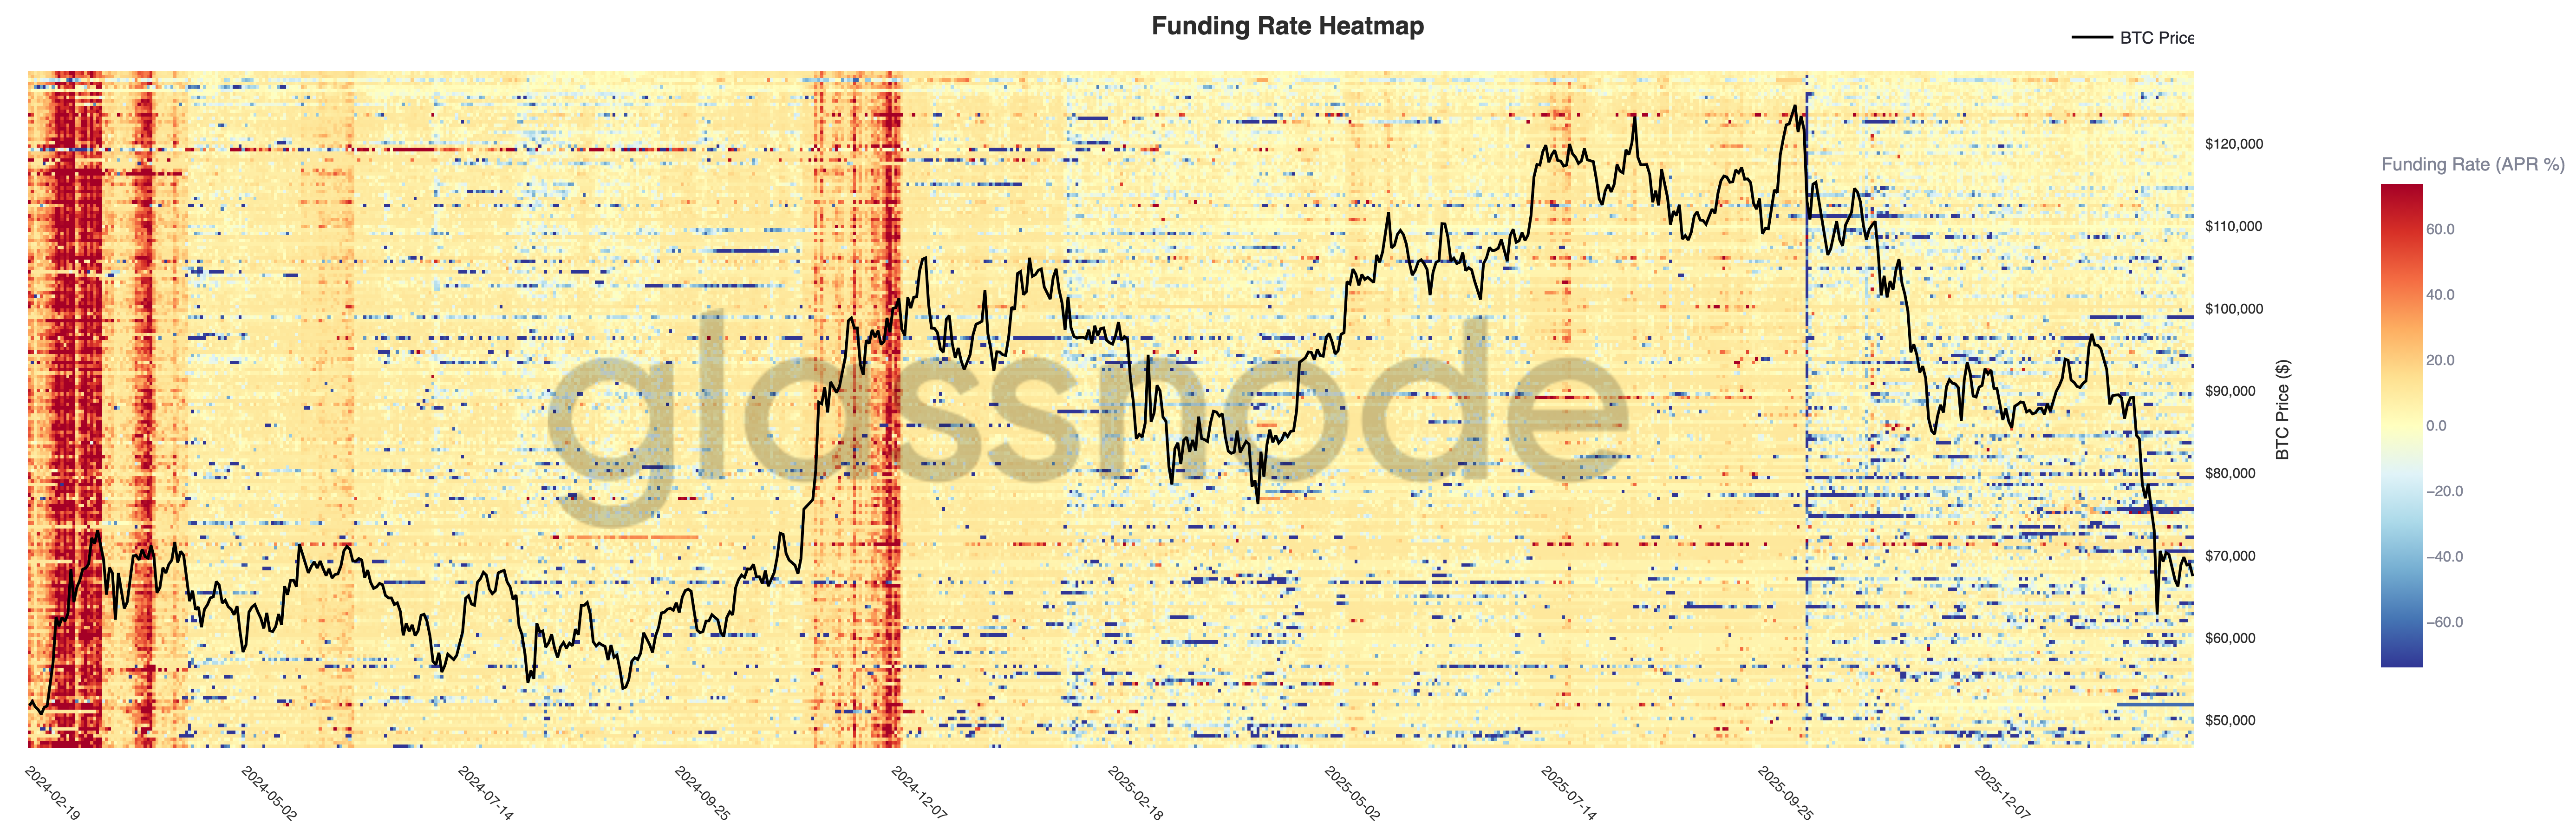
Фандинг перпетуальных контрактов все еще оборонительный
Ставки фандинга перпетуальных контрактов резко сжались на всех площадках, при этом heatmap показывает широкий сдвиг от устойчивого позитивного фандинга во время движения к $120 тыс. к increasingly нейтральным и негативным значениям по мере отката цены к $70 тыс. Этот переход отражает значительный unwind long-side позиционирования.
Более ранние фазы экспансии характеризовались persistent позитивным фандингом, сигнализируя об агрессивном long leverage и усилении тренда. В contrast, текущий режим отмечен episodic спайками негативного фандинга, suggesting, что трейдеры либо хеджируют downside exposure, либо тактически short позиционируются в слабость.
Поскольку leverage больше не структурно skewed в long, derivatives complex перешел в более оборонительную posture. Устойчивое восстановление, вероятно, потребовало бы стабилизации фандинга alongside renewed спотового спроса, а не полагаясь solely на short-covering потоки.
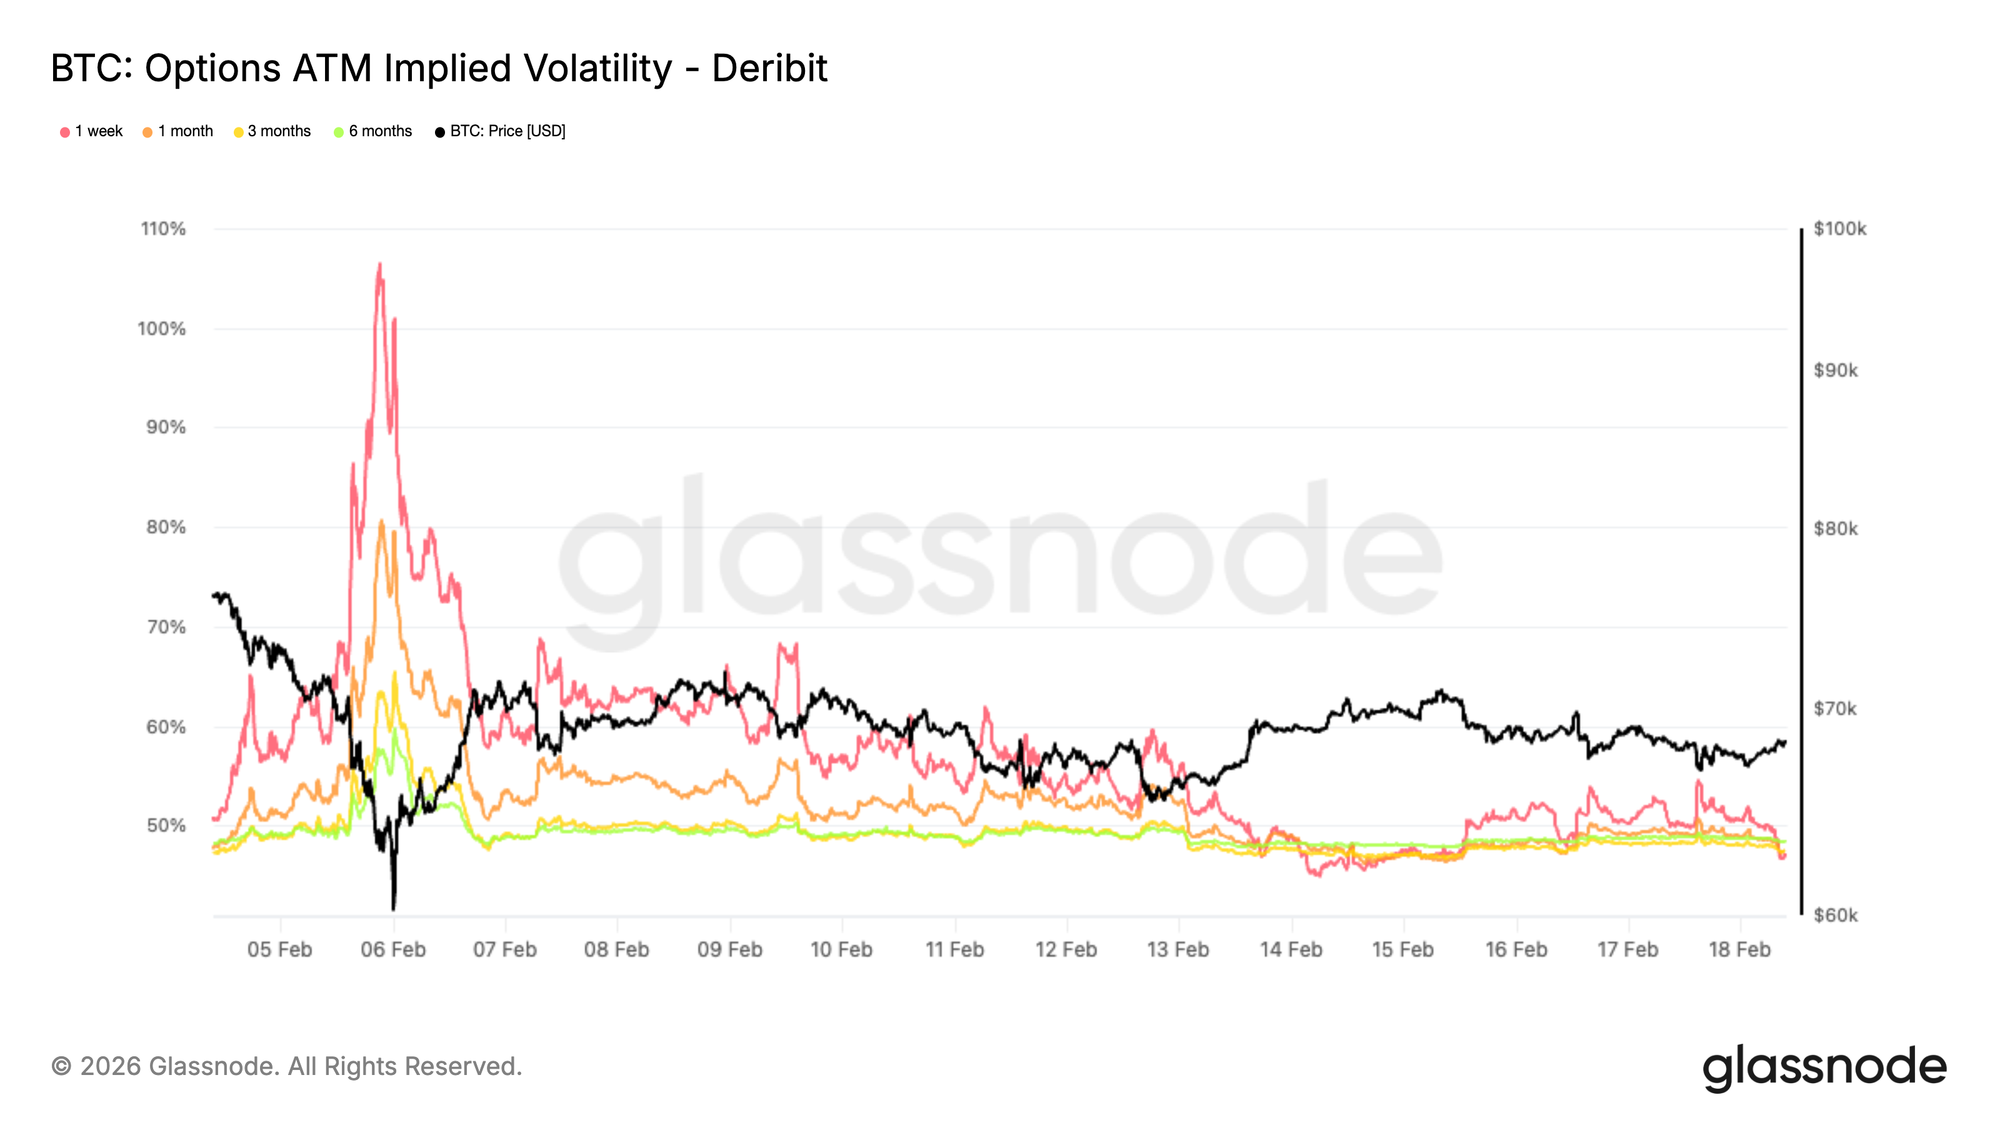
Паническая премия перезагружается
Подразумеваемая волатильность (IV) ATM с месячным сроком экспирации резко сжалась с недавних panic highs, которые достигли 80% для одномесячного tenor и 65% для трехмесячного, до примерно 47% по обоим срокам.
Это снижение отражает значительное сокращение immediate спроса на хеджирование downside. Во время фазы ликвидации трейдеры агрессивно платили за краткосрочную защиту. Эта срочность теперь исчезла.
Премия за волатильность (volatility risk premium) unwound по мере сокращения оборонительного позиционирования. Рынок больше не оценивает сценарий imminent crash и instead отражает ожидания консолидации с волатильностью, содержащейся в более narrow диапазоне.
Это не подразумевает renewed бычьего conviction. Скорее, это signals, что stress pricing нормализовалось и позиционирование перезагружается. Вывод структурный. Фаза вынужденного хеджирования, по-видимому, позади, и ожидания волатильности recalibrating ниже по мере стабилизации рыночного позиционирования.
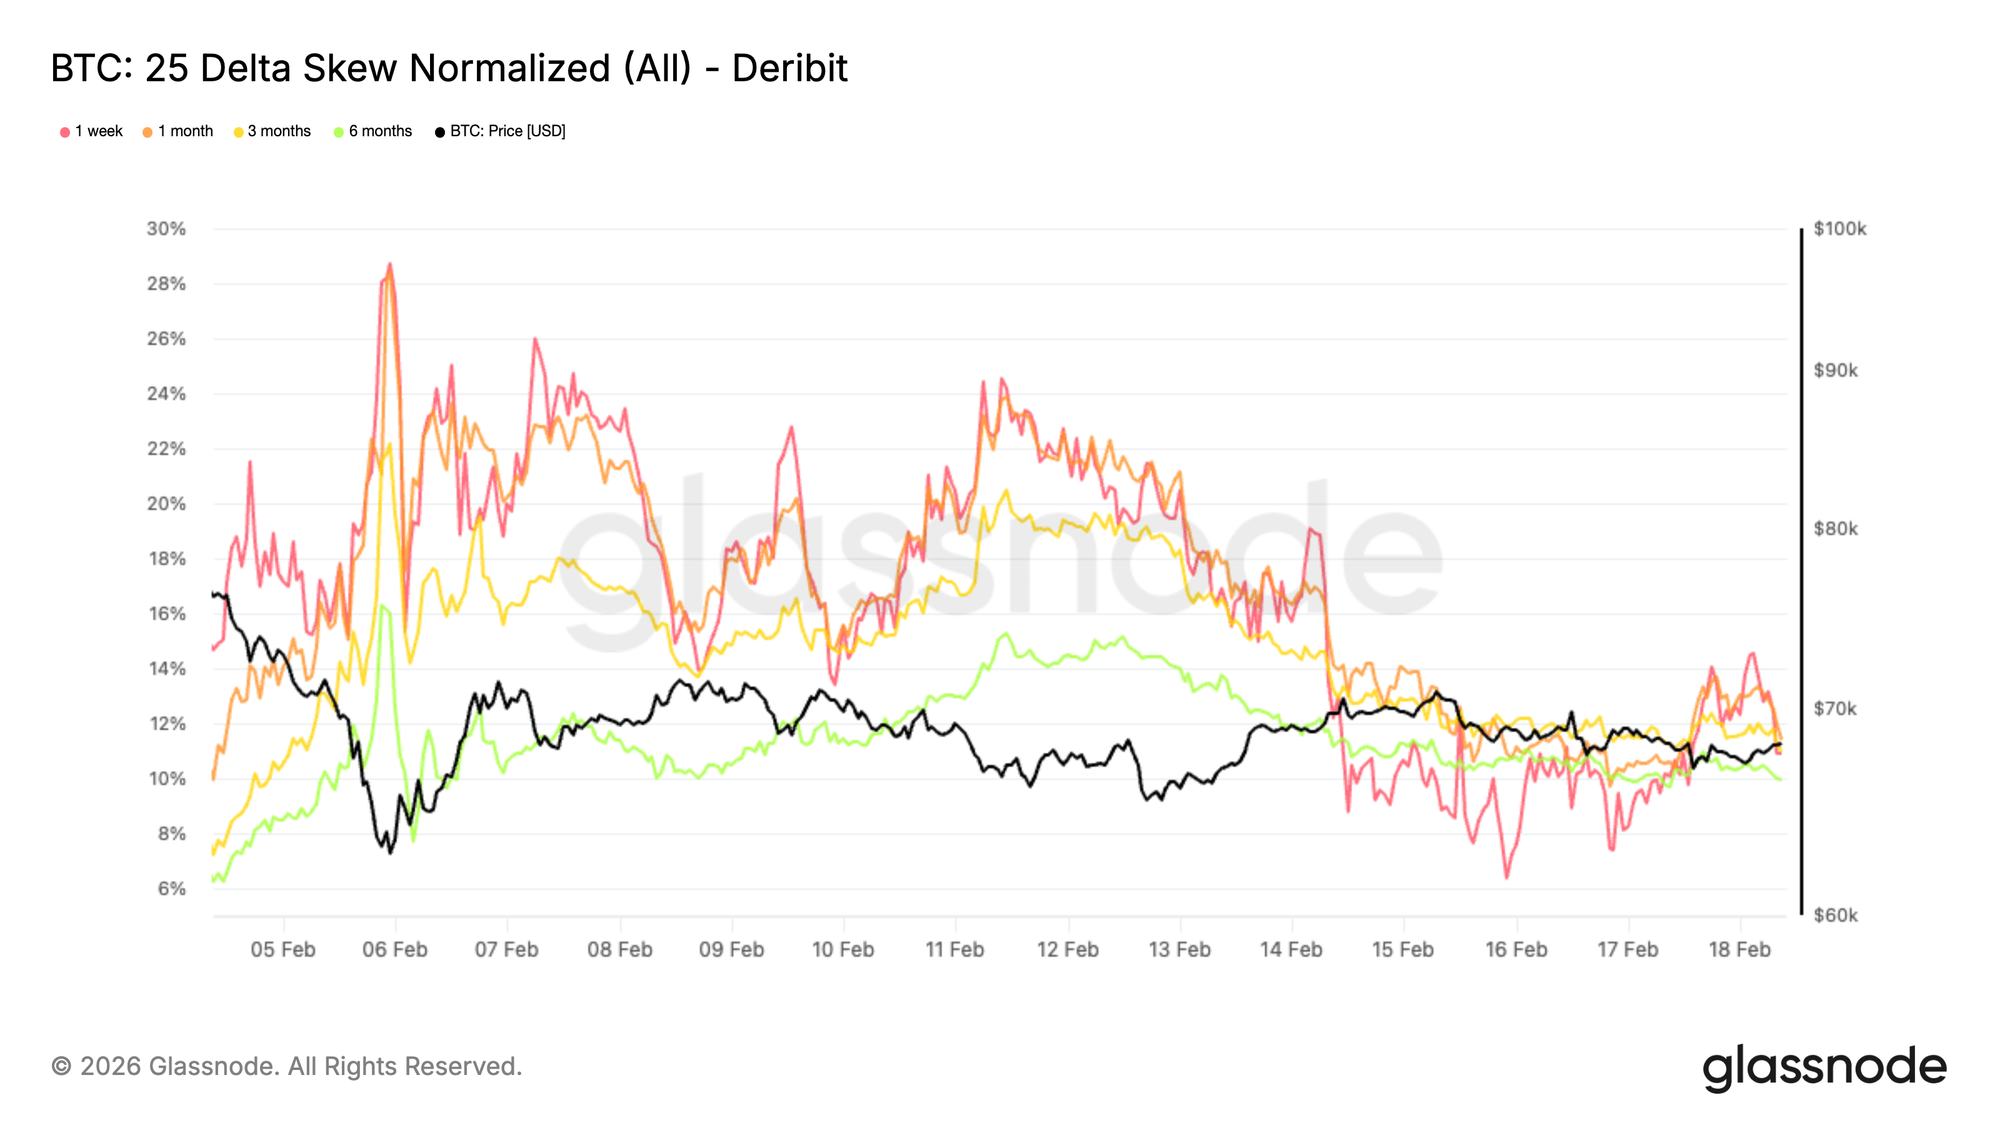
Экстремальный downside skew ослабевает
25-дельта скью (skew), который измеряет разницу в волатильности между downside путами и апсайд коллами, значительно сжался. Положительное значение указывает, что путы оценены дороже, чем коллы, сигнализируя о более сильном спросе на защиту от падения.
После retest региона $60 тыс. скью держался near 20%. С тех пор он ослаб до roughly 11% по всем tenorам, marking резкое moderation на 9 пунктов за recent сессии.
На минимумах путы торговались со значительной премией, поскольку трейдеры бросились обеспечить crash protection. Эта срочность subsided. Однако скью остается elevated относительно pre-selloff уровней, указывая, что downside хеджирование все еще предпочтительнее апсайд экспозура.
Трейдеры сокращают экстремальные хеджи хвостовых рисков, но они не rebuild апсайд convexity. Вывод сбалансированный. Стресс смягчился, но позиционирование остается осторожным, а не конструктивным.
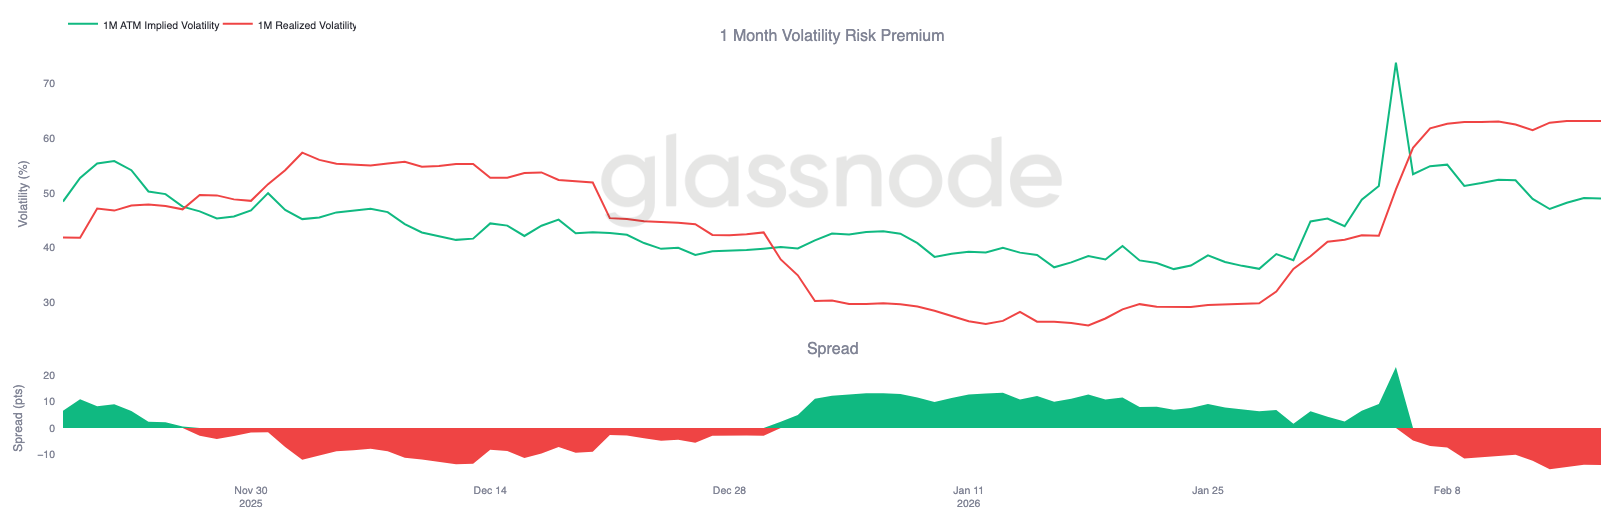
Премия за волатильность расходится
По мере сжатия подразумеваемой волатильности и нормализации скью, одномесячная премия за волатильность (volatility risk premium) предоставляет дополнительный контекст. Этот показатель сравнивает подразумеваемую волатильность с реализованной, оценивая, оценивают ли опционные рынки большее или меньшее движение, чем materialized на самом деле.
Во время liquidation-driven движения реализованная волатильность резко расширилась, при этом large дневные диапазоны pushed краткосрочные realized метрики materially выше.
В то же время подразумеваемая волатильность начала retrace по мере fade панического спроса на хеджирование. Это расхождение often появляется на поздних стадиях stress эпизода.
Когда реализованная волатильность spikeет, а подразумеваемая снижается, это typically suggests, что forced компонент движения в основном прошел.
Поскольку crash хеджи unwound, а позиционирование стабилизируется, реализованная волатильность, вероятно, moderate с elevated уровней по мере перехода рынка от reactive потоков к более deliberate динамике позиционирования.
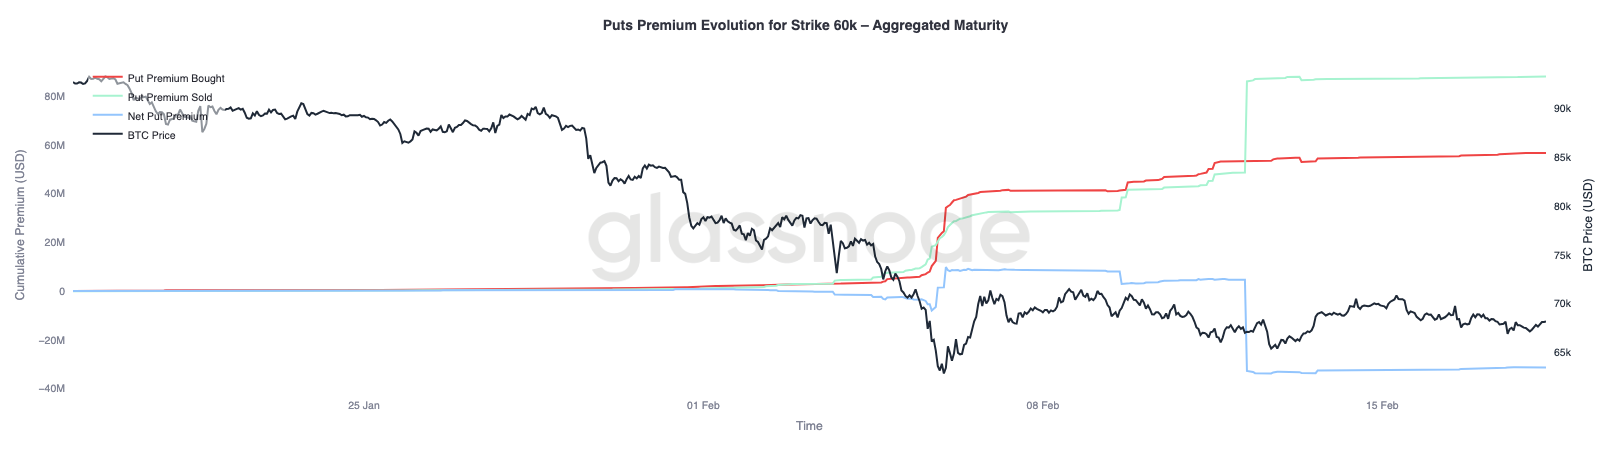
Премия путов $60K: Появляется unwind хеджей
Приближаясь к эволюции премии путов $60K, поведенческий сдвиг становится clearer. Во время и immediately after краха, премия путов bought доминировала в потоках, поскольку трейдеры агрессивно накапливали downside protection на этом страйке, reinforcing спрос на crash insurance.
По мере стабилизации цены эта динамика начала reverse. Downside хеджи gradually unwound, и премия путов sold увеличилась meaningfully. Разрыв между премией bought и sold widened в пользу sellers, pushing net премию ниже. Некоторые участники теперь monetizing previously приобретенную защиту, пока волатильность на этом страйке остается relatively elevated.
Более широкая картина consistent. Рынок остается осторожным, но срочность владения crash protection fade. Вместо того чтобы rebuild апсайд экспозур, трейдеры, по-видимому, repositioning для более contained environment, где range-bound динамика заменяет panic-driven потоки.
Заключение
Биткоин остается confined within структурно определенного коридора между Истинной Рыночной Средней near $79 тыс. и Реализованной Ценой around $54,9 тыс. Пробой ниже active себестоимости shifted режим firmly оборонительным, при этом цена теперь полагается на кластер спроса $60–$69 тыс. для поглощения persistent sell pressure. Хотя эта зона до сих пор moderated downside momentum, conviction остается хрупким.
Ончейн накопление improved от outright дистрибуции, но еще не transitioned в сильные, large-entity покупки. Условия ликвидности остаются constrained, как отражено Коэффициентом Реализованной Прибыли/Убытка, hovering в сжатом диапазоне 1–2, indicating limited ротация капитала. Спотовые потоки продолжают skew негативными, и оттоки ETF confirm, что институциональный спрос в настоящее время не обеспечивает structural bid.
В деривативах panic фаза, по-видимому, fade. Подразумеваемая волатильность и скью сжались, и crash хеджи unwound. Однако эта нормализация отражает стабилизацию, а не renewed бычье позиционирование.
В совокупности, рынок переходит от reactive ликвидации к controlled консолидации. Для emergence устойчивого восстановления потребуются renewed спотовой спрос, sustained накопление и improving условия ликвидности. До тех пор доминирующей структурной темой остается поглощение в рамках диапазона между ключевыми ценовыми ориентирами.
Отказ от ответственности: Этот отчет не предоставляет каких-либо инвестиционных рекомендаций. Все данные предоставляются исключительно в информационных и образовательных целях. Ни одно инвестиционное решение не должно основываться на информации, предоставленной здесь, и вы solely несете ответственность за свои собственные инвестиционные решения.
Балансы бирж, представленные здесь, получены из комплексной базы данных Glassnode меток адресов, которые собираются как через официально опубликованную информацию бирж, так и через проприетарные алгоритмы кластеризации. Хотя мы стремимся обеспечить максимальную точность в представлении балансов бирж, важно отметить, что эти цифры могут не всегда охватывать всю entirety резервов биржи, particularly когда биржи refrain от раскрытия своих официальных адресов. Мы призываем пользователей проявлять осторожность и осмотрительность при использовании этих метрик. Glassnode не несет ответственности за любые discrepancies или потенциальные неточности.
Пожалуйста, прочитайте наше Уведомление о прозрачности при использовании данных бирж.