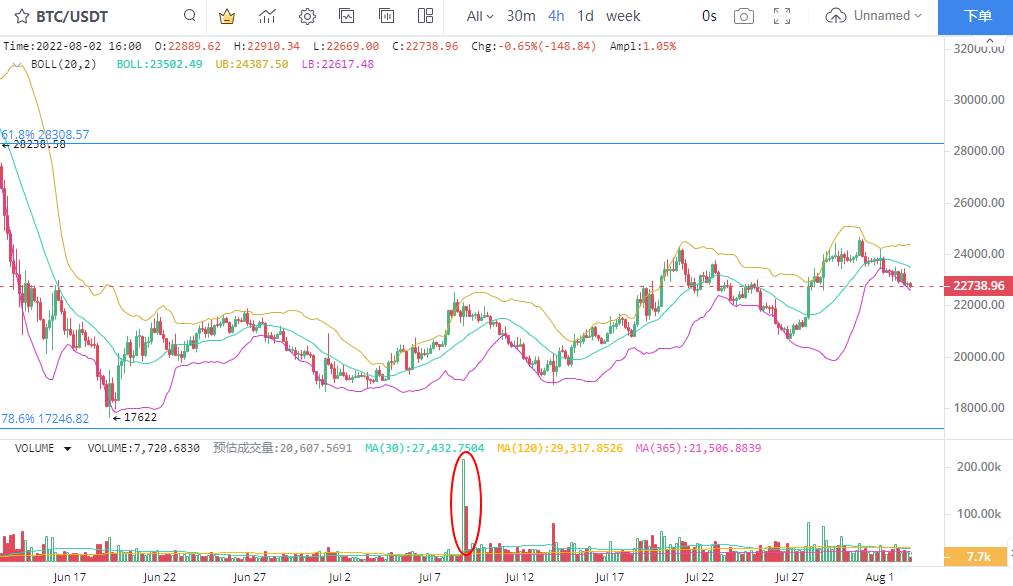
1. BTC triple negative callback
The 4-hour K-line chart shows that the overall trading volume of BTC began to increase after the peak trading volume on July 8. The average trading volume after July 8 is very high, which means that more BTCs have completed turnover in the near future. At the same time, we can see that although the average trading volume is relatively high, the downward trend of trading volume has been confirmed. Since July 29, the price callback space has increased in the process of BTC trading volume shrinking.
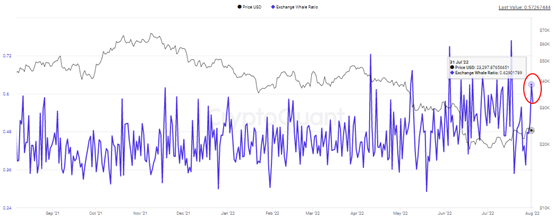
2. The proportion of BTC's main selling pressure rose
BTC's main selling pressure rebounded significantly. Numerically, the proportion of main selling pressure reached 0.572 on August 1, and the short-term peak occurred on July 31, reaching 0.629. Judging from the strength of selling pressure, the peak value of BTC selling volume has reached a short-term high, but whether the value can maintain a high level needs further verification.
The proportion of BTC's main selling pressure easily reached more than 0.5, and the value was close to 0.6, which means that the selling volume of BTC has been at a high level, with the potential risk of further lowering the price.
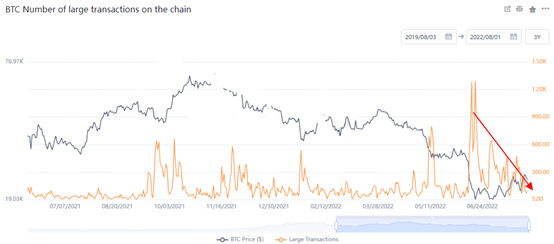
3. The transaction of giant whale on BTC chain continues to decrease
The trading volume of BTC's main chain continues to decline, and its value has fallen from a high of 1295 to around 77, while the average value has fallen back to 200 per day. In terms of transaction volume, the transaction volume of BTC on August 1 was 93, a decrease of 1202 compared with 1295 on June 18. Judging from the transaction volume of 500 BTCs per large transaction, the transaction volume of BTC decreased by 600000 BTCs. This shows that BTC's trading enthusiasm is falling, and the impact of the rebound in trading volume triggered by the decline has been very small. This also shows that BTC may enter the bear market contraction operation state again, and the decline expectation is increased.
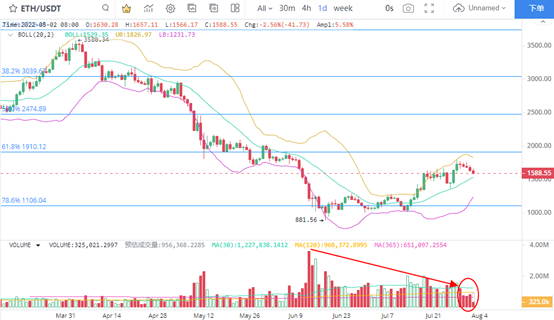
4. Eth trading volume remained low
The characteristics of eth trading volume downturn are more clear, especially compared with the previous peak trading volume in June, the recent intraday trading volume is about 12% of the peak level. Therefore, the weak short-term rise of eth is indeed supported by data. According to the characteristics of low trading volume of eth, it is difficult to maintain high prices in the short term. Next, the possibility of eth falling back to the $1000 platform increases.
Combined with the recent high number of eth active addresses and the higher activity of sending eth, the judgment of price decline is verified.
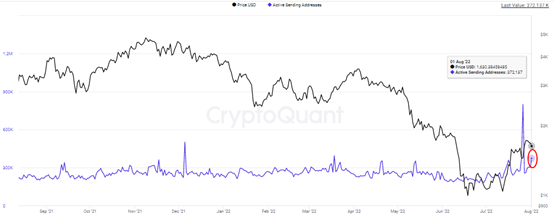
5. The number of eth sender addresses rebounded again
In the rebound stage of eth's active address number, the address activity of sending eth performs better, indicating that more eth may be used by investors for selling. The figure shows that the number of active addresses of eth rebounded to a high of 799000 on July 26, which means an increase of 190% compared with the recent average of 275000. On August 1, the number of active addresses sending eth showed signs of rebound, reaching a high of 372000.
At the transaction level, ETH has heavy short-term selling pressure, and the risk of holding currency has increased. We should pay attention to the low absorption opportunities for further correction.