Executive Summary
- Over the weekend, Bitcoin’s liquidity faced a significant test, as a large size early investor distributed over 80k BTC via Galaxy Digital’s OTC services. Despite this $9.6B in sell-side volume, the market absorbed the sell-side pressure efficiently, driving the price down to $115K before shortly stabilizing at $119K, just below the ATH.
- Even after this large distribution event, the magnitude of unrealized profit held by market participants remains strong. Over $1.4T in paper gains are currently held, with 97% of the circulating supply still in profit.
- According to several on-chain valuation models, Bitcoin remains range-bound between $105K and $125K. A decisive breakout above this range could open the door to a move toward $141K, an area likely to see increased sell-side pressure given the high unrealized profit expected at those levels.
Deeply Liquid
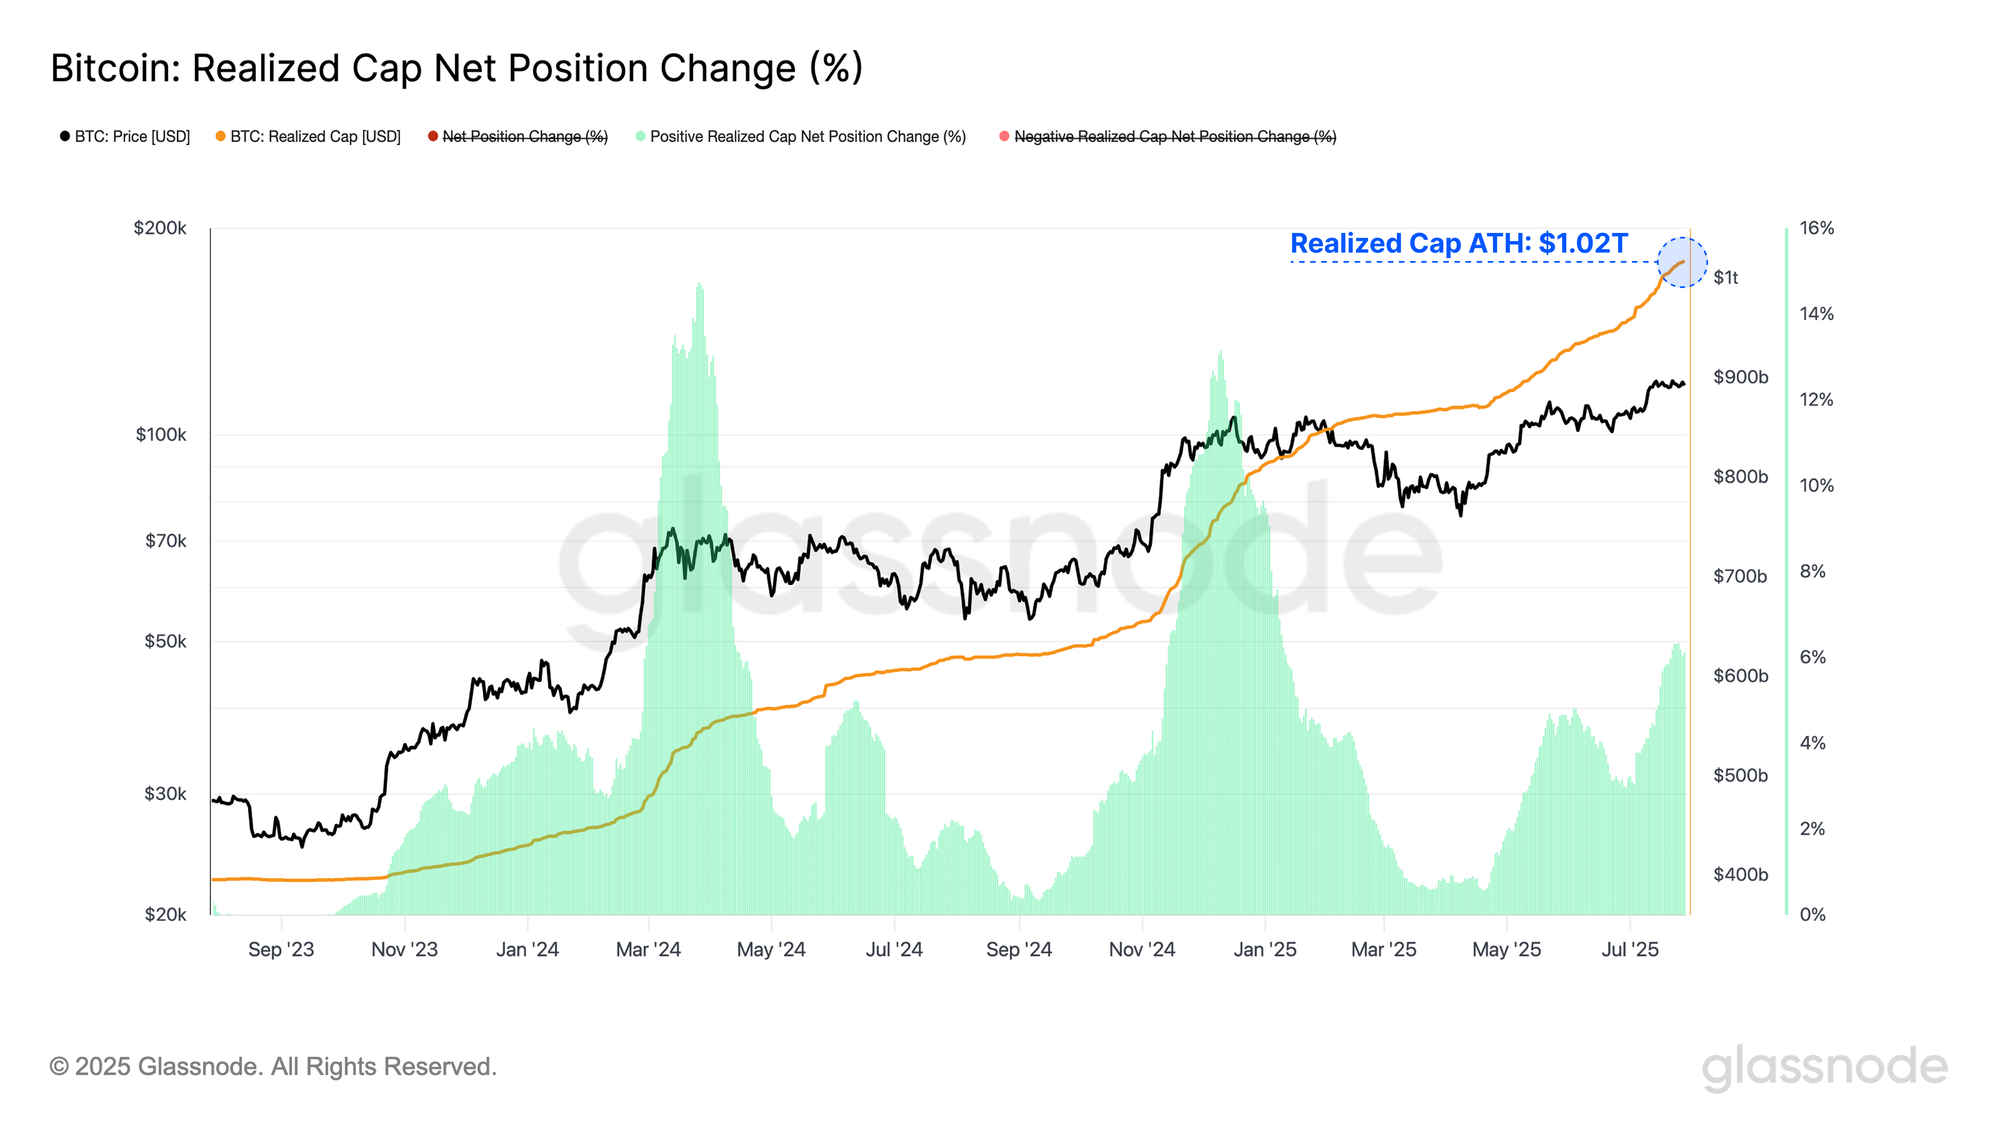
The Realized Cap is a foundational metric in on-chain analytics, quantifying the total USD-denominated liquidity stored within the Bitcoin network. As of now, it stands at over $1.02T, underscoring the asset's immense and growing liquidity profile and market depth.
This liquidity was put to the test over the weekend, as an early Bitcoin investor, via Galaxy Digital’s services, distributed 80k BTC (~$9.6B), likely through a mix of market sales and OTC transactions. The resulting sell-side pressure drove the price down to $115K, before stabilizing at $119K.
This episode illustrates Bitcoin's ability to absorb large sell-side volumes, even during typically thinner weekend trading hours, reinforcing the market's structural robustness.
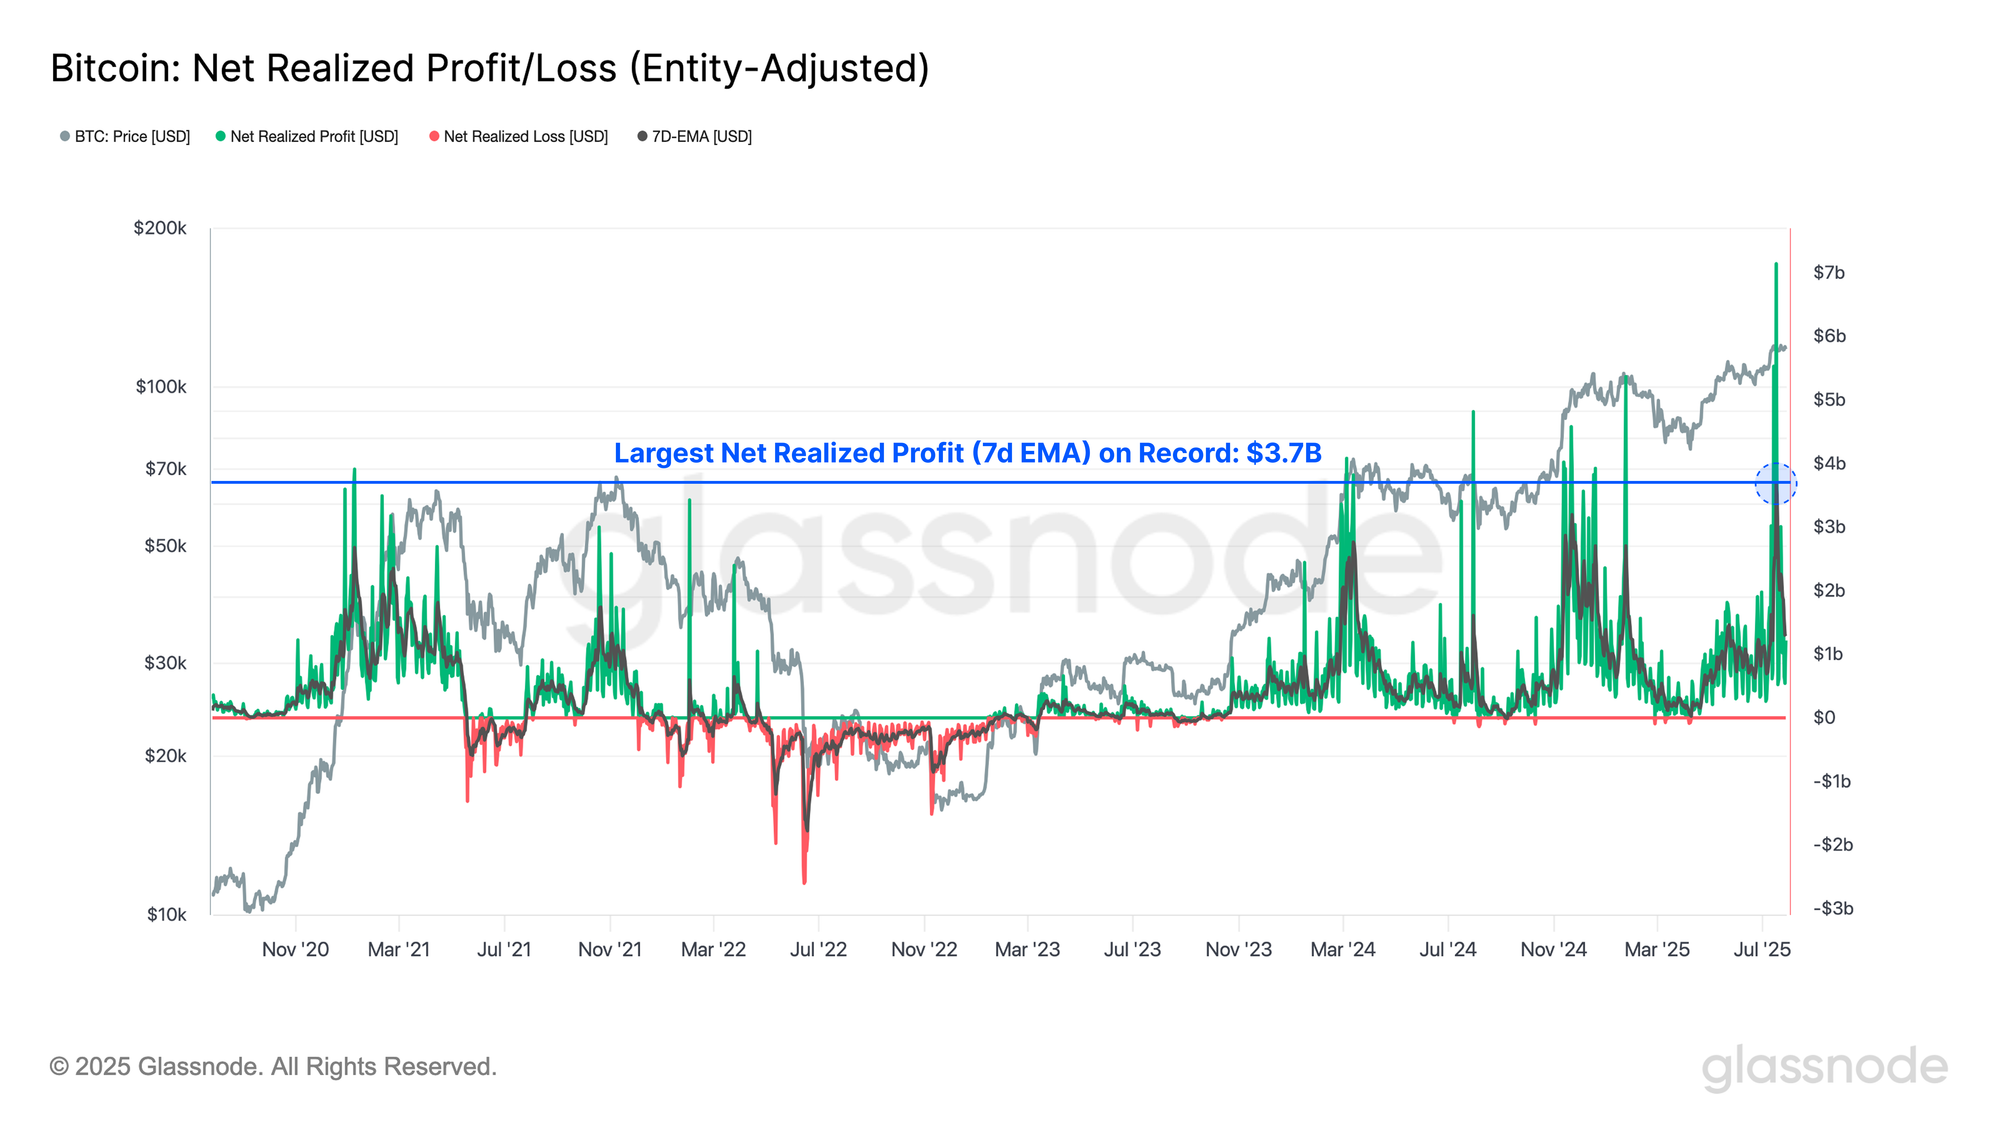
Consequently, this event catalyzed a significant spike in the Net Realized Profit/Loss metric, which reached an all-time high of $3.7B. Notably, the spike preceded the weekend sell-off and reflected the movement of coins in advance of the final distribution.
Since the original cluster of coins had been flagged by entity-adjustment heuristics as part of an internal transfer, subsequent movements from those addresses via Galaxy Digital were then recorded as economically meaningful transactions, and a changing of hands.
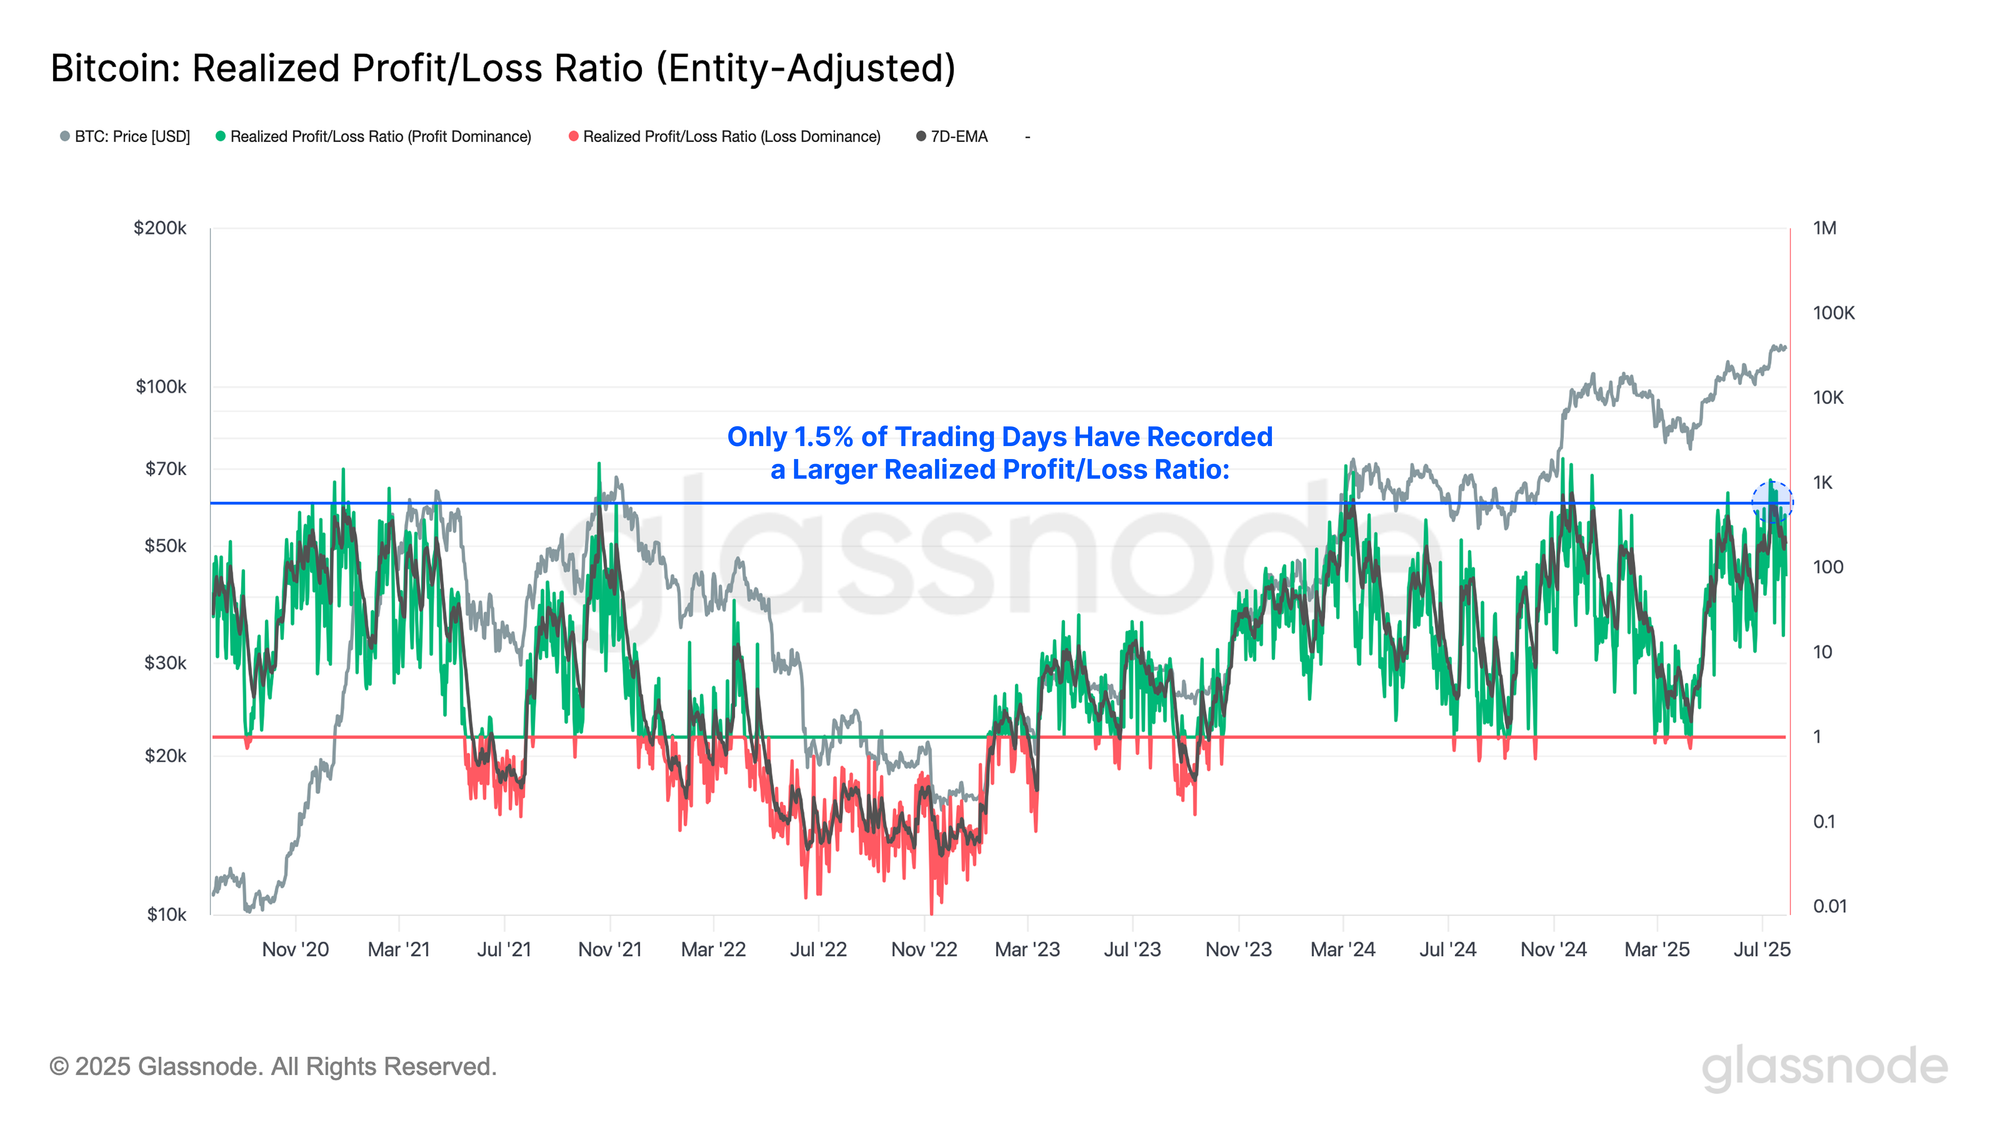
The recent influx of profit-taking has driven a sharp acceleration in the Realized Profit/Loss Ratio, with realized profits now exceeding losses by a multiple of 571. This is considered to be a highly elevated level, surpassed by only 1.5% of trading days.
However, interpreting this signal requires nuance. While extreme profit-taking can coincide with price tops, as observed at the $73K all-time high in March 2024, this isn’t always immediate. For example, during the $100K breakout in late-2024, profit-taking peaked when the price was at $98K, however the market continued to climb another 10% before finally peaking at $107K.
This lag suggests that significantly elevated profit taking volumes often precede, but don’t always instantly cause, market exhaustion. It acts as supply which must be absorbed, and this can take time before the market fully responds.
Time in the Market
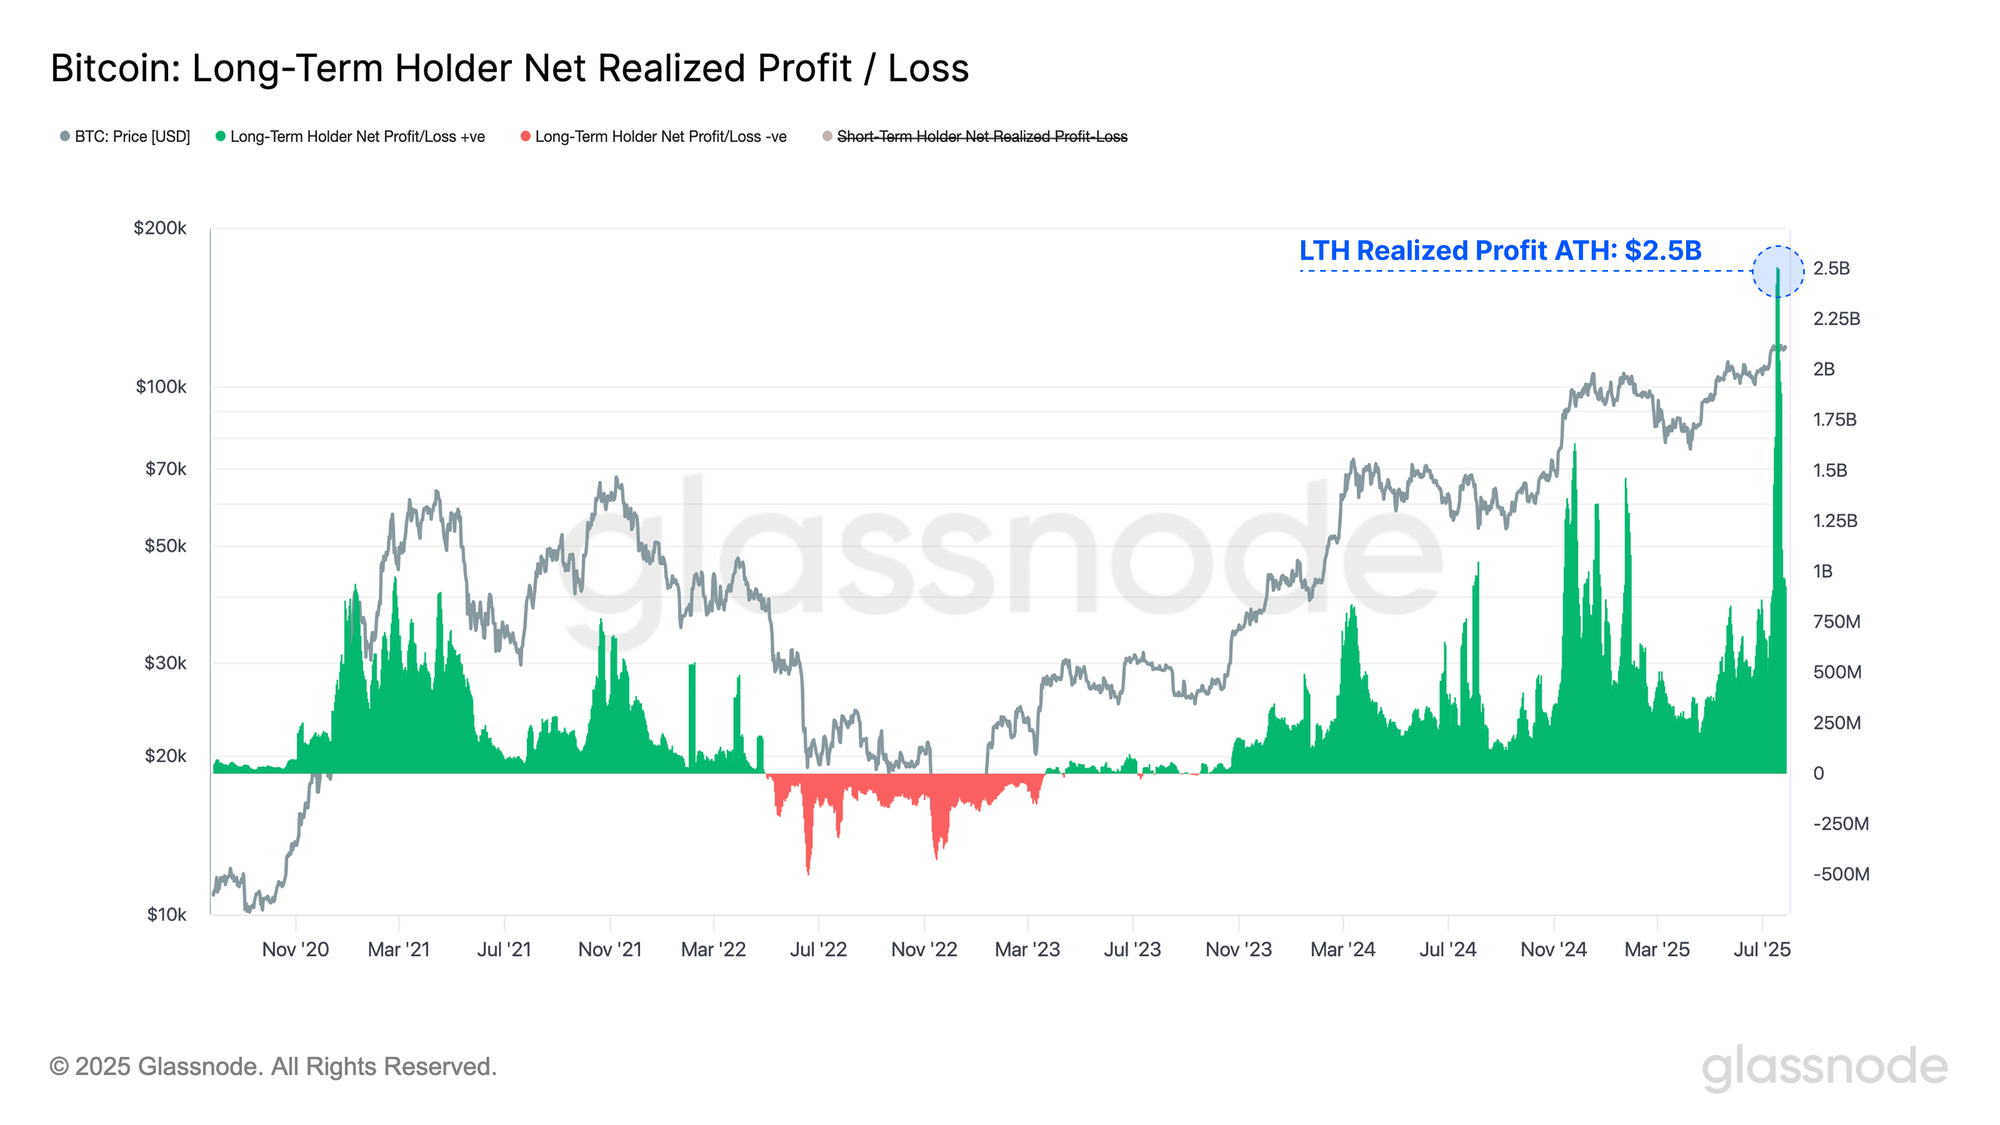
Following the absorption of a substantial tranche of long-dormant coins, the Long-Term Holder Net Realized Profit/Loss has surged to a new all-time high of $2.5B, surpassing the previous peak of $1.6B. This marks the single largest sell-side pressure event in Bitcoin’s history, an immense liquidity stress test, yet the market has remained remarkably resilient, with price holding just below its all-time high.
It stands as further evidence of the extraordinary capacity of the Bitcoin market to withstand intense distribution phases, following on from other major events this cycle such as the Mt. Gox repayments and German government BTC sales.
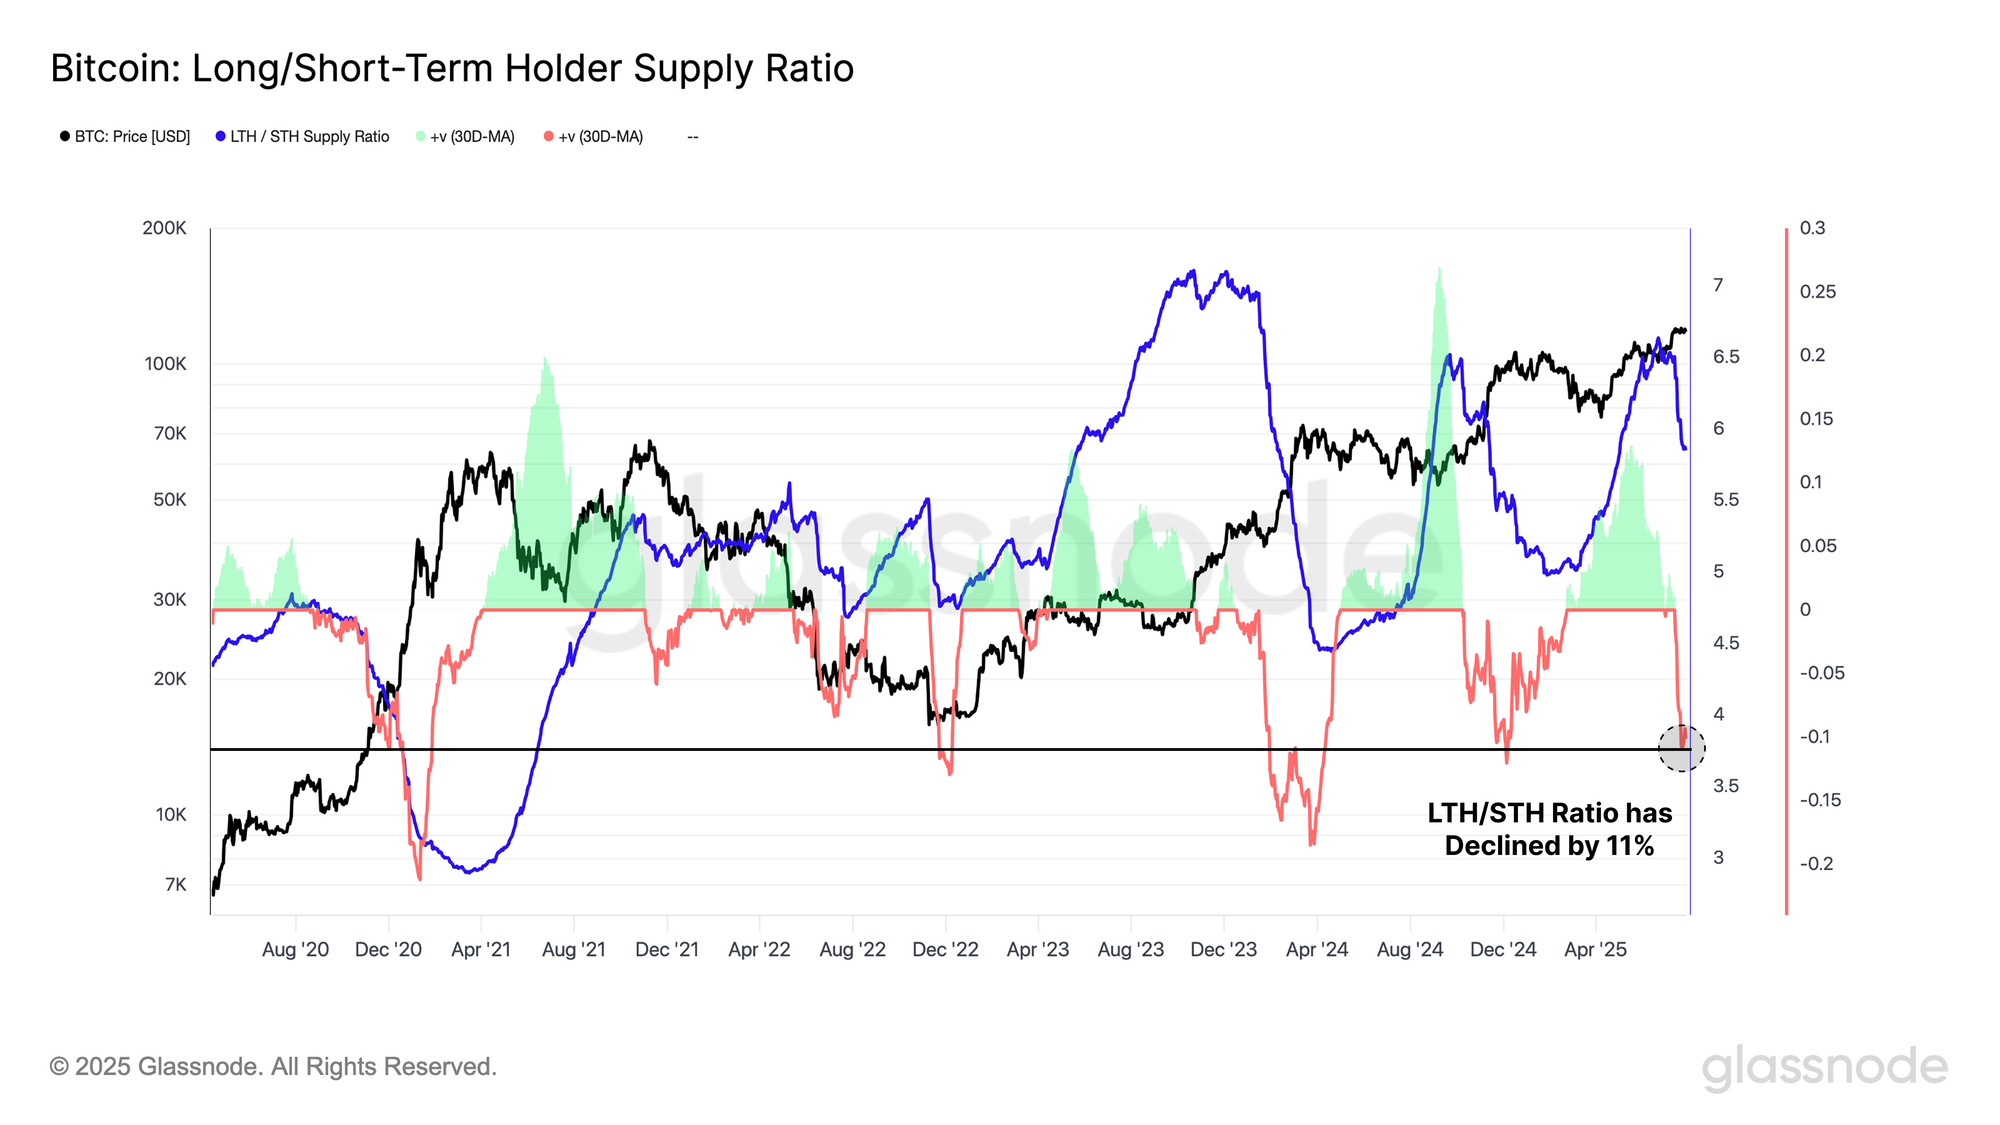
When comparing the ratio between Long and Short-Term Holder supply, a recurring pattern has emerged across all three ATH formations this cycle, with an initial phase of accumulation, followed by a sharp pivot into aggressive distribution.
Currently, this distribution phase remains underway, as the LTH/STH supply ratio continues to contract. Over the past 30 days, the ratio has declined by -11%, with only 8.6% of trading days registering a more severe drawdown, underscoring the intensity of the shift in investor behavior.
Unrealized Profits
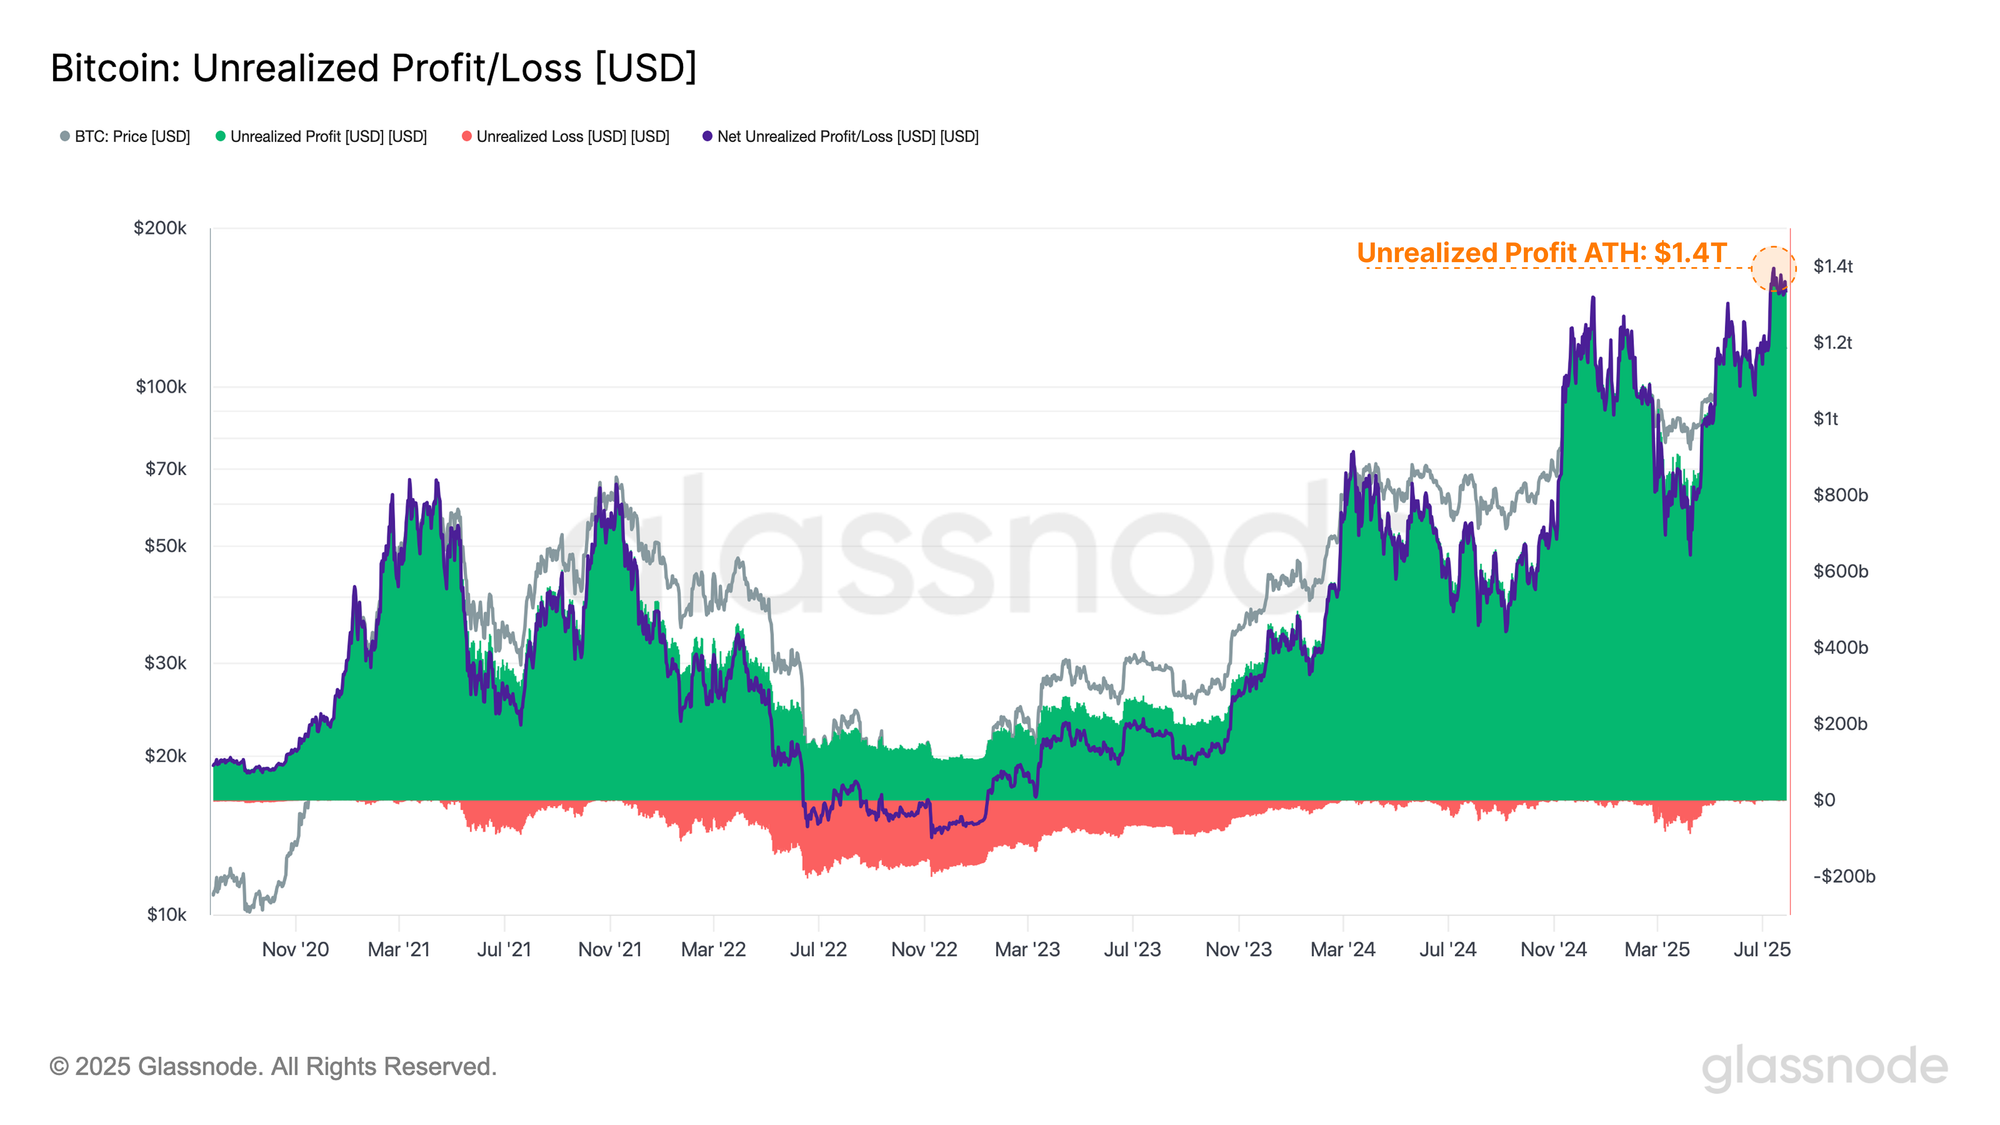
Despite the significant wave of sell-side pressure over the weekend, including substantial profit-taking by long-term investors, the Bitcoin market has remained remarkably stable. As a result, a super-majority of participants still hold their coins at a meaningful unrealized profit, with over 97% of the circulating supply still held, despite spot prices trading above their original acquisition price.
The total dollar value of paper gains across all market participants, called unrealized profits, recently reached an all-time high of $1.4T in aggregate. This underscores how the majority of investors are sitting on substantial paper gains, and sets up an environment of potential future sell-side pressure should prices continue to rise further.
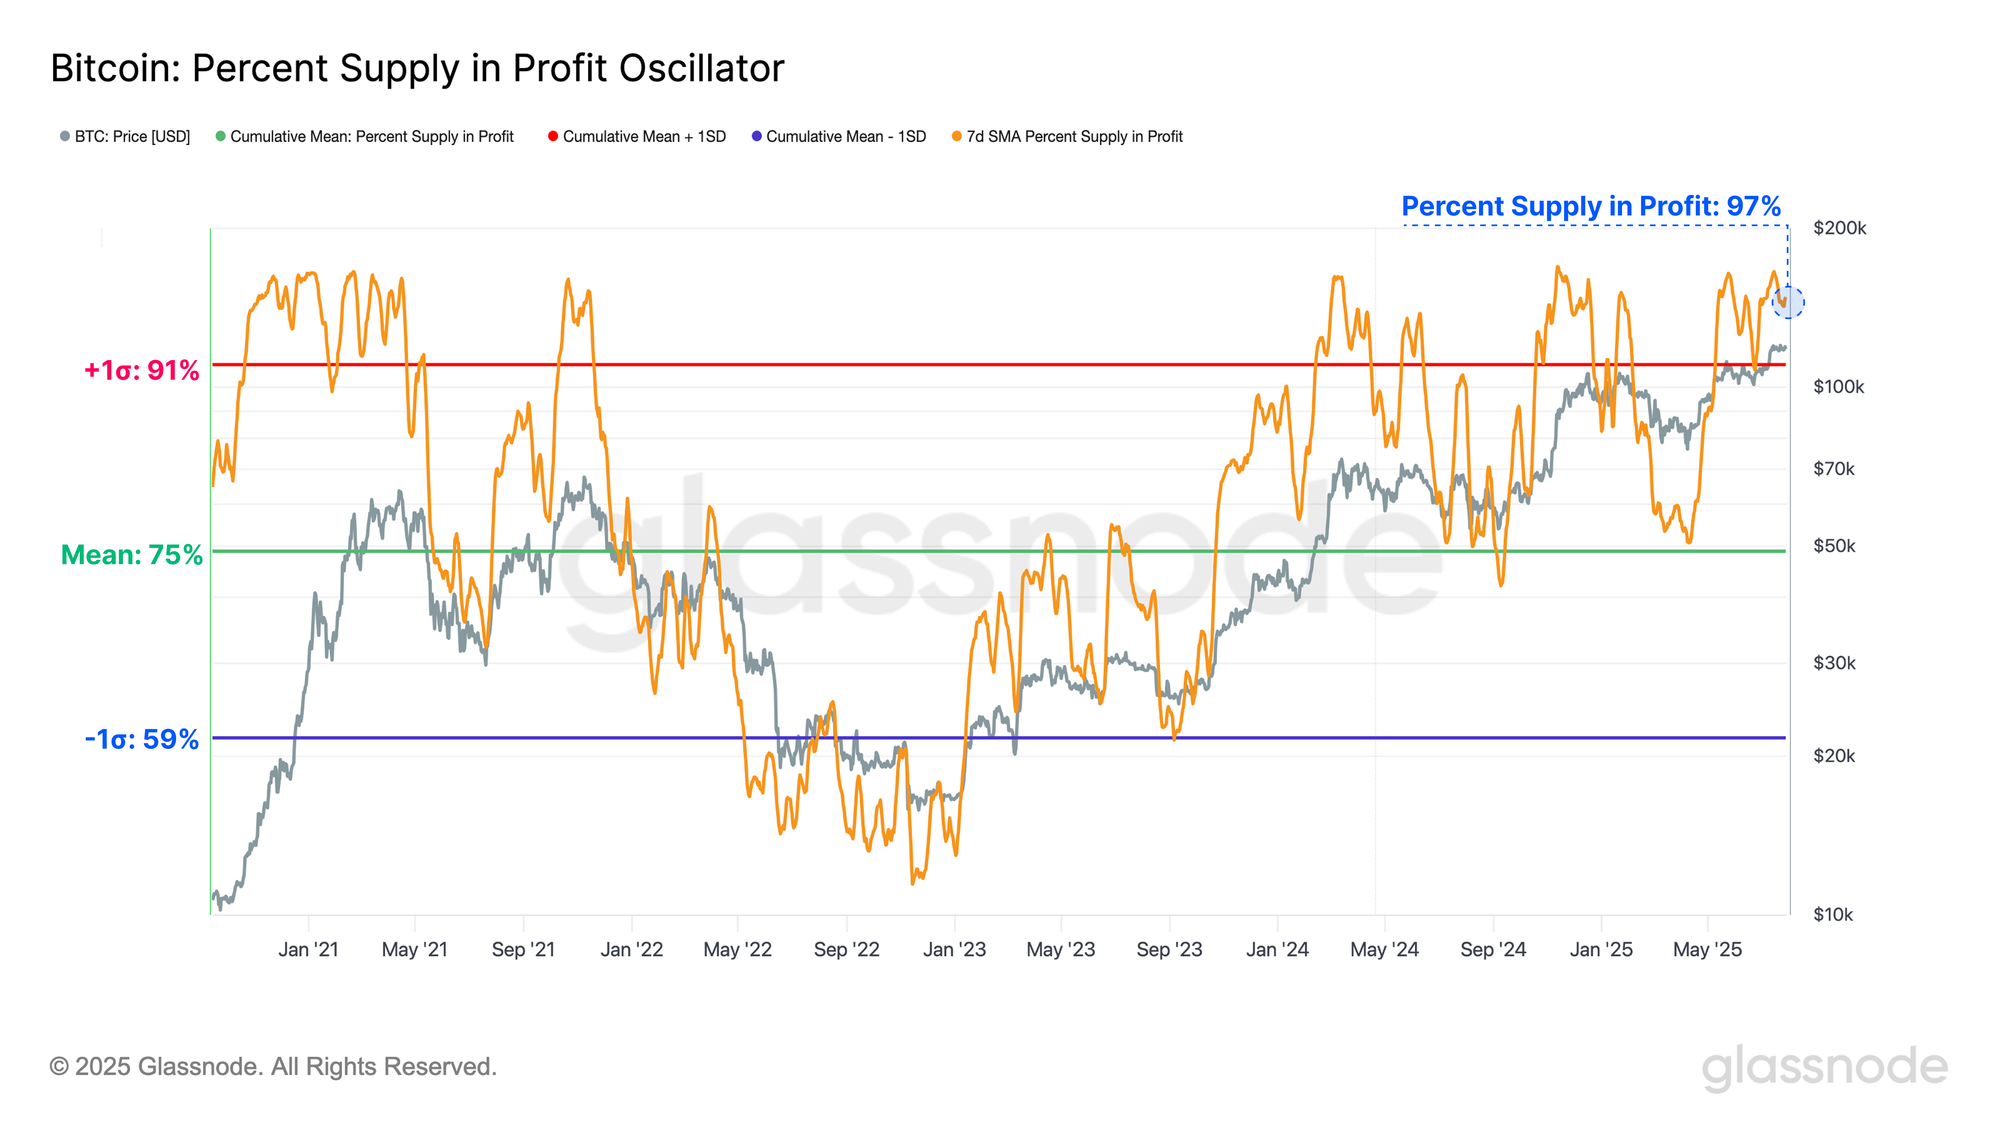
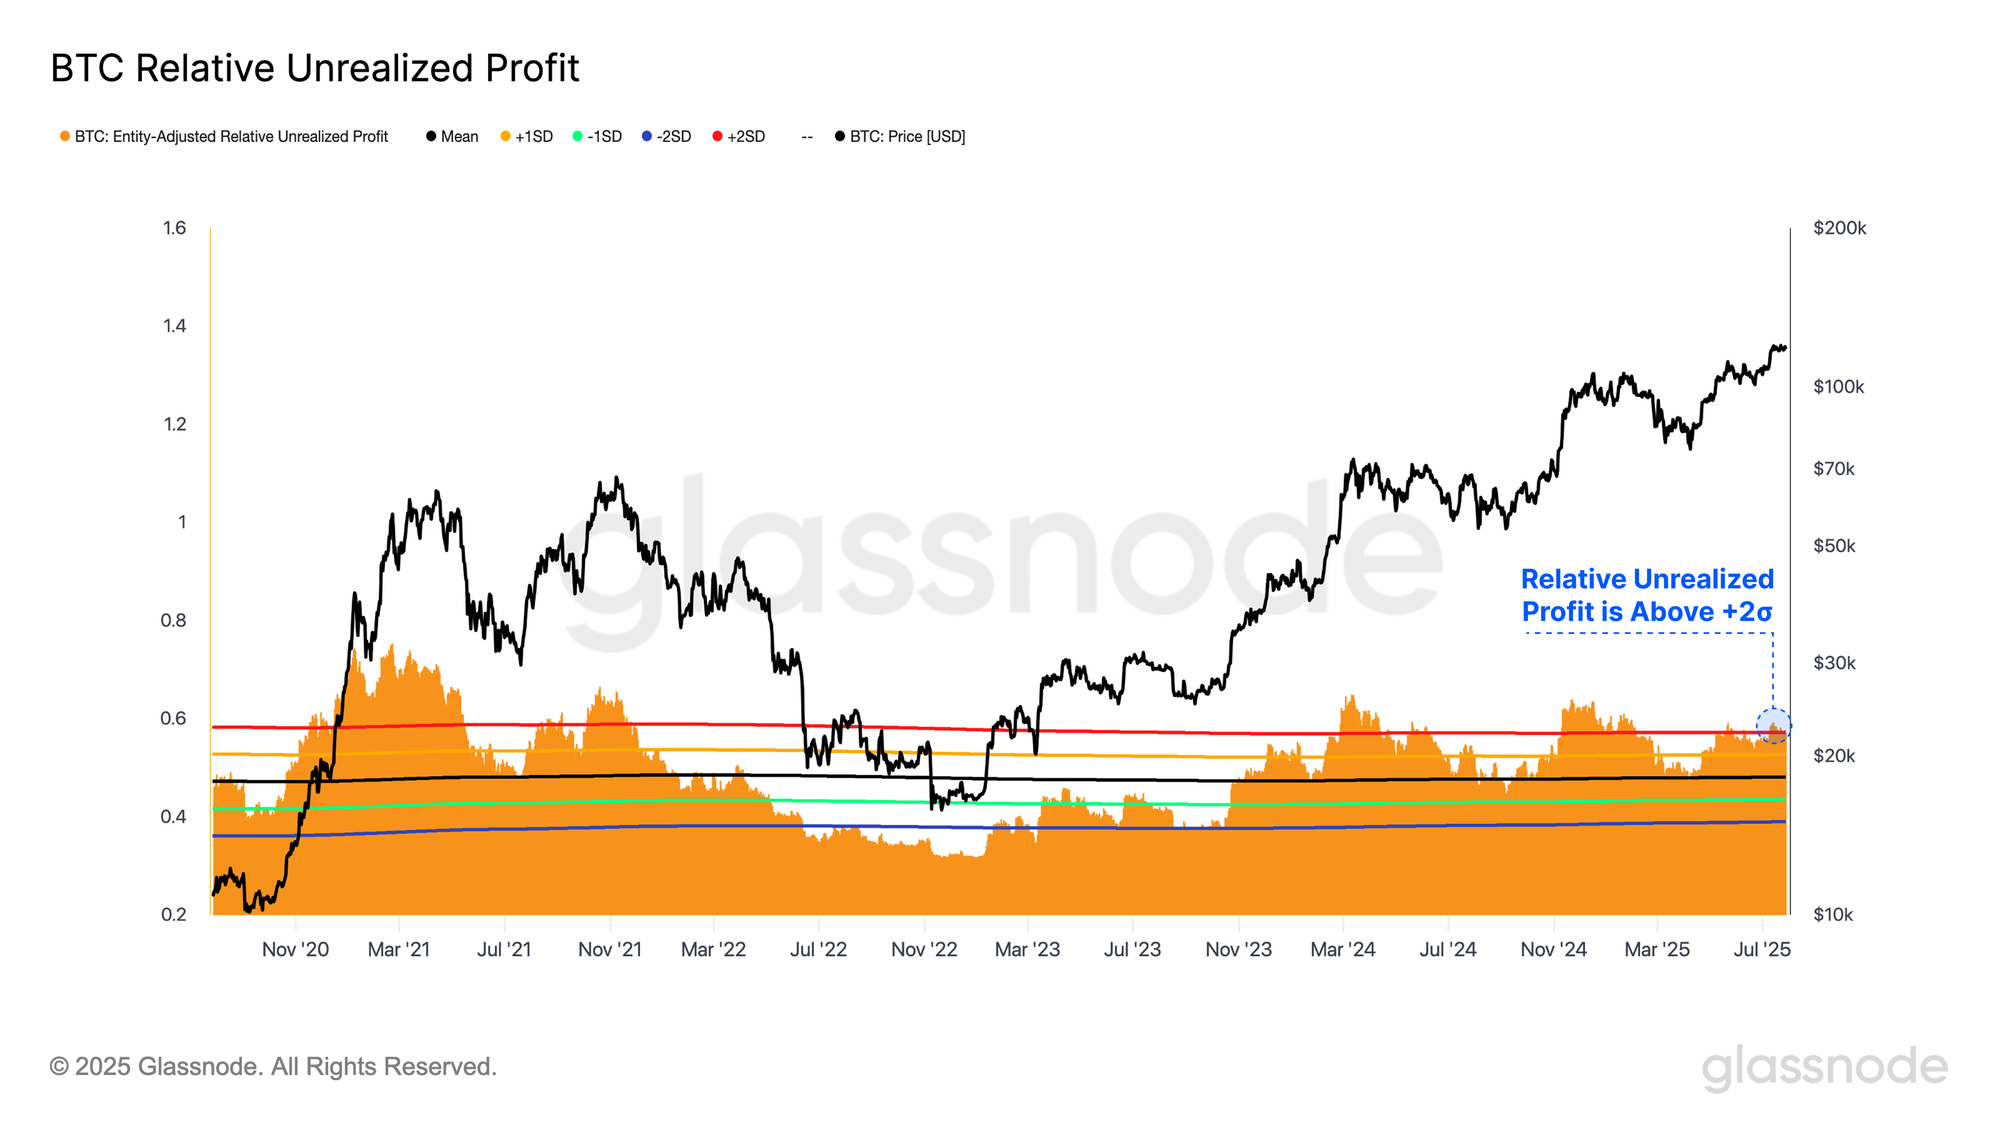
We can also assess Unrealized Profit as a percentage of market cap, offering a normalized view over time, as both profit held, and the asset size grow in tandem.
Currently, this metric is once again breaking above its +2σ band, a level that has historically aligned with periods of market euphoria and has coincided with each prior ATH formation. This further reinforces the idea that participants are sitting on substantial unrealized gains, even from a normalized perspective.
This would indicate that many investors are feeling quite positive about market conditions, acting as a tailwind for sentiment, but also a growing incentive to cash in on the road ahead.
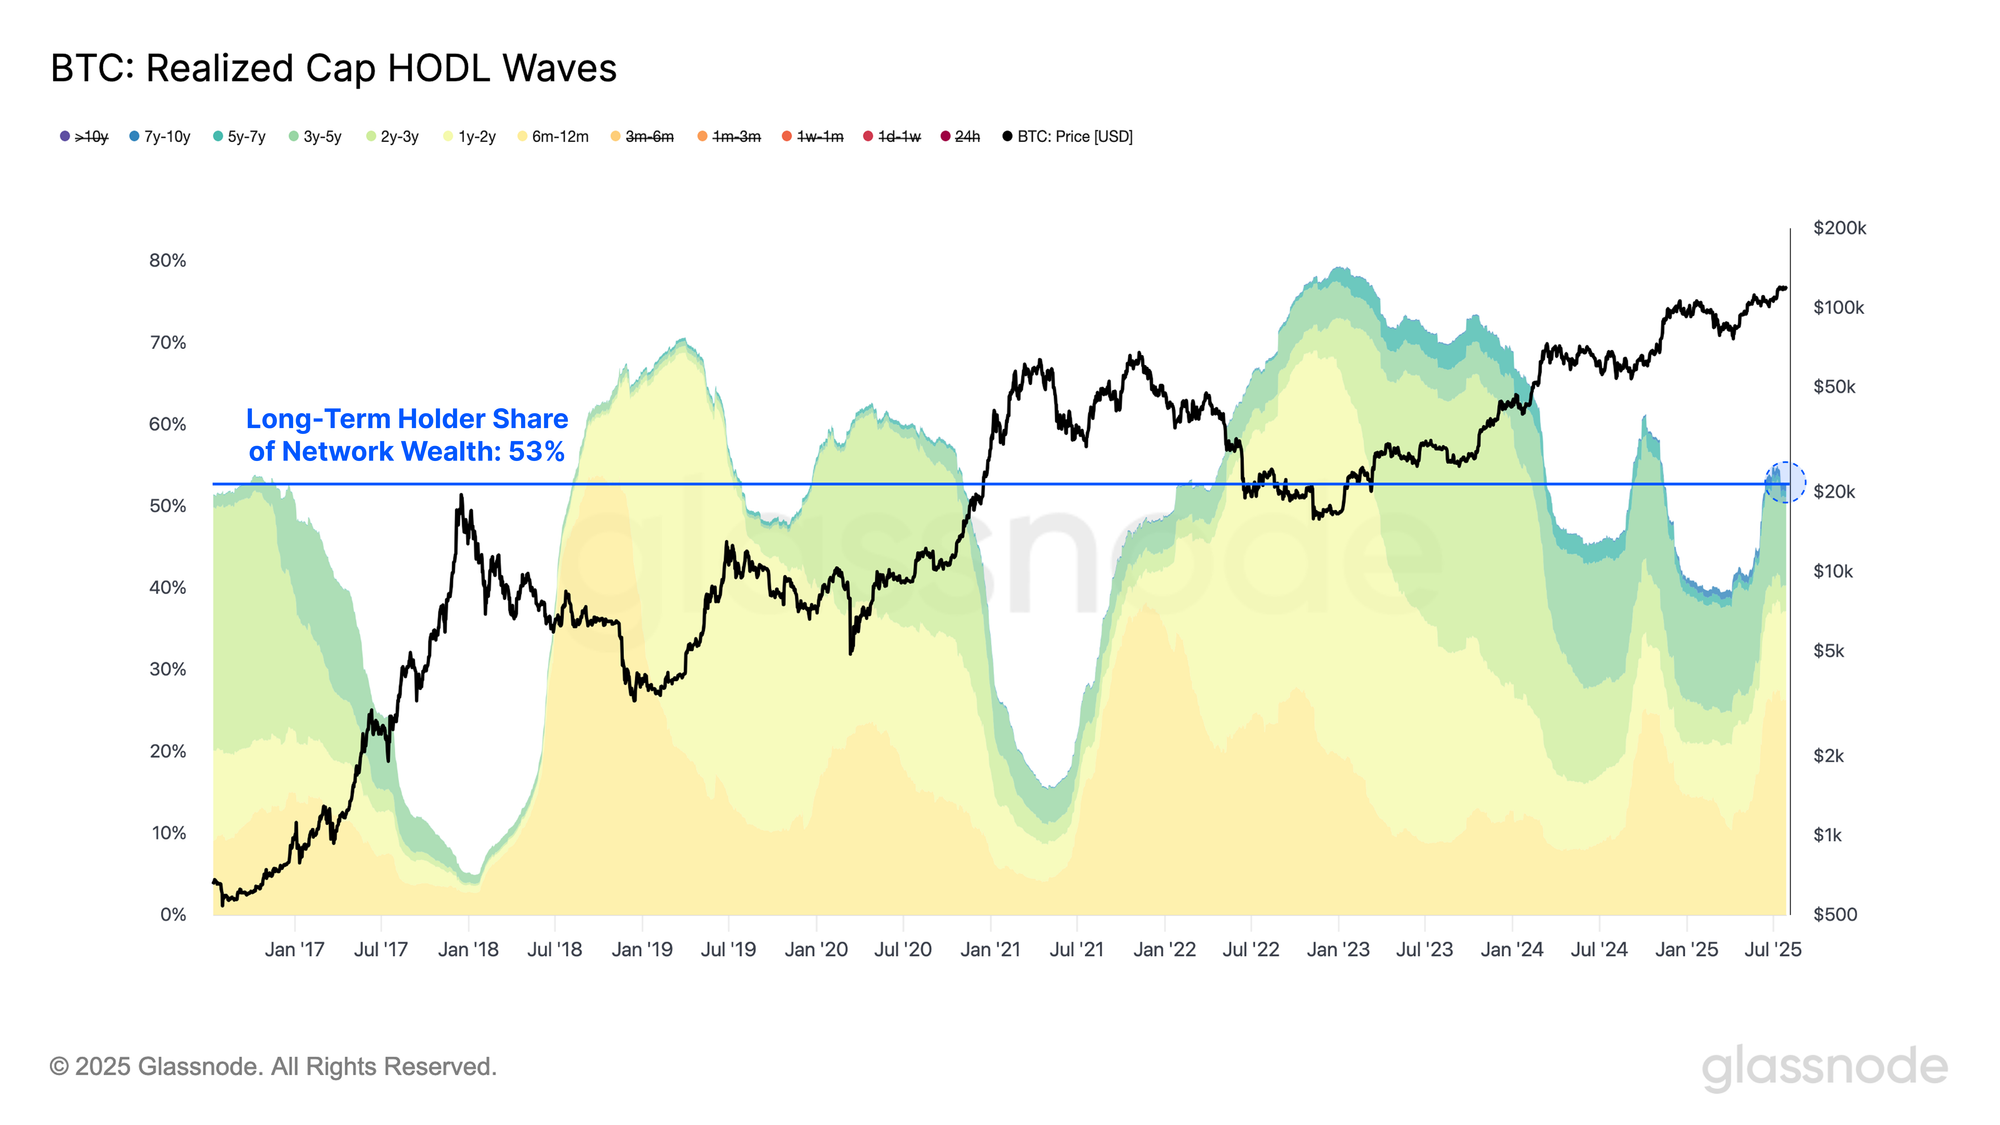
One notable differentiator in this cycle compared to previous ones is that Long-Term Holders still retain a substantial share of network wealth, currently sitting at 53%.
This remains true despite the cohorts significant distribution throughout the cycle. This is further supported by a broader market environment where unrealized profit is already meaningfully elevated.
This overall dynamic suggests that there may still be room for additional Long-Term Holder distribution, and as prices rise towards levels which are compelling enough to unlock deeper pockets of dormant supply, it will require greater inflows of demand to absorb.
Market Navigation
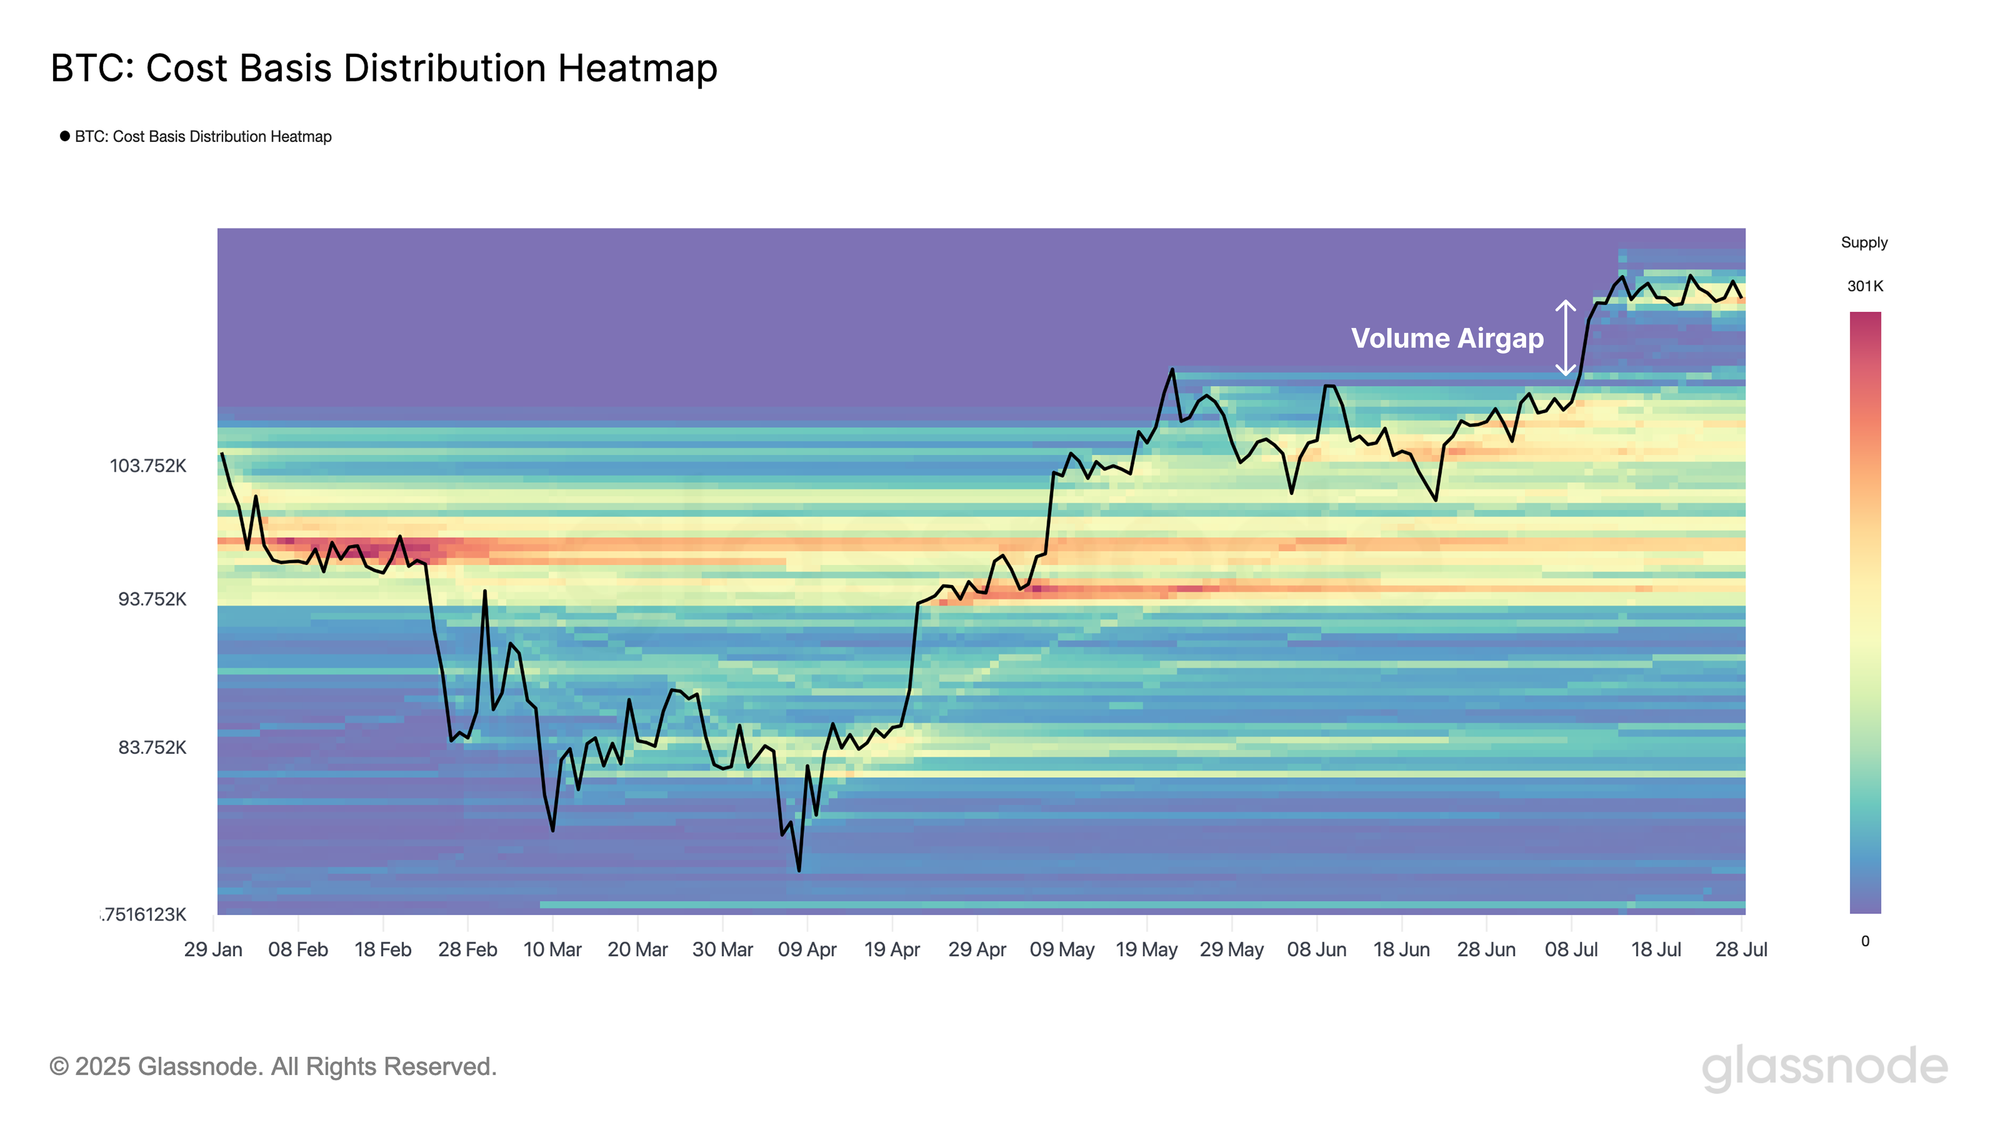
By examining Bitcoin’s Cost-Basis Distribution profile, we can see a significant concentration of investor cost basis levels around the $117k-$122k region. This highlights a large volume of investor accumulation has taken place at this elevated price point.
Noticeably, there remains an air-gap of volume just beneath the spot price, from $115k to $110k, a result of price rallying through the region without much opportunity for coins to transact along the way.
Not all air-gaps like this one must be back-filled, but a gravity does exist there, and the market may want to re-confirm if support will step in. This marks this area as a key zone to watch in the event of a price pull back.
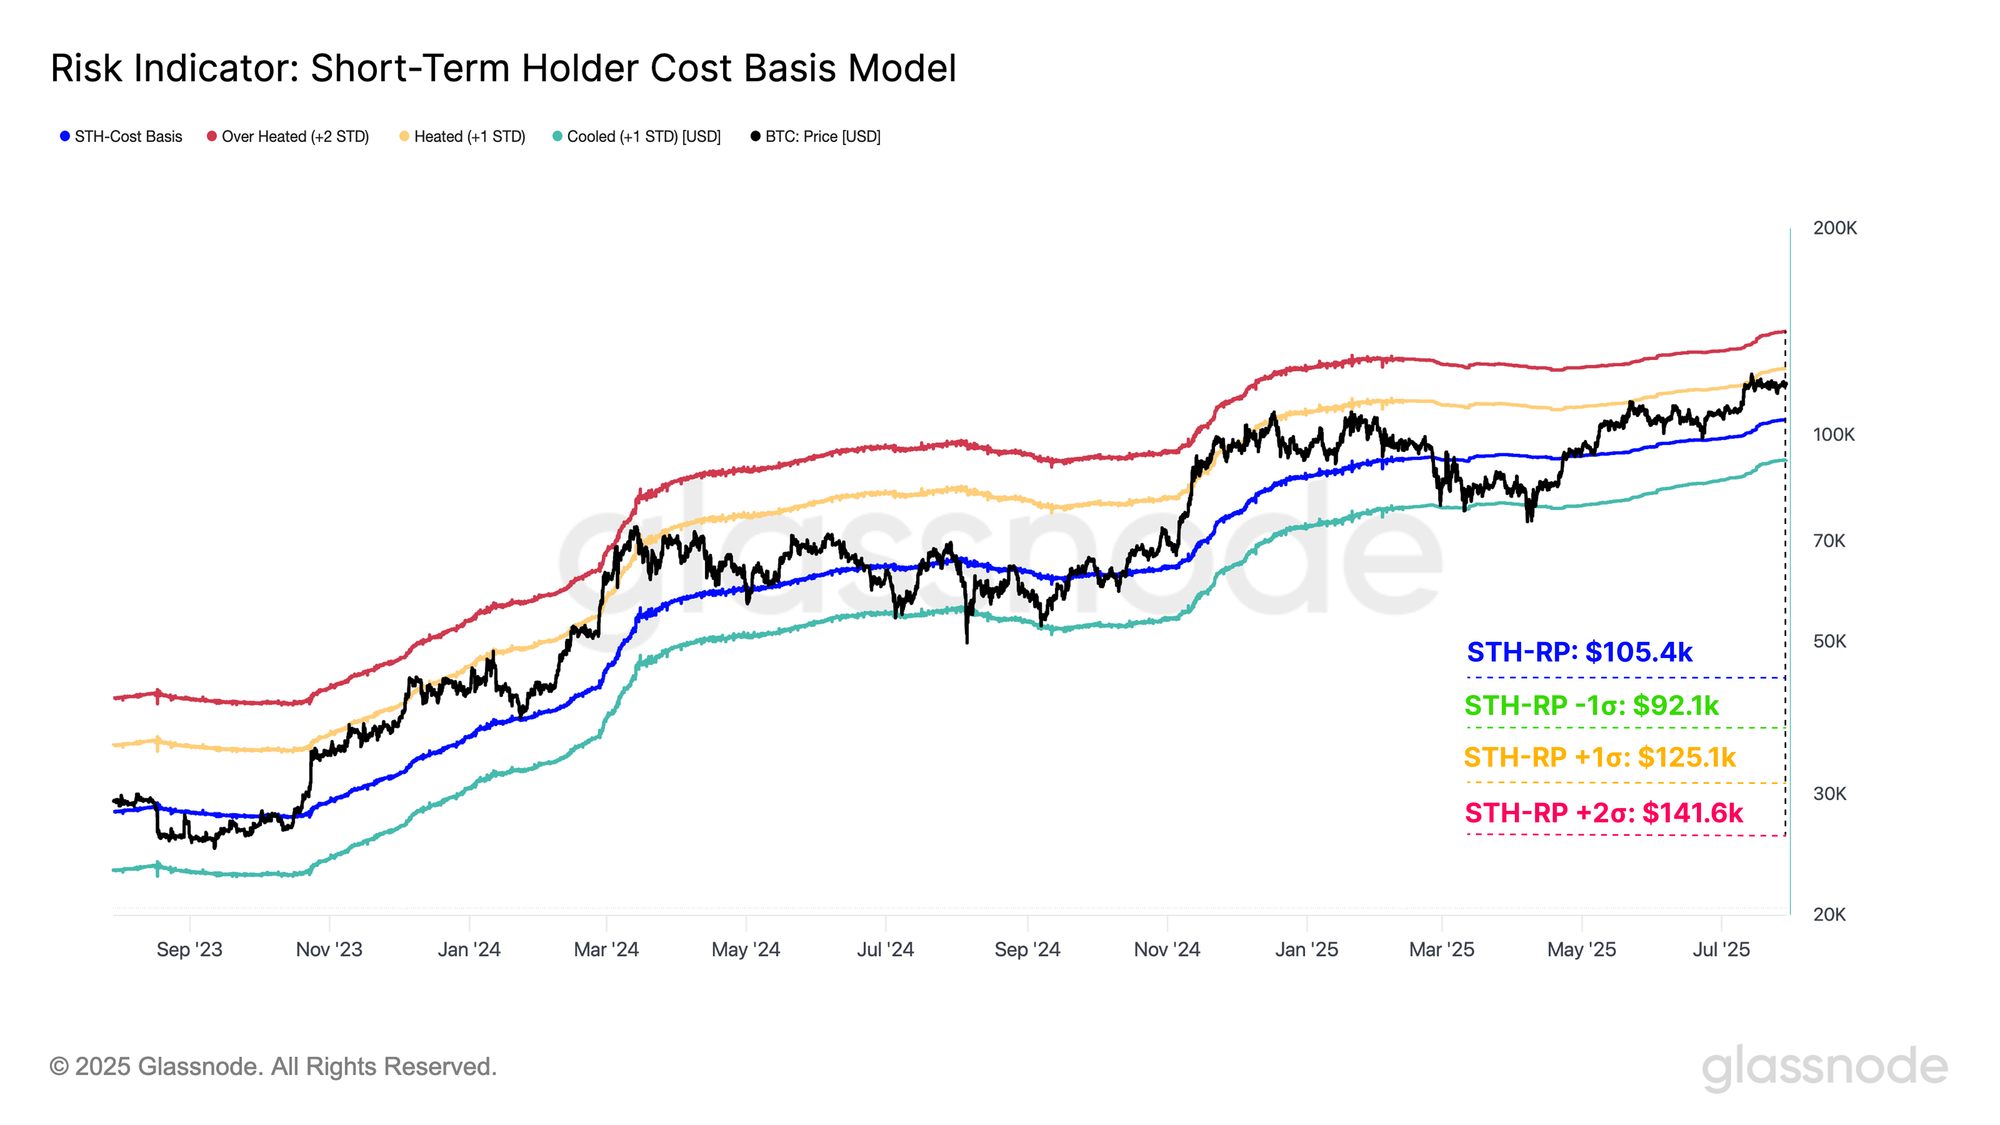
The Short-Term Holder (STH) cost basis, representing the average acquisition price for newer market participants, has historically served as a key threshold delineating between bullish and bearish local regimes. To add statistical context, we can apply standard deviation bands around the STH cost basis.
These dynamic price zones help identify areas of trend exhaustion or breakout potential.
- STH CB +2σ: $141.6k
- STH CB +1σ: $125.1k
- STH Cost Basis: $105.4k
- STH CB -1σ: $92.1k
A key observation is that Bitcoin continues to trade above the Short-Term Holder Cost Basis, which is a constructive signal for market strength. Additionally, price has consistently encountered resistance near the +1σ band across all major topping structures this cycle, with our current setup being no exception.
From a broader perspective, this suggests that Bitcoin may remain range-bound between $105K and $125K until a decisive breakout occurs. Should the market break convincingly higher, the $141K region is likely to present the next major zone of resistance where sell-side pressure may intensify rapidly, aligned with the +2σ band.
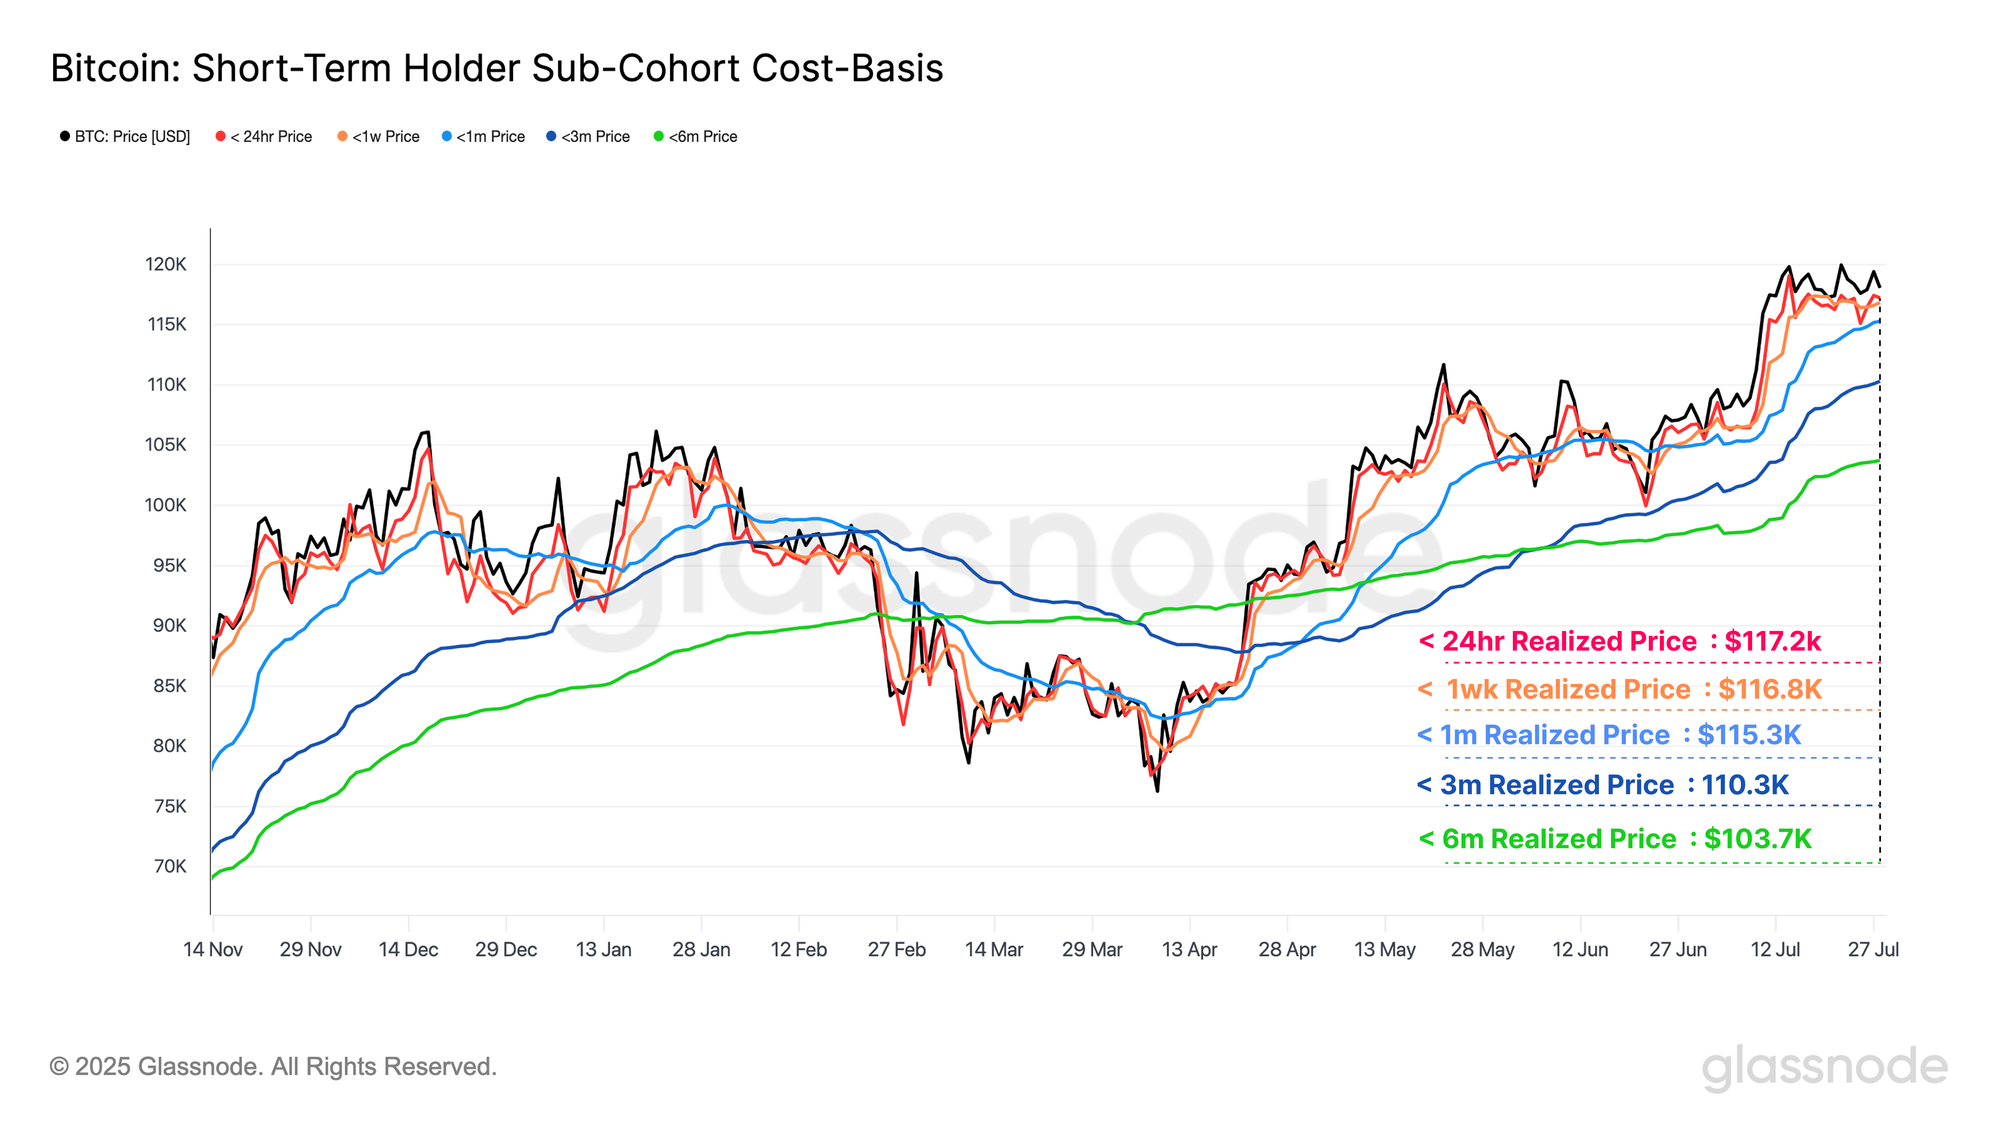
We can bolster our analysis of Short-Term Holder behavior by examining the cost basis of distinct sub-groups within the cohort. These sub-groups form a "fast-to-slow" ribbon of cost basis levels, effectively acting as a momentum-style indicator for short-term market sentiment.
As it stands, price remains elevated above the cost-basis of all short-term sub-cohorts, underscoring market strength despite the current stagnation and consolidation in price. Notably, the cost-basis range spanning from 24-hrs to 3-months falls between $110K and $117K, closely aligning with the light-volume zone identified in Bitcoin’s cost-basis distribution.
This confluence across several independent indicators reinforces the importance of this price region, suggesting it may act as a key support zone should the market experience a pullback.
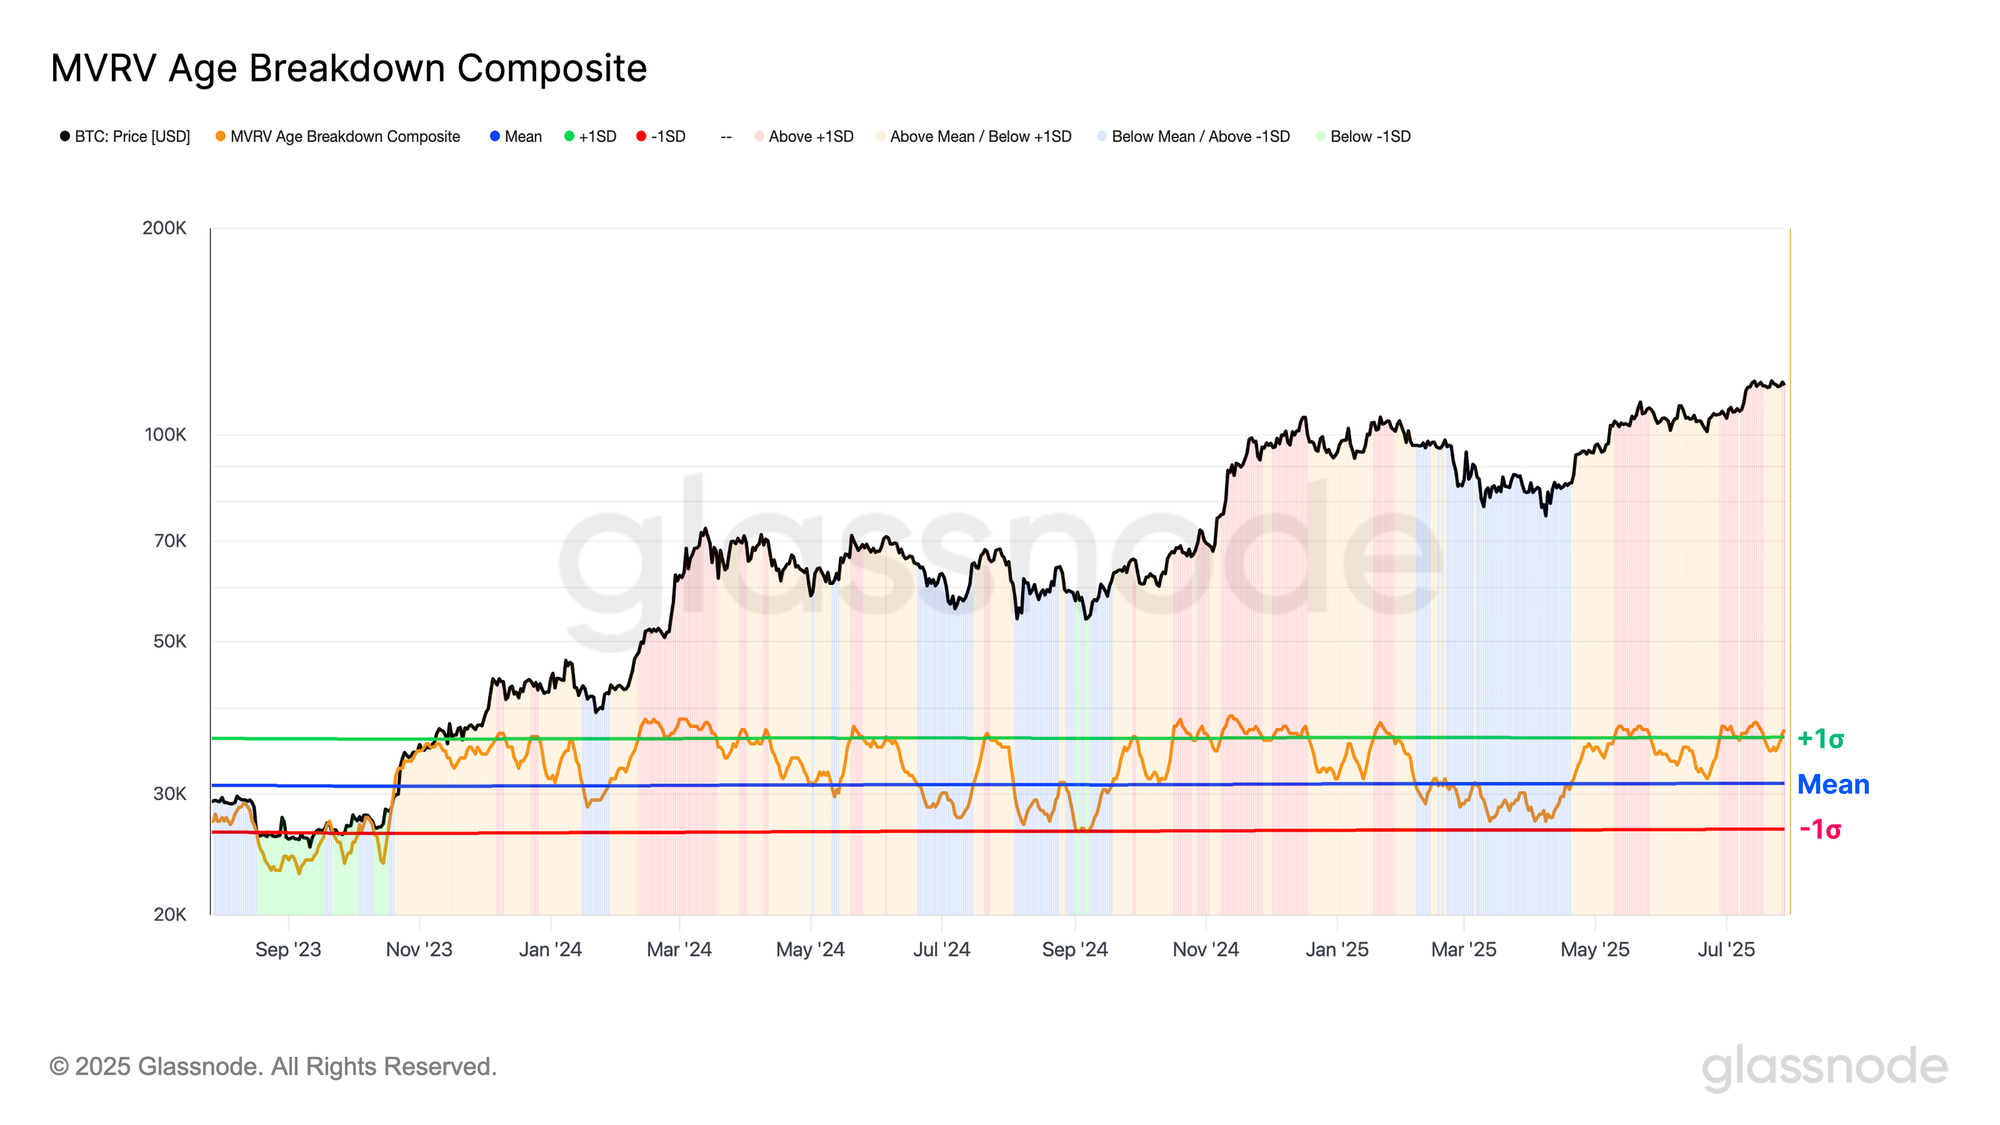
To further inspect momentum within these the sub-cohorts, we can utilize an equal-weighted composite to measure the number of age-based cohorts which, on average, are holding their coins in profit. This aids us in visually observing the momentum of the market, by tracking when a growing share new investors are seeing their holdings move from an unrealized profit, into a state of unrealized loss.
The composite index has now held above its mean for an extended period, and continues to trend upward toward the +1σ level. This indicates that, at present, market momentum remains relatively strong, and the majority of new investors are likely feeling positive about current conditions.
Summary and Conclusions
Bitcoin’s resilience was significantly tested over the weekend as the market efficiently absorbed a $9.6B sell-side event from the distribution of 80k BTC, one of the largest discrete profit-taking events in its history. Despite the scale of this transaction, price quickly stabilized just below all-time highs, underscoring the depth and maturity of current market liquidity.
At present, Bitcoin remains range-bound between $105K and $125K. A confirmed breakout beyond this zone could shift market dynamics, bringing the $141K region into focus, an area where key on-chain metrics suggest profit-taking could sharply intensify. Conversely, a light volume zone sits just below the current price between $110K-$115K, marking it as a critical area to monitor should a market pullback occur.
Disclaimer: This report does not provide any investment advice. All data is provided for informational, and educational purposes only. No investment decision shall be based on the information provided here and you are solely responsible for your own investment decisions.
Exchange balances presented are derived from Glassnode’s comprehensive database of address labels, which are amassed through both officially published exchange information and proprietary clustering algorithms. While we strive to ensure the utmost accuracy in representing exchange balances, it is important to note that these figures might not always encapsulate the entirety of an exchange’s reserves, particularly when exchanges refrain from disclosing their official addresses. We urge users to exercise caution and discretion when utilizing these metrics. Glassnode shall not be held responsible for any discrepancies or potential inaccuracies.
Please read our Transparency Notice when using exchange data.
- Join our Telegram channel.
- For on-chain metrics, dashboards, and alerts, visit Glassnode Studio.

![ether.fi [ETHFI] нацеливается на $0,40 после роста на 11% – Что нужно для дальнейшего роста?](https://d1x7dwosqaosdj.cloudfront.net/images/2026-07/5822c43d22b846688307a43e35654969.jpg)