Strategy Watch #2

insights.glassnodePublicado em 2026-03-24Última atualização em 2026-03-24

Resumo

Strategy Watch #2 provides institutional analysis of digital asset fund performance and allocation trends. The report covers six key areas: institutional capital flows, fund performance, macro strategies, on-chain vault returns, manager sentiment, and allocation updates. In February and early March, Bitcoin and Ethereum saw significant net outflows (-$9.6B and -$3.2B respectively), while stablecoins attracted inflows (+$6.2B), suggesting a defensive shift toward lower-risk assets. BTC ETF flows turned positive in March, though institutional conviction remains cautious. DeFi Total Value Locked (TVL) on Ethereum declined sharply, with peak outflows of -$23.7B in February, indicating reduced participation in on-chain yield strategies. CME basis yields continued to tighten, reflecting lower institutional leverage and softer derivatives demand. The report also highlights performance trends, with only one strategy type generating positive returns in February. Over 300 managers shared their three-month market outlook, and a new $750M fund of funds was announced.

The full report is freely available in PDF format.

Download PDF version

Welcome to Strategy Watch #2

Strategy Watch was built to address a clear demand for high-signal, impartial analysis of fund-level performance and allocation trends in digital assets.

The inaugural edition confirmed this demand, reaching a broad audience of key decision makers, from leading global asset managers, hedge funds, major investment banks, top-tier crypto-native funds and Fund of Funds.

Building on this early momentum, our objective is straightforward — to make Strategy Watch a must-read monthly publication for the digital asset investment community.

This publication is strengthened by direct input from market participants. Funds and allocators that contribute data and insights help shape a more complete and valuable view of the landscape.

If you have insights, data, or allocation updates worth sharing, we welcome your contribution.

Present your latest initiatives and updates to a curated audience of institutional allocators.

Share updates ↗

Inside the Latest Strategy Watch

The report is structured across six core sections, each focused on a distinct dimension of institutional activity in digital assets:

01 Institutional Flow Monitor |

02 Fund and SMA Performance | February was a bloodbath, check this section to see the only strategy type that returned positively last month.

03 Strategy Deep Dive: Macro Strategies | Hear firsthand from a macro portfolio manager on how they are navigating the current geopolitical challenges. 

04 On-chain Vault Performance | Are ETH curators underperforming ETH staking yield?

05 Manager Monitor | Find out how more than 300 managers are expecting the crypto market to perform over the next three months.

06 Allocation Updates | New USD 750m Fund of Funds is launching. Check this section to learn more.

in partnership with

The Premier Digital Assets Allocator Platform. Learn more


Institutional Flow Monitor

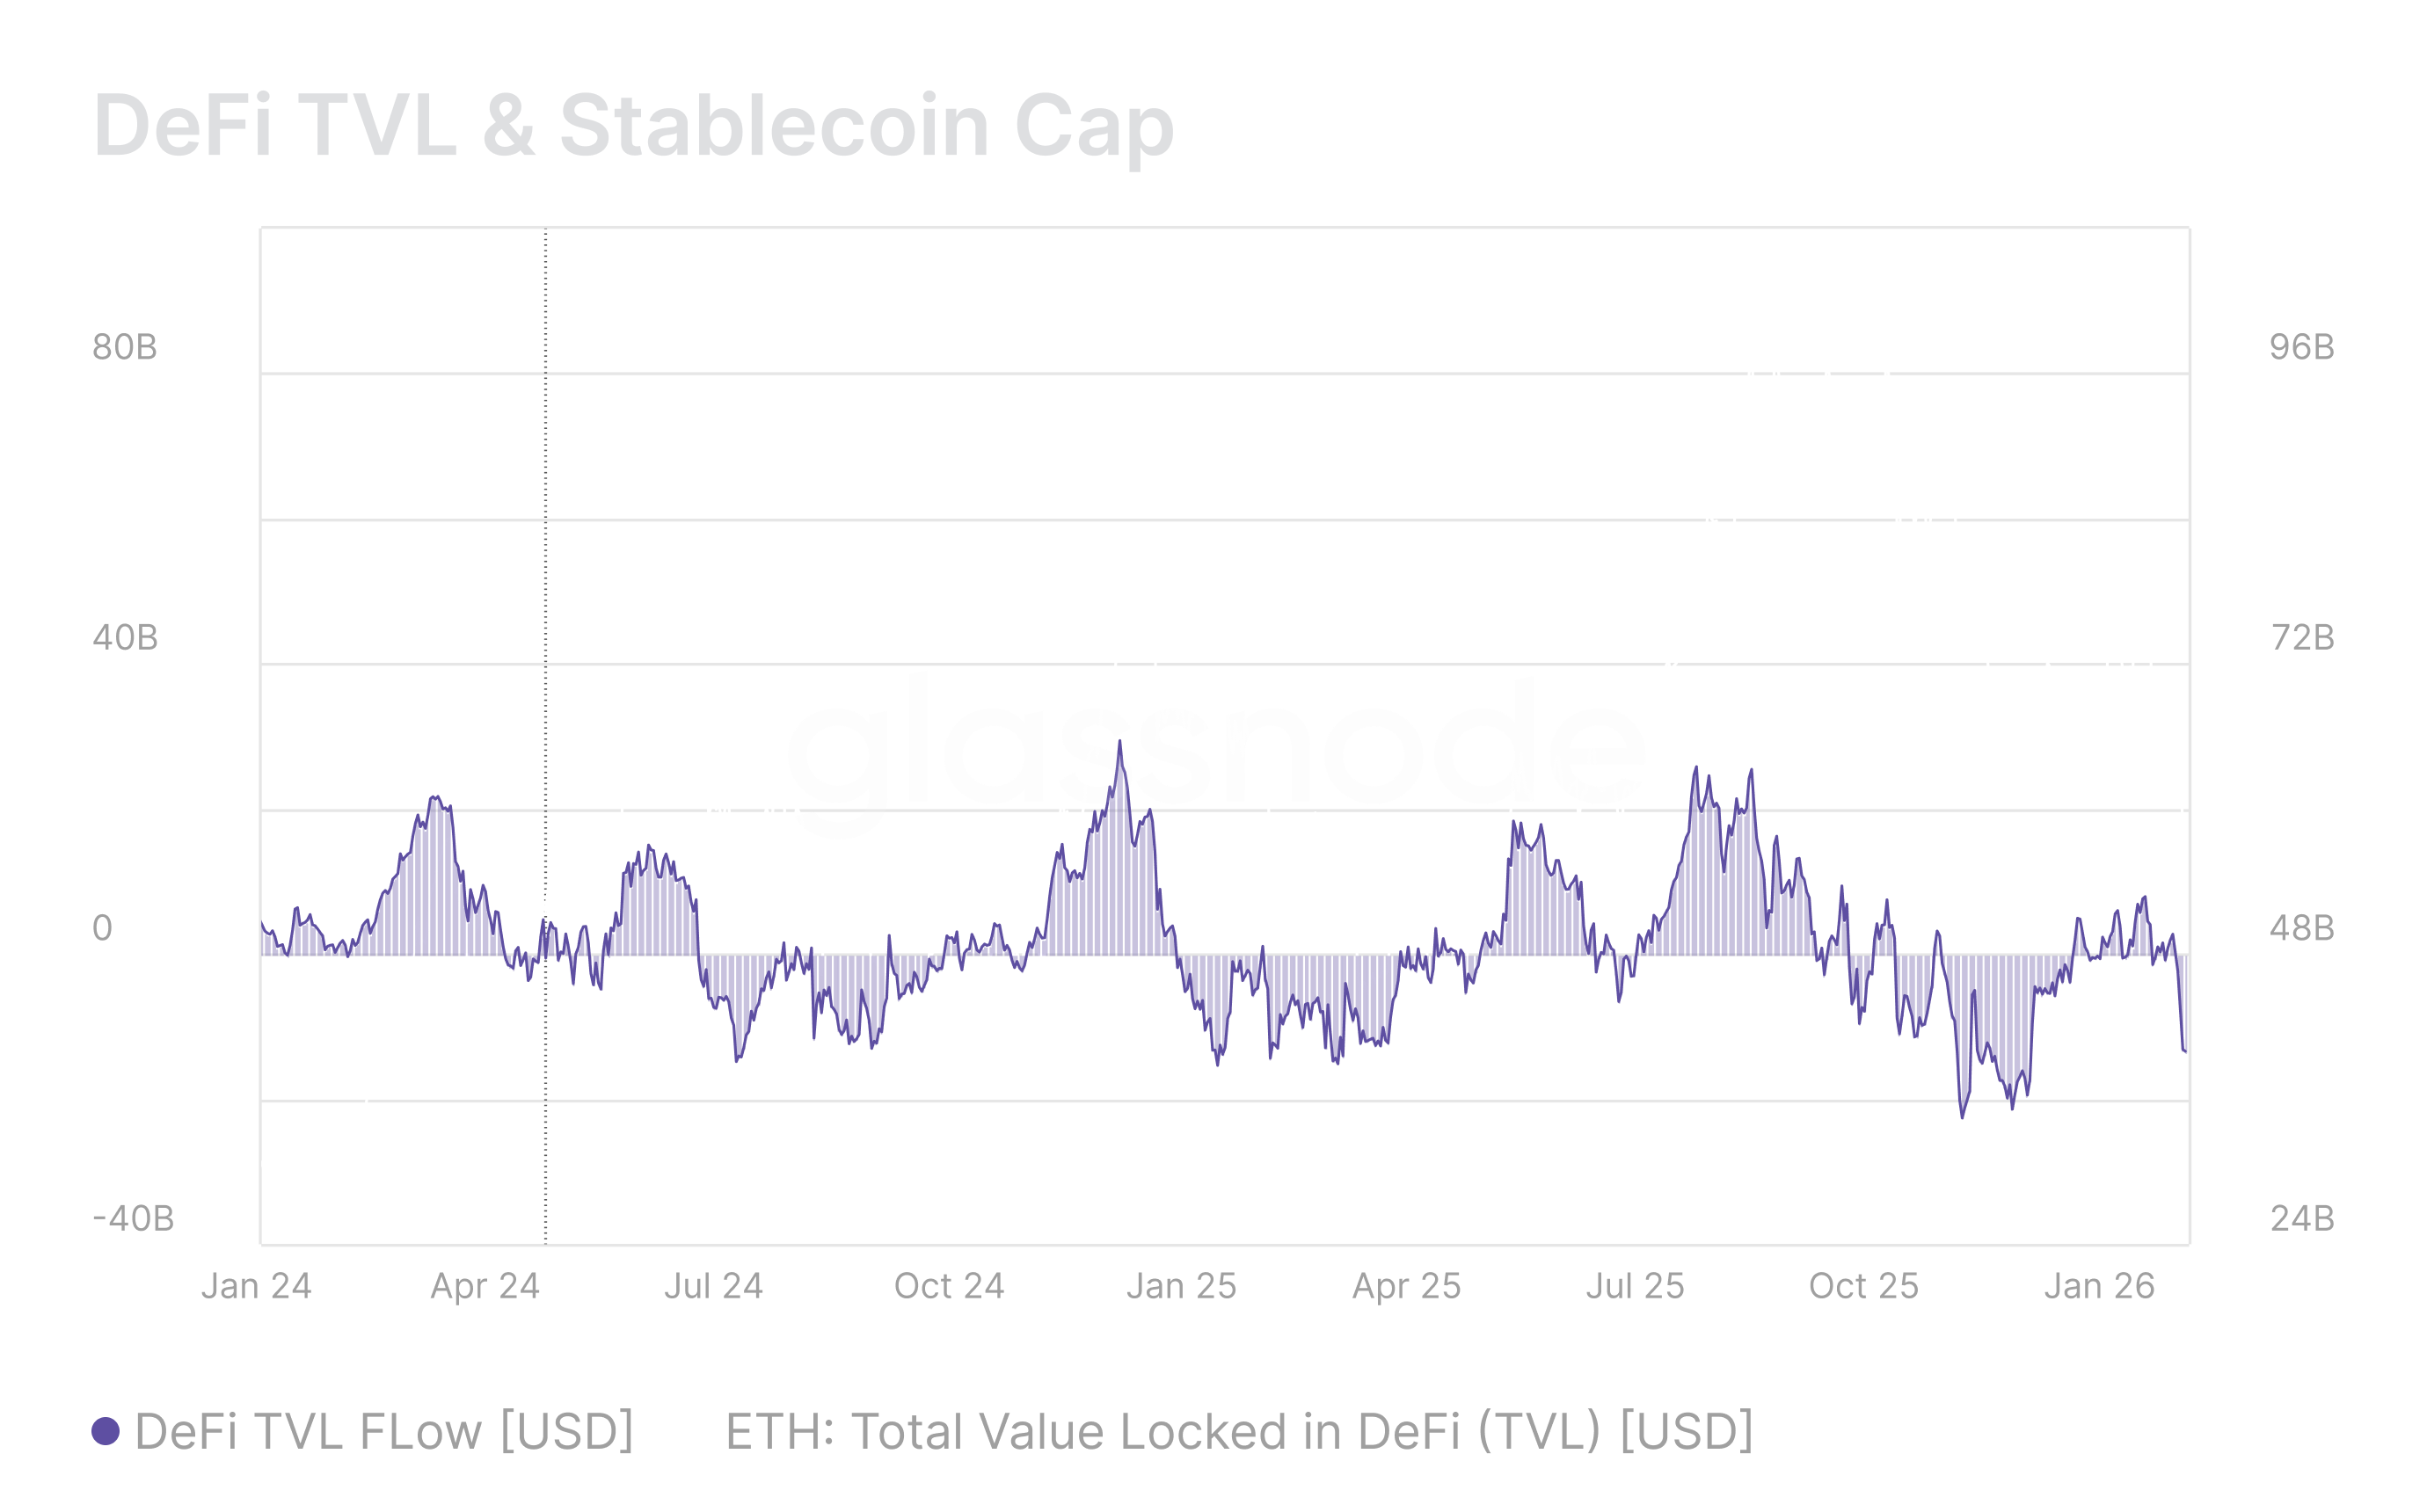
Capital flows into BTC and ETH remained deeply negative through February and into March, with stablecoins turning net positive in early March as investors rotated toward lower-risk positioning.

Bitcoin and Ethereum continued to experience sustained net outflows, with BTC and ETH capital flows registering -$9.6B and -$3.2B. However, stablecoins broke from the broader negative trend, flipping to +$6.2B in net inflows. Rather than signaling a broad return of risk appetite, this rotation likely reflects a defensive repositioning, with capital migrating into dollar-denominated on-chain instruments while conviction in spot crypto assets remains under pressure heading into mid-Q1 2026.
ETF & DAT Net Flows

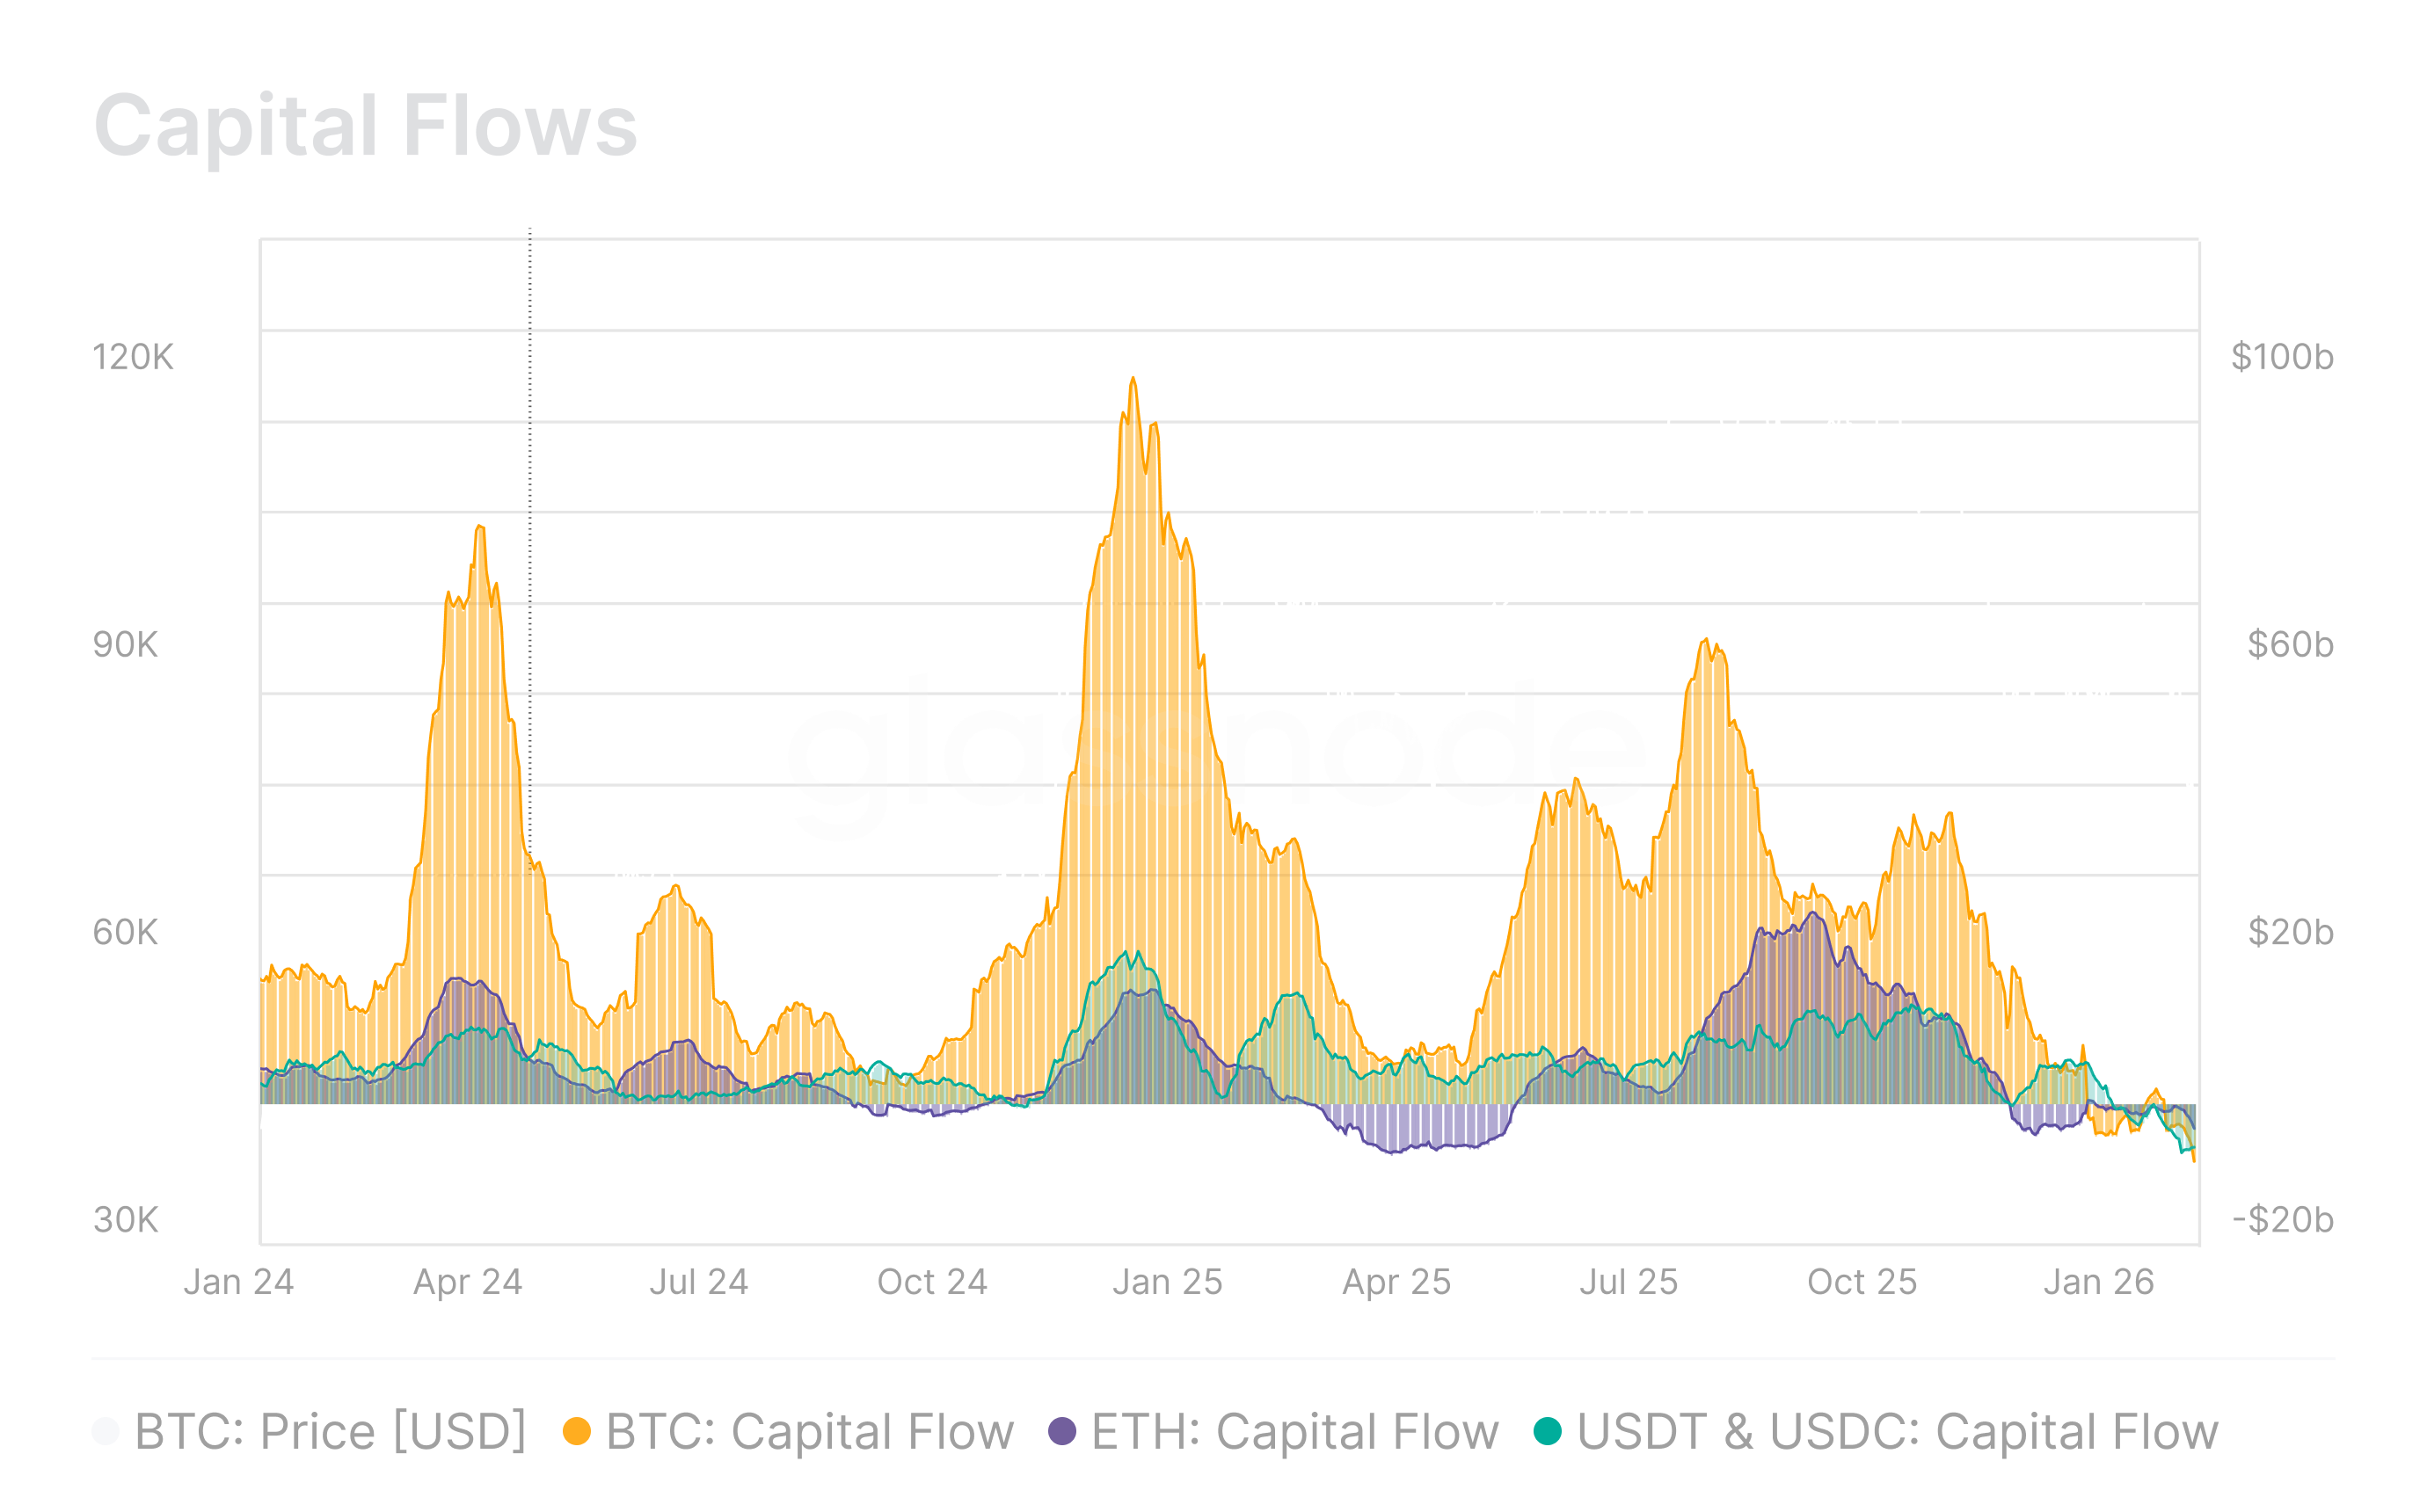
After sustained February outflows, BTC ETF and DAT flows returned to positive, while ETH institutional flows showed early signs of stabilization.

After sustained February outflows, Bitcoin ETF and DAT flows returned to positive territory, recovering to +28k BTC and +46.8k BTC respectively. Ethereum flows were more measured, with ETF flows near neutral at +46.5k ETH and DAT flows stabilizing at +295.8k ETH. While the directional shift is encouraging, the recovery remains early-stage and uneven, and it would be premature to characterize this as a broad resumption of institutional conviction.
DeFi TVL & Stablecoin Cap

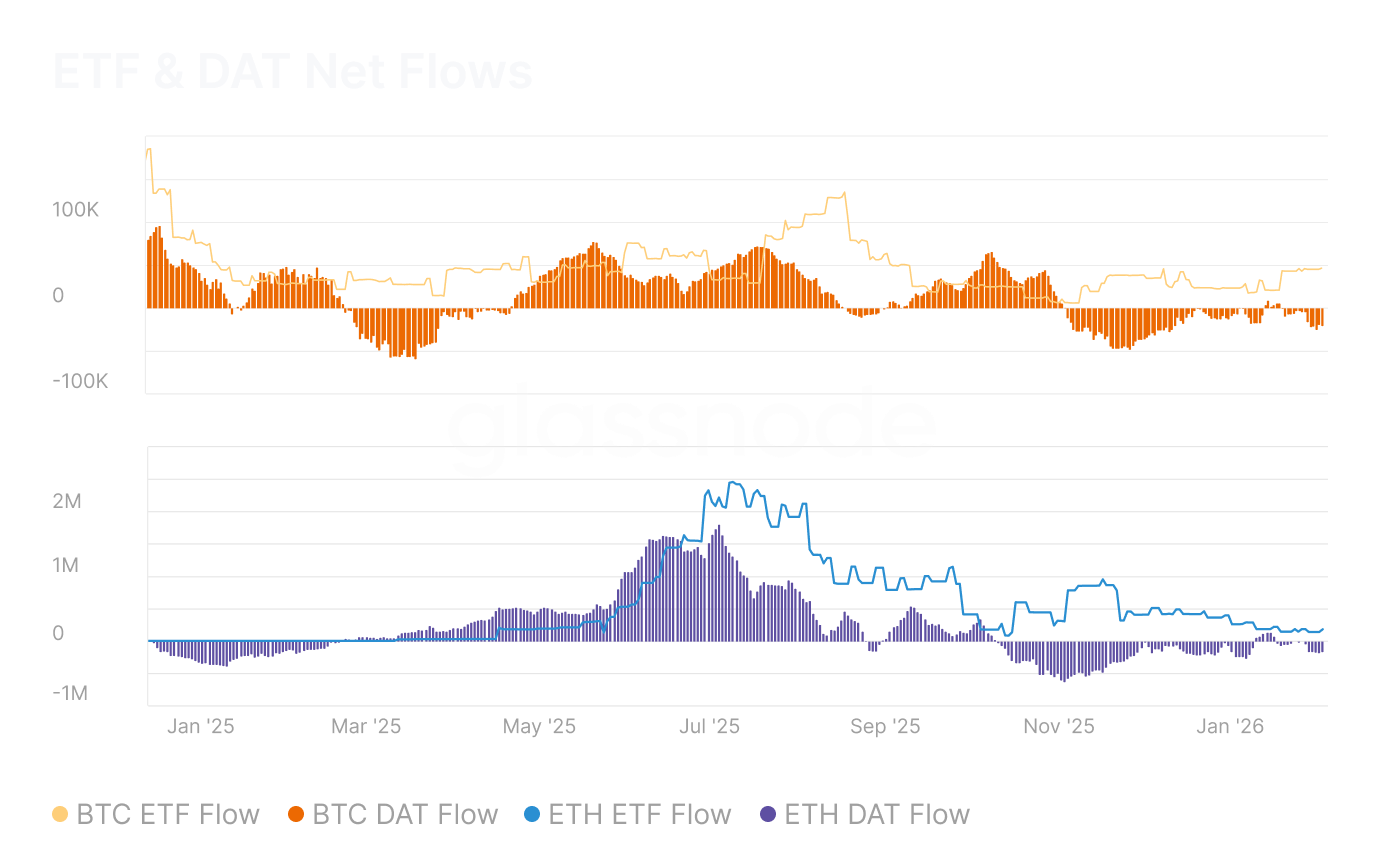
DeFi TVL on Ethereum saw sharp contraction through February before showing early signs of stabilization in March, though the broader declining trend since August 2025 remains intact.

Total Value Locked on Ethereum recorded peak outflows of -$23.7B per month in February, implying sustained withdrawal by larger allocators from on-chain activities such as liquidity provisioning and yield strategies. This slowdown alone is insufficient to signal a reversal, and diminished conviction in DeFi risk-adjusted returns continues to point to shallower liquidity depth across the ecosystem.
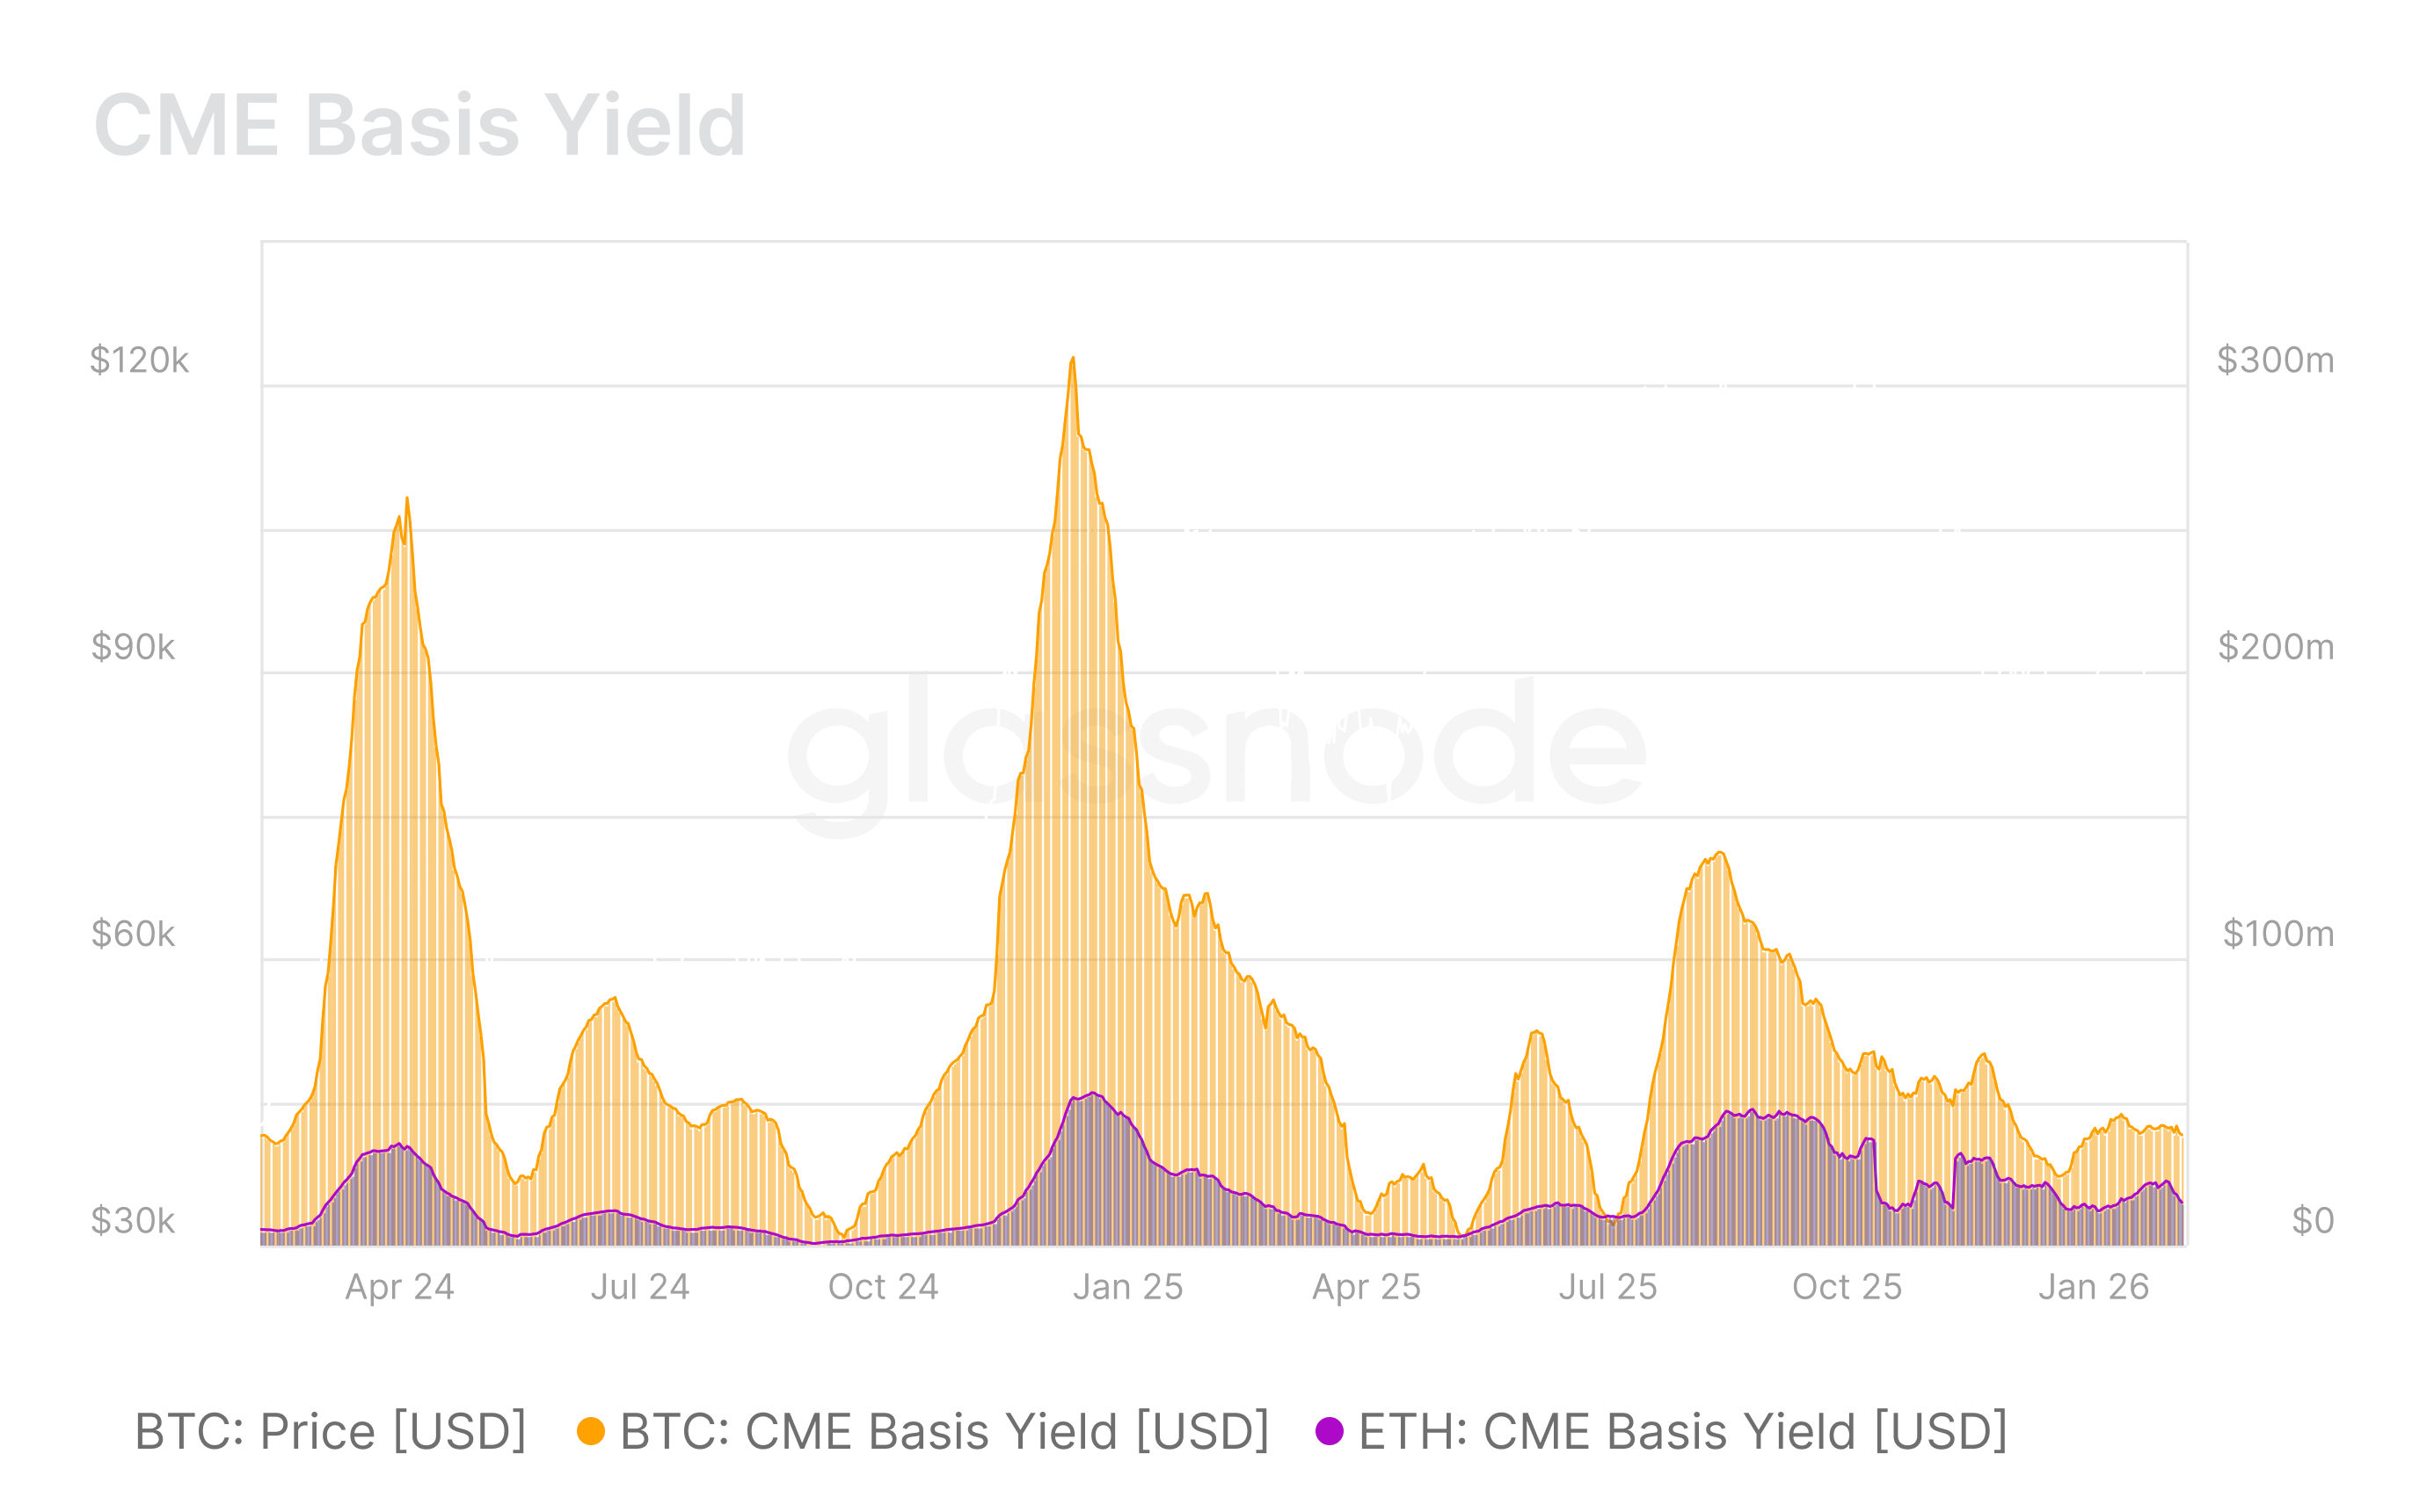
CME Basis Yield

CME Basis Yield compressed even further in February, reinforcing waning incentives for market-neutral strategies compared to January.

The monthly dollar value captured by institutions via cash-and-carry trades declined notably for both Bitcoin and Ethereum, building on the sharp compression seen since August 2025. This tightening basis reflects reduced leverage deployment, softer futures demand, and continued pullback in balance-sheet commitment amid tighter liquidity conditions persisting from January into early March 2026.


Disclaimer: This report does not provide any investment advice. All data is provided for information and educational purposes only. No investment decision shall be based on the information provided here and you are solely responsible for your own investment decisions.
Exchange balances presented are derived from Glassnode’s comprehensive database of address labels, which are amassed through both officially published exchange information and proprietary clustering algorithms. While we strive to ensure the utmost accuracy in representing exchange balances, it is important to note that these figures might not always encapsulate the entirety of an exchange’s reserves, particularly when exchanges refrain from disclosing their official addresses. We urge users to exercise caution and discretion when utilizing these metrics. Glassnode shall not be held responsible for any discrepancies or potential inaccuracies. Please read our Transparency Notice when using exchange data.

Perguntas relacionadas

QWhat is the primary purpose of the Strategy Watch publication?

AStrategy Watch was built to address a clear demand for high-signal, impartial analysis of fund-level performance and allocation trends in digital assets, aiming to be a must-read monthly publication for the digital asset investment community.

QWhich was the only strategy type that returned positively in February according to the report?

AThe report indicates that readers should check the 'Fund and SMA Performance' section to see the only strategy type that returned positively in February, though the specific strategy name is not stated in the provided text.

QWhat was the trend in capital flows for Bitcoin (BTC) and Ethereum (ETH) through February and into March?

ACapital flows into BTC and ETH remained deeply negative, with BTC and ETH capital flows registering -$9.6B and -$3.2B, respectively.

QHow did stablecoin capital flows behave in contrast to BTC and ETH in early March?

AStablecoins broke from the broader negative trend, flipping to +$6.2B in net inflows, which likely reflects a defensive repositioning into lower-risk, dollar-denominated on-chain instruments.

QWhat does the sharp compression in CME Basis Yield indicate about market conditions?

AThe compression in CME Basis Yield reflects reduced leverage deployment, softer futures demand, and a continued pullback in balance-sheet commitment amid tighter liquidity conditions, indicating waning incentives for market-neutral strategies.

Leituras Relacionadas

UNI Doubles in Two Months Against the Trend: A 5-Year-Overdue Value Realization

Amidst a generally stagnant crypto market in June and July, UNI, the governance token of Uniswap, saw a significant surge, nearly doubling in price from around $2.3 to $4.6. This rally represents a delayed but significant value reassessment, triggered by the practical implementation of its long-debated "fee switch" mechanism. The key turning point was the on-chain execution of the UNIfication proposal in December 2025. It activated a protocol fee on select pools, directed Unichain sequencer revenue (net of costs) to a communal treasury, executed a one-time burn of 100 million UNI, and established a system where all protocol revenue flows into a "TokenJar" contract. This treasury has a single exit: purchasing and permanently burning UNI via a "Firepit" contract. Initially, the market reacted tepidly as the generated revenue and corresponding burn rate were modest. The narrative shifted dramatically in July 2025 with two major developments. First, the launch of Robinhood Chain, tailored for tokenized stocks, rapidly became a primary source of volume and fees for Uniswap, at one point contributing nearly half of its weekly fees. Second, governance votes successfully expanded the fee mechanism to v4 pools and initiated a temperature check for fees on Robinhood Chain. The activation of v4 fees caused the protocol's daily revenue earmarked for UNI burns to nearly triple. The core of UNI's recent price action is the transition from a pure governance token to a cash-flow asset with a permanent, protocol-funded buyer. Its effectiveness is amplified by UNI's mature and widely distributed supply, with no major impending unlocks to dilute the impact of the buybacks. The sustainability of this rally now hinges on whether the transaction volume, particularly on Robinhood Chain, persists after its initial gas subsidies expire, determining if this is a genuine value realization or a subsidy-fueled spike.

marsbitHá 1h

UNI Doubles in Two Months Against the Trend: A 5-Year-Overdue Value Realization

marsbitHá 1h

Breaking: Google Earth Urgently Pulls Back Nano Banana 2 Image Generation Feature!

Google Earth's newly launched "Create image" feature, powered by the Nano Banana 2 AI image generation model, was abruptly withdrawn shortly after its release due to being "played" by users. The feature allowed users to generate and overlay AI-created visuals directly onto real-world satellite and 3D maps in Google Earth. The tool enabled creative applications like historical recreations (e.g., visualizing ancient Pompeii), generating informational graphics for landmarks, and envisioning architectural projects or futuristic cityscapes on real terrain. It operated under "geospatial grounding," meaning the AI respected the underlying geography, topography, and perspective of the chosen map view. The model also integrated with Gemini to retrieve relevant factual information. However, upon release, users quickly tested its limits. A prominent example involved reimagining Philadelphia's historic Independence Hall as a post-apocalyptic ruin overrun by "happy" zombies, evil clowns, and giant alien mechs. This highlighted both the feature's playful potential and its risks regarding the generation of inappropriate or misleading content on realistic maps, leading to its swift temporary removal. Google stated it would re-release the feature after implementing "enhanced guardrails." Analysts note this move strategically leverages Google's vast proprietary geospatial data, positioning its AI not just for artistic generation but for spatially accurate world visualization—a unique advantage in the competitive AI image generation landscape.

marsbitHá 2h

Breaking: Google Earth Urgently Pulls Back Nano Banana 2 Image Generation Feature!

marsbitHá 2h

Altman Admits: Overestimated AI Snatching Jobs! Huang Renxun: The Unemployment Narrative Is Completely Backwards

Sam Altman has revised his earlier predictions about AI rapidly replacing jobs, admitting he overestimated the speed at which AI would eliminate entry-level white-collar roles. Speaking on the "Invest Like the Best" podcast, he stated that people do not truly want an AI CEO, as accountability and human connection remain critical. He found that individuals prefer interacting with people who can be held responsible for decisions. Similarly, NVIDIA's Jensen Huang argued that the narrative of AI destroying jobs is misguided. He distinguishes between tasks and jobs, noting that while AI can automate specific tasks, entire jobs—encompassing communication, judgment, coordination, and accountability—are not eliminated. He cited examples like radiologists and software engineers, where demand for these roles has increased as AI handles repetitive tasks, allowing for business expansion and the creation of more positions. Data from a University of Maryland and LinkUp study supports this, showing that U.S. job postings for new graduates have actually risen, countering the fear of vanishing entry-level roles. However, a significant shift is occurring: the traditional entry-level tasks that help newcomers gain experience are being automated, making initial career access more challenging. The key insight is that as AI takes over standardized tasks, the enduring value of human work shifts toward areas of responsibility, trust-building, and final decision-making—aspects that AI cannot replicate. The real "moat" for professionals lies in these irreplaceable human elements.

marsbitHá 2h

Altman Admits: Overestimated AI Snatching Jobs! Huang Renxun: The Unemployment Narrative Is Completely Backwards

marsbitHá 2h

Trading

Spot
活动图片