Quant enters crucial supply zone: Will QNT’s 24% weekly rally falter?

ambcryptoPublicado em 2026-03-21Última atualização em 2026-03-21

Resumo

Quant (QNT) has surged 24.14% in the past week, significantly outperforming Bitcoin, which declined 2.64%. The altcoin is approaching a critical supply zone between $80 and $88, a key resistance area. While QNT has shown strength by rebounding from the long-term demand zone of $55–$60, its weekly chart still reflects a bearish structure, with the RSI below 50 and OBV not trending higher. Key resistance levels to watch are $88, $105, and $135. A daily close above $88 could signal a bullish continuation, while rejection at $80 and a drop below $75 may indicate a bearish reversal. Traders are advised to consider taking profits in the $80–$88 zone or wait for a clear breakout above $88 or breakdown below $75 for directional bias.

At press time, Quant [QNT] rallied 4.91% in 24 hours and was up by 24.14% over the past week. These were impressive numbers for the mid-cap altcoin, especially in comparison to Bitcoin [BTC]. The leading crypto has shed 2.64% over the past week and was oscillating about the $70k level.

In the coming days and weeks, BTC could make another push higher toward $80k. This could provide fuel for altcoins to climb higher, but only a few altcoins have already shown strength.

Quant could be one of them. It has a higher timeframe bearish trend but has reacted positively at the long-term demand zone at $55-$60. In March, QNT rebounded swiftly from $60.92 to $80.72, a 32.5% move in two weeks.

Quant is likely to rally to the Value Area High

Source: QNT/USDT on TradingView

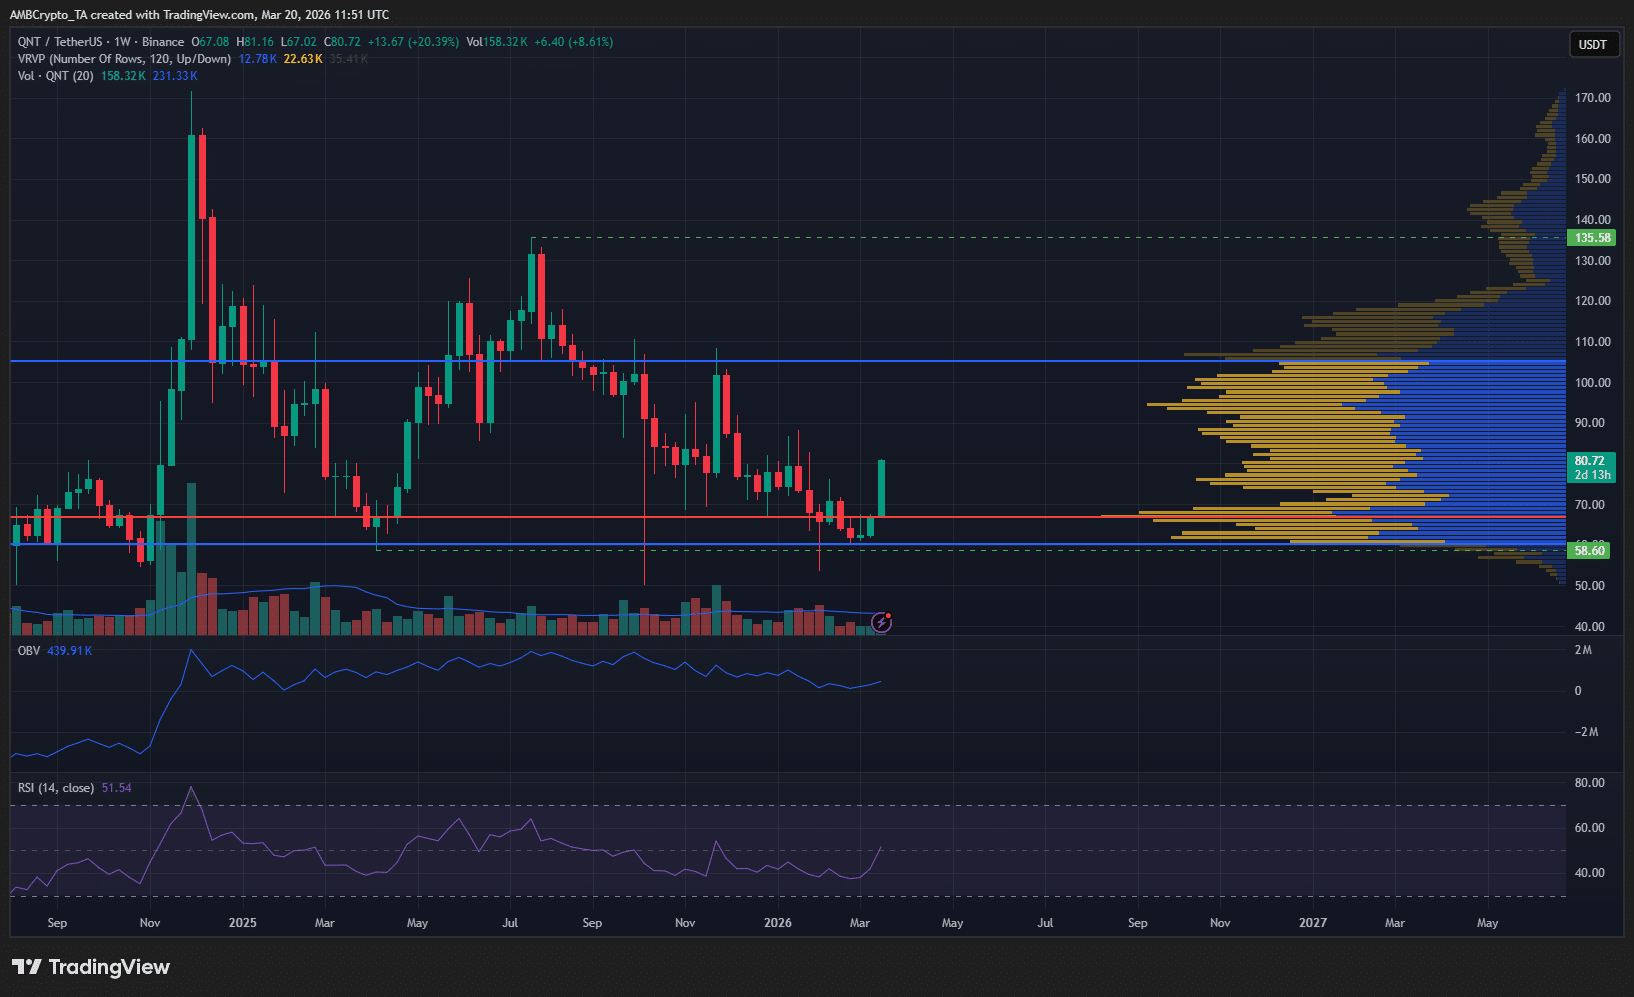
The weekly chart showed a long-term bullish swing structure but a bearish internal structure. Even after the strong gains in March, the local swing high at $88.3 remained unbroken.

The Visible Range’s Value Area was between $60 and $105, with the Point of Control at $67. That means the high-volume node shifted into bullish control, which was encouraging for bulls. However, they still had a long way to go before they could maintain their momentum.

Since April 2025, QNT has been stuck within the $58.60-$135.58 levels. The $88, $105, and $135 levels were the next key resistances to the north for QNT to overcome.

The OBV has not trended higher lately, and the RSI has remained below the neutral 50 level. The structure and technical indicators remained bearishly poised on the weekly timeframe.

QNT is at a make-or-break region

Source: QNT/USDT on TradingView

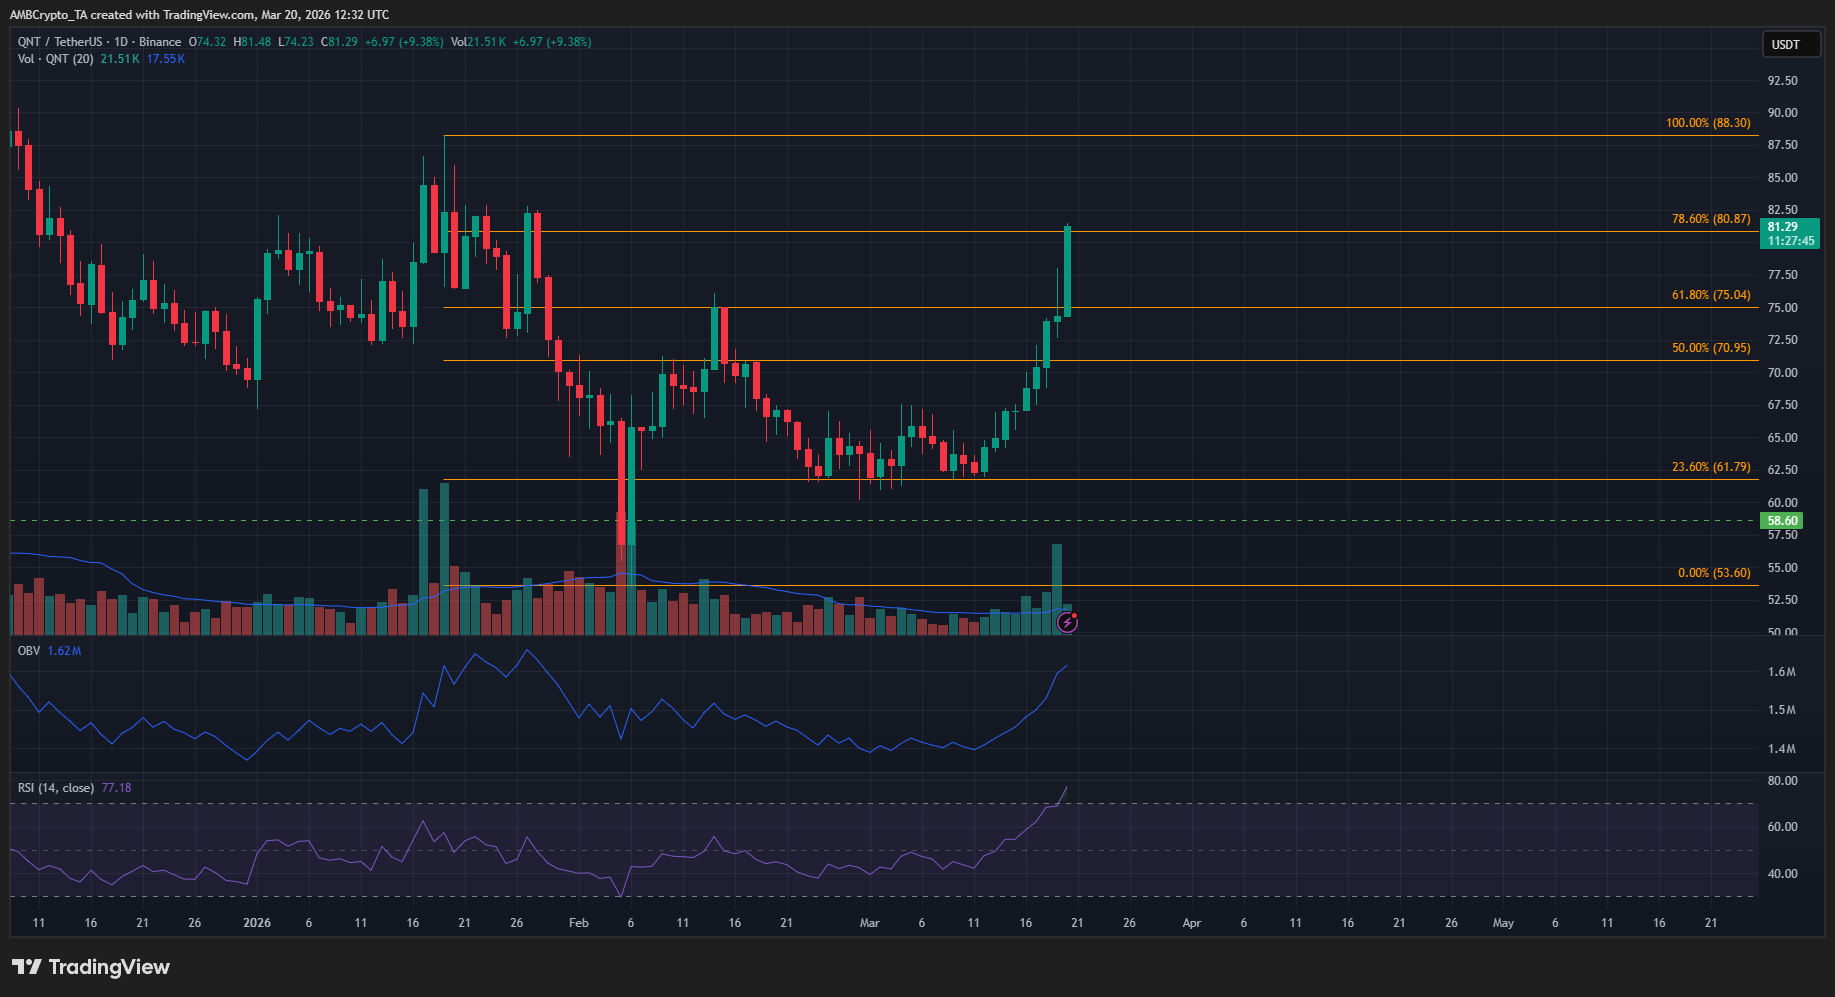
On the 1-day chart, the swing structure was bearish. This drop in January and February was used to plot a set of Fibonacci retracement levels (orange). The $75.04 and $80.87 levels were the levels that demarcated the golden pocket within the retracement.

If the bears were going to take control, they were most likely to do it within this price range. Yet, it has not happened so far.

So swing traders looking to go long should wait, while those looking to sell QNT can do so and book profits. It is unclear where the next leg will go.

A daily session closing above $88 would be a strong sign of a bullish continuation. Meanwhile, rejection from $80 and a subsequent fall below $75 would be indicative of a bearish trend’s renewal.


Final Summary

  • QNT traders already in long positions can look to take profits as the price enters the $80-$88 resistance zone.
  • Swing traders can wait for $75 or $88 to be breached to decide their next directional bias.

Perguntas relacionadas

QWhat is the current weekly and 24-hour price performance of Quant (QNT) as mentioned in the article?

AAt press time, Quant (QNT) had rallied 4.91% in 24 hours and was up by 24.14% over the past week.

QWhat are the key resistance levels that QNT needs to overcome to the north, according to the weekly chart analysis?

AThe key resistance levels to the north for QNT are $88, $105, and $135.

QWhat is the significance of the Fibonacci retracement's 'golden pocket' levels on the 1-day chart for QNT?

AThe 'golden pocket' levels, $75.04 and $80.87, are the price range where bears are most likely to take control, making it a critical zone for a potential trend reversal.

QWhat would a daily closing price above $88 indicate for QNT's price action?

AA daily session closing above $88 would be a strong sign of a bullish continuation for QNT.

QWhat trading advice is given to swing traders who are currently in long positions on QNT?

ASwing traders already in long positions are advised to look to take profits as the price enters the $80-$88 resistance zone.

Leituras Relacionadas

380,000 Apps Exposed, 2,000+ Apps Leaked Secrets: AI Programming Turns 'Intranet' into Public Internet

Israeli cybersecurity firm RedAccess uncovered a severe data exposure trend linked to "vibe coding" or AI-powered software development tools. Their research found approximately 38,000 publicly accessible web applications built with platforms like Lovable, Base44, Netlify, and Replit. Of these, an estimated 2,000 apps exposed sensitive corporate and personal data, including medical records, financial information, internal strategic documents, and customer chat logs. In some cases, access even granted administrative privileges. The core issue stems from default privacy settings that make applications public by default, combined with a lack of built-in security controls (like authentication) in the AI-generated code. This allows employees without security expertise—"citizen developers"—to easily create and deploy applications that bypass standard corporate security reviews. The exposed apps, often indexed by search engines, are trivially discoverable. While some platform providers (Replit, Lovable, Wix/Base44) argue that security configuration is the user's responsibility and question the validity of some findings, security researchers confirm the widespread reality of such exposures. This pattern, also noted in prior studies, highlights a critical security gap as AI democratizes app creation, potentially leading to massive, unintentional data leaks.

marsbitHá 45m

380,000 Apps Exposed, 2,000+ Apps Leaked Secrets: AI Programming Turns 'Intranet' into Public Internet

marsbitHá 45m

Attracting Global Capital, Asia's New 'Super Cycle' Is Unfolding

Investors are turning to Asia as the next frontier for global equity growth, with a new "super cycle" unfolding across the region. Driven by the AI revolution, Asian markets, particularly South Korea, have seen significant rallies. According to Morgan Stanley analysis, the underlying drivers of Asia's industrial cycle are shifting from traditional sectors like real estate and manufacturing to massive investments in AI infrastructure, energy security and transition, and supply chain resilience. Fixed asset investment in Asia is projected to grow from around $11 trillion in 2025 to $16 trillion by 2030, with a 7% annual growth rate from 2026-2030. The AI wave is a primary catalyst, driving immense capital expenditure for chips, servers, data centers, and power systems. Asia is central to this hardware supply chain. In China, AI investment is focused on building a full-system domestic capability, with the local AI chip market potentially reaching $86 billion by 2030. Beyond AI, China's export story is expanding from EVs and batteries to robotics. The country already captures about half of new global industrial robot demand and over 90% of humanoid robot shipments. This growth phase mirrors the early stages of China's EV export boom. Simultaneously, energy security investments, spurred by AI's massive power needs, are rising, with China benefiting from its leadership in solar, batteries, and EVs. Regional defense spending is also increasing structurally, supporting demand for advanced manufacturing. The main beneficiaries are China, South Korea, and Japan, positioned in core supply chain areas. However, risks remain, including potential overcapacity, profit margin pressures from competition, persistent technological restrictions, geopolitical friction, and workforce displacement due to AI-driven automation. Market volatility is also expected to increase as investor expectations diverge on the realization of these capital investment and export themes.

marsbitHá 46m

Attracting Global Capital, Asia's New 'Super Cycle' Is Unfolding

marsbitHá 46m

Funding Weekly Report | 14 Public Funding Events, Kalshi Completes $10B New Funding Round at $220B Valuation Led by Coatue Management

Weekly Funding Roundup: 14 Deals and $10.49B+ in Total Funding, Led by Kalshi's $1B Round Last week (5.4-5.10) saw 14 notable funding events in the global blockchain ecosystem, raising over $10.49 billion in total. Key highlights include Kalshi, a prediction market platform, securing a $1 billion round led by Coatue Management, reaching a $22 billion valuation. The platform now boasts ~2 million MAUs and $178B in annualized trading volume. In DeFi, regulated on-chain reinsurer OnRe raised $5 million in Series A funding, and Bitcoin-backed credit protocol Saturn Credit completed a $2 million seed round. For Infrastructure & Tools, OpenTrade raised $17 million to expand its stablecoin yield infrastructure, and RWA platform Balcony secured $12.7 million to deploy its property settlement service in the US. Centralized Finance saw one deal: AI-driven trading platform Stockcoin.ai completed a seed round led by Amber Group. In the prediction market sector alongside Kalshi, AI-powered platform Elastics raised $2 million. Other notable deals include SC Ventures' strategic investment in crypto market maker GSR and Centrifuge securing a "seven-figure" investment from Coinbase to become a core RWA partner for Base. On the investor side, Haun Ventures raised a new $1 billion fund targeting crypto and AI, and Multi Investment raised ~$616 million to focus on blockchain and Web3 investments.

marsbitHá 1h

Funding Weekly Report | 14 Public Funding Events, Kalshi Completes $10B New Funding Round at $220B Valuation Led by Coatue Management

marsbitHá 1h

Trading

Spot
Futuros
活动图片