Don’t Celebrate Bitcoin Yet: The Trend Is Still Bearish, And This Is Why

bitcoinistPublicado em 2026-03-21Última atualização em 2026-03-21

Resumo

Based on technical analysis, Bitcoin's recent rally above $75,000 is insufficient to confirm a bullish reversal, as the overall structure remains bearish. The daily chart shows BTC is consolidating within a rising channel, identified as a bear flag pattern, following a prior downtrend. This pattern previously led to a breakdown to $60,000 in early February 2026. A key resistance zone exists around $76,000, where BTC faced rejection. Currently trading near $70,000, a weekly close below this level could trigger a further decline toward $65,000. Analysis of the weekly timeframe using the Gaussian Channel indicator, which has accurately signaled major cycle bottoms in the past, suggests that the February low may not be the final market bottom. The indicator turned bearish after that low, a deviation from historical patterns where the transition preceded the bottom. Consequently, the trend remains cautiously bearish despite short-term rallies.

Bitcoin’s brief rally above $75,000 this week led to bullish optimism in some corners of the crypto market, but technical analysis shows the trend might still be bearish. A close look at BTC’s daily and weekly charts tells a more sobering story, one that shows that the crypto king might continue on a lower correction move in the coming days.

Bitcoin Is Still Trapped Inside A Bear Flag

Bitcoin’s price recovery into the mid-$70,000s this week is not enough on its own to confirm that Bitcoin is out of danger. According to crypto analyst CrypFlow, the bigger trend is starting to look constructive on higher timeframes, but the daily chart still shows a bearish structure that has not been invalidated. Until that changes, the latest bounce may be nothing.

The daily candlestick timeframe chart shows that BTC has spent the past several weeks since early February consolidating within a rising channel structure. This is a pattern that, in the context of a prior downtrend, is technically classified as a bear flag.
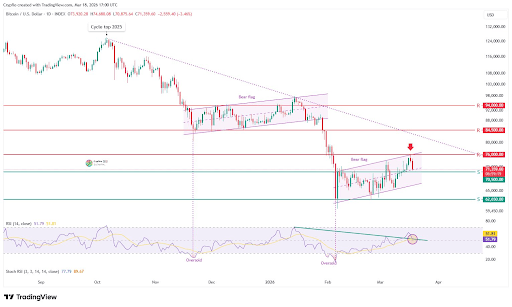
Source: Chart from CrypFlow on X

The chart shows Bitcoin rallying into the upper boundary of the flag near the $76,000 area before getting rejected. That same region also lines up with a major resistance band marked on the chart, reinforcing the idea that bulls have not yet done enough to flip the structure. The BTC price has since fallen back toward the middle of the channel, leaving the leading cryptocurrency at a short-term decision point.

As seen in the chart below, a similar bear flag was formed from mid-November 2025 to late January 2026, and this eventually led to the breakdown to $60,000 in early February 2026.

The $70,000 To $76,000 Zone Now Matters More Than Ever

The current battle is taking place between the midline of the flag and the recent rejection zone is at $76,000. At the time of writing, Bitcoin is trading at $70,610, which places it close to support around $70,000. If BTC closes the week below $70,000, then the bear flag projects the price on the path to at least $65,000.

In a separate analysis, CrypFlow turned attention to the weekly timeframe and raised a more macro-level concern using Bitcoin’s Gaussian Channel indicator. This model looks at how Bitcoin has behaved across full market cycles.

According to the analyst, Bitcoin has never formed its cycle bottom before the Gaussian Channel flips from green to red. Each major bottom has come after that transition has already taken place. This pattern played out consistently in 2015, 2018, and again in 2022, where the final lows only arrived once the channel had fully turned bearish.

Interestingly, the Gaussian Channel transitioned from green to red after Bitcoin’s low in early February, not before. Although the Bitcoin price is still holding above $60,000 for now, the implication is that this level may not be the final bottom.

BTC trading at $70,379 on the 1D chart | Source: BTCUSDT on Tradingview.com

Criptomoedas em alta

Perguntas relacionadas

QAccording to the technical analysis, why is Bitcoin's trend still considered bearish despite its recent rally above $75,000?

ABecause the daily chart shows a bear flag pattern that has not been invalidated, and the price was rejected at a major resistance near $76,000, indicating the bullish structure is not yet confirmed.

QWhat is the significance of the $70,000 to $76,000 price zone for Bitcoin's near-term movement?

AThis zone represents a critical battle between support and resistance. A weekly close below $70,000 could project a price drop to at least $65,000, according to the bear flag pattern.

QWhat does the Gaussian Channel indicator suggest about whether Bitcoin has reached its cycle bottom?

AThe Gaussian Channel transitioned from green to red after February's low, not before. Historically, major bottoms have only occurred after this transition, suggesting the $60,000 level may not be the final cycle bottom.

QWhat pattern from late 2025 to early 2026 does the current price action resemble, and what was its outcome?

AIt resembles a bear flag pattern that formed from mid-November 2025 to late January 2026, which eventually led to a breakdown to $60,000 in early February 2026.

QWhat key level must Bitcoin break to invalidate the current bearish structure on the daily chart?

ABitcoin must break and hold above the major resistance zone near $76,000 to invalidate the bear flag structure and signal a potential trend reversal.

Leituras Relacionadas

Bitcoin Boom in Full Swing: Saylor's Latest Statement Fuels Buying Speculation

MicroStrategy's Executive Chairman Michael Saylor has fueled speculation about a new Bitcoin purchase by posting "Bitcoin Drive engaged" on August 2, accompanied by the company's customary purchase tracker. This aligns with his pattern of hinting at treasury changes ahead of weekly reports. The accompanying report showed MicroStrategy's Bitcoin holdings at 843,775 BTC, with an average cost of $75,653 per coin and an unrealized loss of -$10.58B. A similar signal preceded the company's July 27 announcement, strengthening expectations for a treasury update on Monday. However, MicroStrategy's real-time ledger reflects two recent Bitcoin sales totaling 3,588 BTC, reducing holdings from 847,363 BTC to the current 843,775 BTC. The company stated these sales funded preferred stock dividends and replenished its U.S. dollar reserve. Recent reports indicate the company made no Bitcoin purchases the week ending July 26 while increasing its dollar reserve to approximately $3.75B. The company faces financial headwinds after reporting an $8.33B operating loss for Q2 2026, including an $8.32B unrealized loss on its digital assets. Management may sell up to $1.25B more in Bitcoin to meet cash obligations. The expected Monday update will reveal if the "Bitcoin Drive" signal marks a return to accumulation as MicroStrategy balances its massive Bitcoin stash against growing cash commitments.

cryptonews.ruHá 1h

Bitcoin Boom in Full Swing: Saylor's Latest Statement Fuels Buying Speculation

cryptonews.ruHá 1h

Trading

Spot

Artigos em Destaque

Como comprar T

Bem-vindo à HTX.com!Tornámos a compra de Threshold Network Token (T) simples e conveniente.Segue o nosso guia passo a passo para iniciar a tua jornada no mundo das criptos.Passo 1: cria a tua conta HTXUtiliza o teu e-mail ou número de telefone para te inscreveres numa conta gratuita na HTX.Desfruta de um processo de inscrição sem complicações e desbloqueia todas as funcionalidades.Obter a minha contaPasso 2: vai para Comprar Cripto e escolhe o teu método de pagamentoCartão de crédito/débito: usa o teu visa ou mastercard para comprar Threshold Network Token (T) instantaneamente.Saldo: usa os fundos da tua conta HTX para transacionar sem problemas.Terceiros: adicionamos métodos de pagamento populares, como Google Pay e Apple Pay, para aumentar a conveniência.P2P: transaciona diretamente com outros utilizadores na HTX.Mercado de balcão (OTC): oferecemos serviços personalizados e taxas de câmbio competitivas para os traders.Passo 3: armazena teu Threshold Network Token (T)Depois de comprar o teu Threshold Network Token (T), armazena-o na tua conta HTX.Alternativamente, podes enviá-lo para outro lugar através de transferência blockchain ou usá-lo para transacionar outras criptomoedas.Passo 4: transaciona Threshold Network Token (T)Transaciona facilmente Threshold Network Token (T) no mercado à vista da HTX.Acede simplesmente à tua conta, seleciona o teu par de trading, executa as tuas transações e monitoriza em tempo real.Oferecemos uma experiência de fácil utilização tanto para principiantes como para traders experientes.

542 Visualizações TotaisPublicado em {updateTime}Atualizado em 2026.06.02

Como comprar T

Discussões

Bem-vindo à Comunidade HTX. Aqui, pode manter-se informado sobre os mais recentes desenvolvimentos da plataforma e obter acesso a análises profissionais de mercado. As opiniões dos utilizadores sobre o preço de T (T) são apresentadas abaixo.

活动图片