Agentic Workflows for Crypto Research

insights.glassnodePublicado em 2026-04-01Última atualização em 2026-04-01

Resumo

AI coding agents are transforming crypto research by automating data analysis through natural language. This article demonstrates using an agent (like Claude Code) with the Glassnode CLI to test a hypothesis: whether extreme Bitcoin exchange inflows predict 7-day price drawdowns. The agent autonomously discovers metrics, fetches data, performs statistical analysis, and generates insights. Results show a moderate association—spike days saw ~1.9% greater drawdowns—though the sample is small. A follow-up prompt produces visualizations for validation. The workflow allows rapid iteration and is applicable to various research questions using Glassnode data, requiring only an API key and an AI agent.

AI coding agents are changing the way analysts and researchers interact with data. Instead of writing scripts line by line, you provide a hypothesis or research question to an AI agent and – it writes the code, fetches the data, runs the analysis, and returns results.

In this article we present a step-by-step real-world example: Asking an AI agent to download data via the Glassnode CLI, run a statistical analysis, and generate publication-ready charts, all from natural-language prompts.

What you will need

  1. Access to an AI agent

We use Claude Code in this walkthrough, but any agent able to execute Python and shell commands will work, including ChatGPT's Codex, Cursor, Github Copilot, Google Gemini CLI, OpenClaw, or similar tools.

  1. The Glassnode CLI (gn)

A command-line interface for the Glassnode API. Install it and configure your API key by following the Glassnode CLI docs. An API key is required.

The prompt

We will evaluate the following hypothesis: Extreme BTC exchange inflow events are predictive of 7-day forward drawdowns. To do that, we will instruct Claude Code using the following prompt:

Using the Glassnode CLI, download BTC daily exchange inflows and closing price for the last year. Analyze whether inflow spikes (days with inflows > 2 standard deviations above the mean) predict drawdowns in the following 7 days. Show me a summary with statistics and results.

That's it. One sentence describing the question, and another sentence defining the methodology. The agent takes it from there.
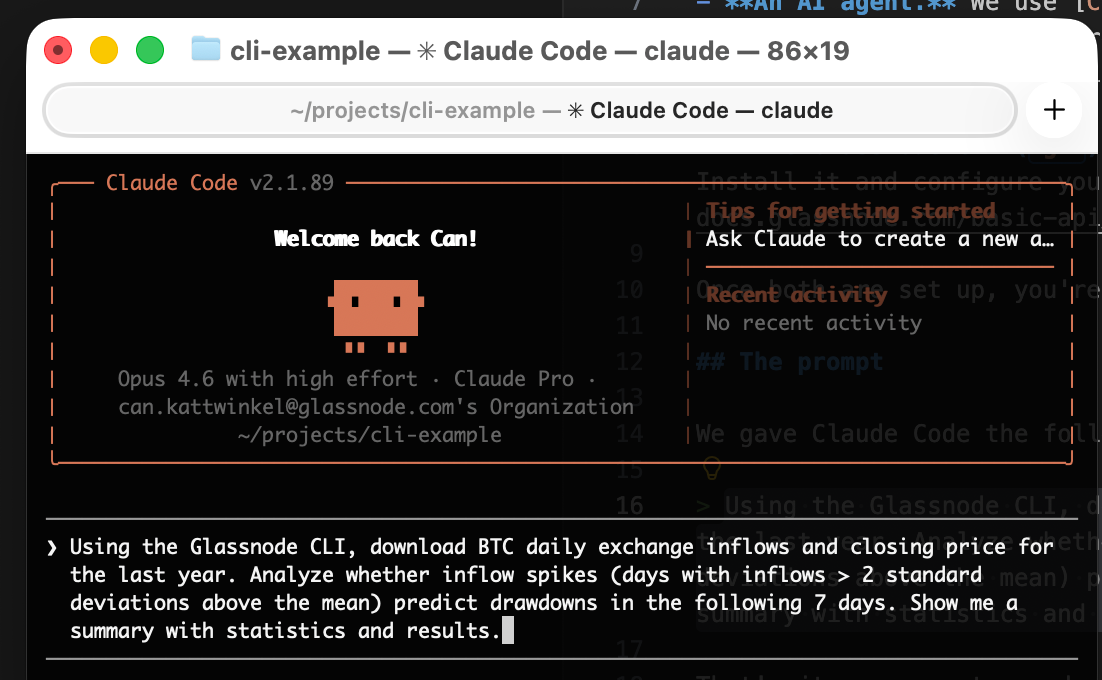
A simple prompt for the AI agent

What the agent does

Behind the scenes, the agent executes a sequence of steps:

  1. Discovers the right metrics by running gn metric list and gn metric describe to find the correct metric paths and valid parameters.
  2. Downloads the data via gn metric get, saving CSV files for both exchange inflows (transactions/transfers_volume_to_exchanges_sum) and closing price (market/price_usd_close).
  3. Writes and runs a Python analysis that computes the spike threshold, identifies spike days, calculates forward 7-day max drawdowns, and compares spike days to normal days.

The agent comes back with a readable summary:
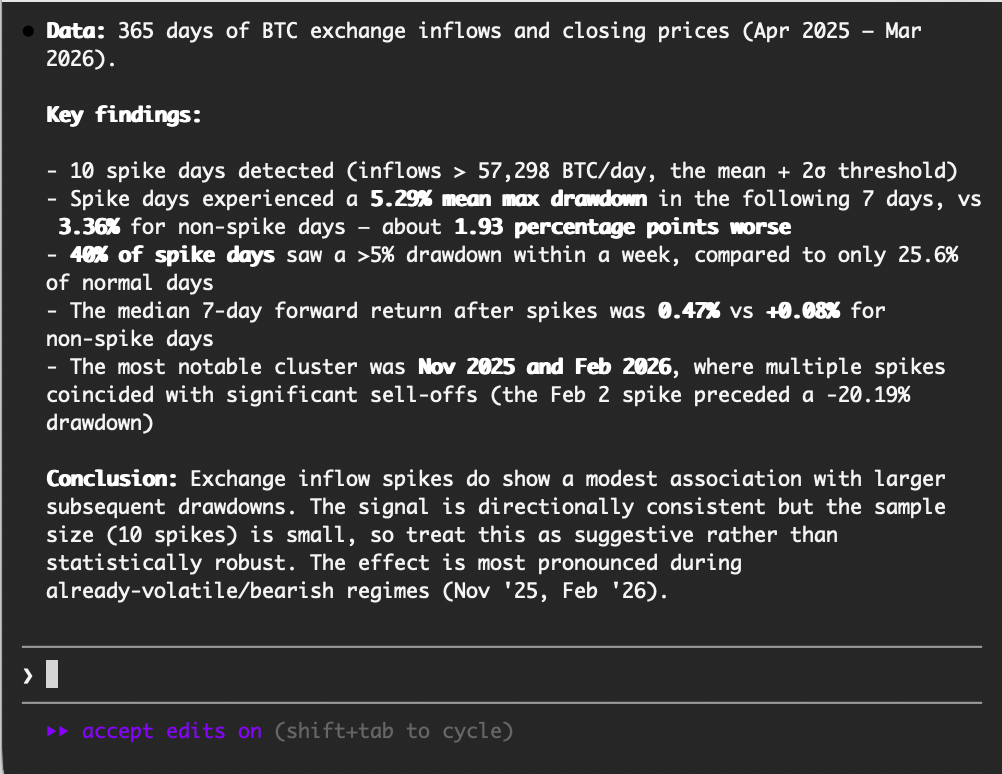
While this is just an illustrative example, our experiment does reveal a moderate association between exchange inflow spikes and subsequent drawdowns. Spike days see roughly 1.9 percentage points more drawdown on average. That said, with only 10 spike days in the sample and the effect concentrated in two volatile periods, the signal is suggestive rather than statistically robust. A rigorous backtest would need to account for overlapping windows, control for volatility regimes, use point-in-time data, and validate out-of-sample.

Visualizing the results

Visualizing the data is a good way to validate whether the numbers hold up. In this process, a simple follow-up prompt is enough:

Create a visualization that shows the data as a timeseries.

From here, you can keep iterating: adjust the chart, refine the analysis, or take the research in a different direction, all through natural language conversation.
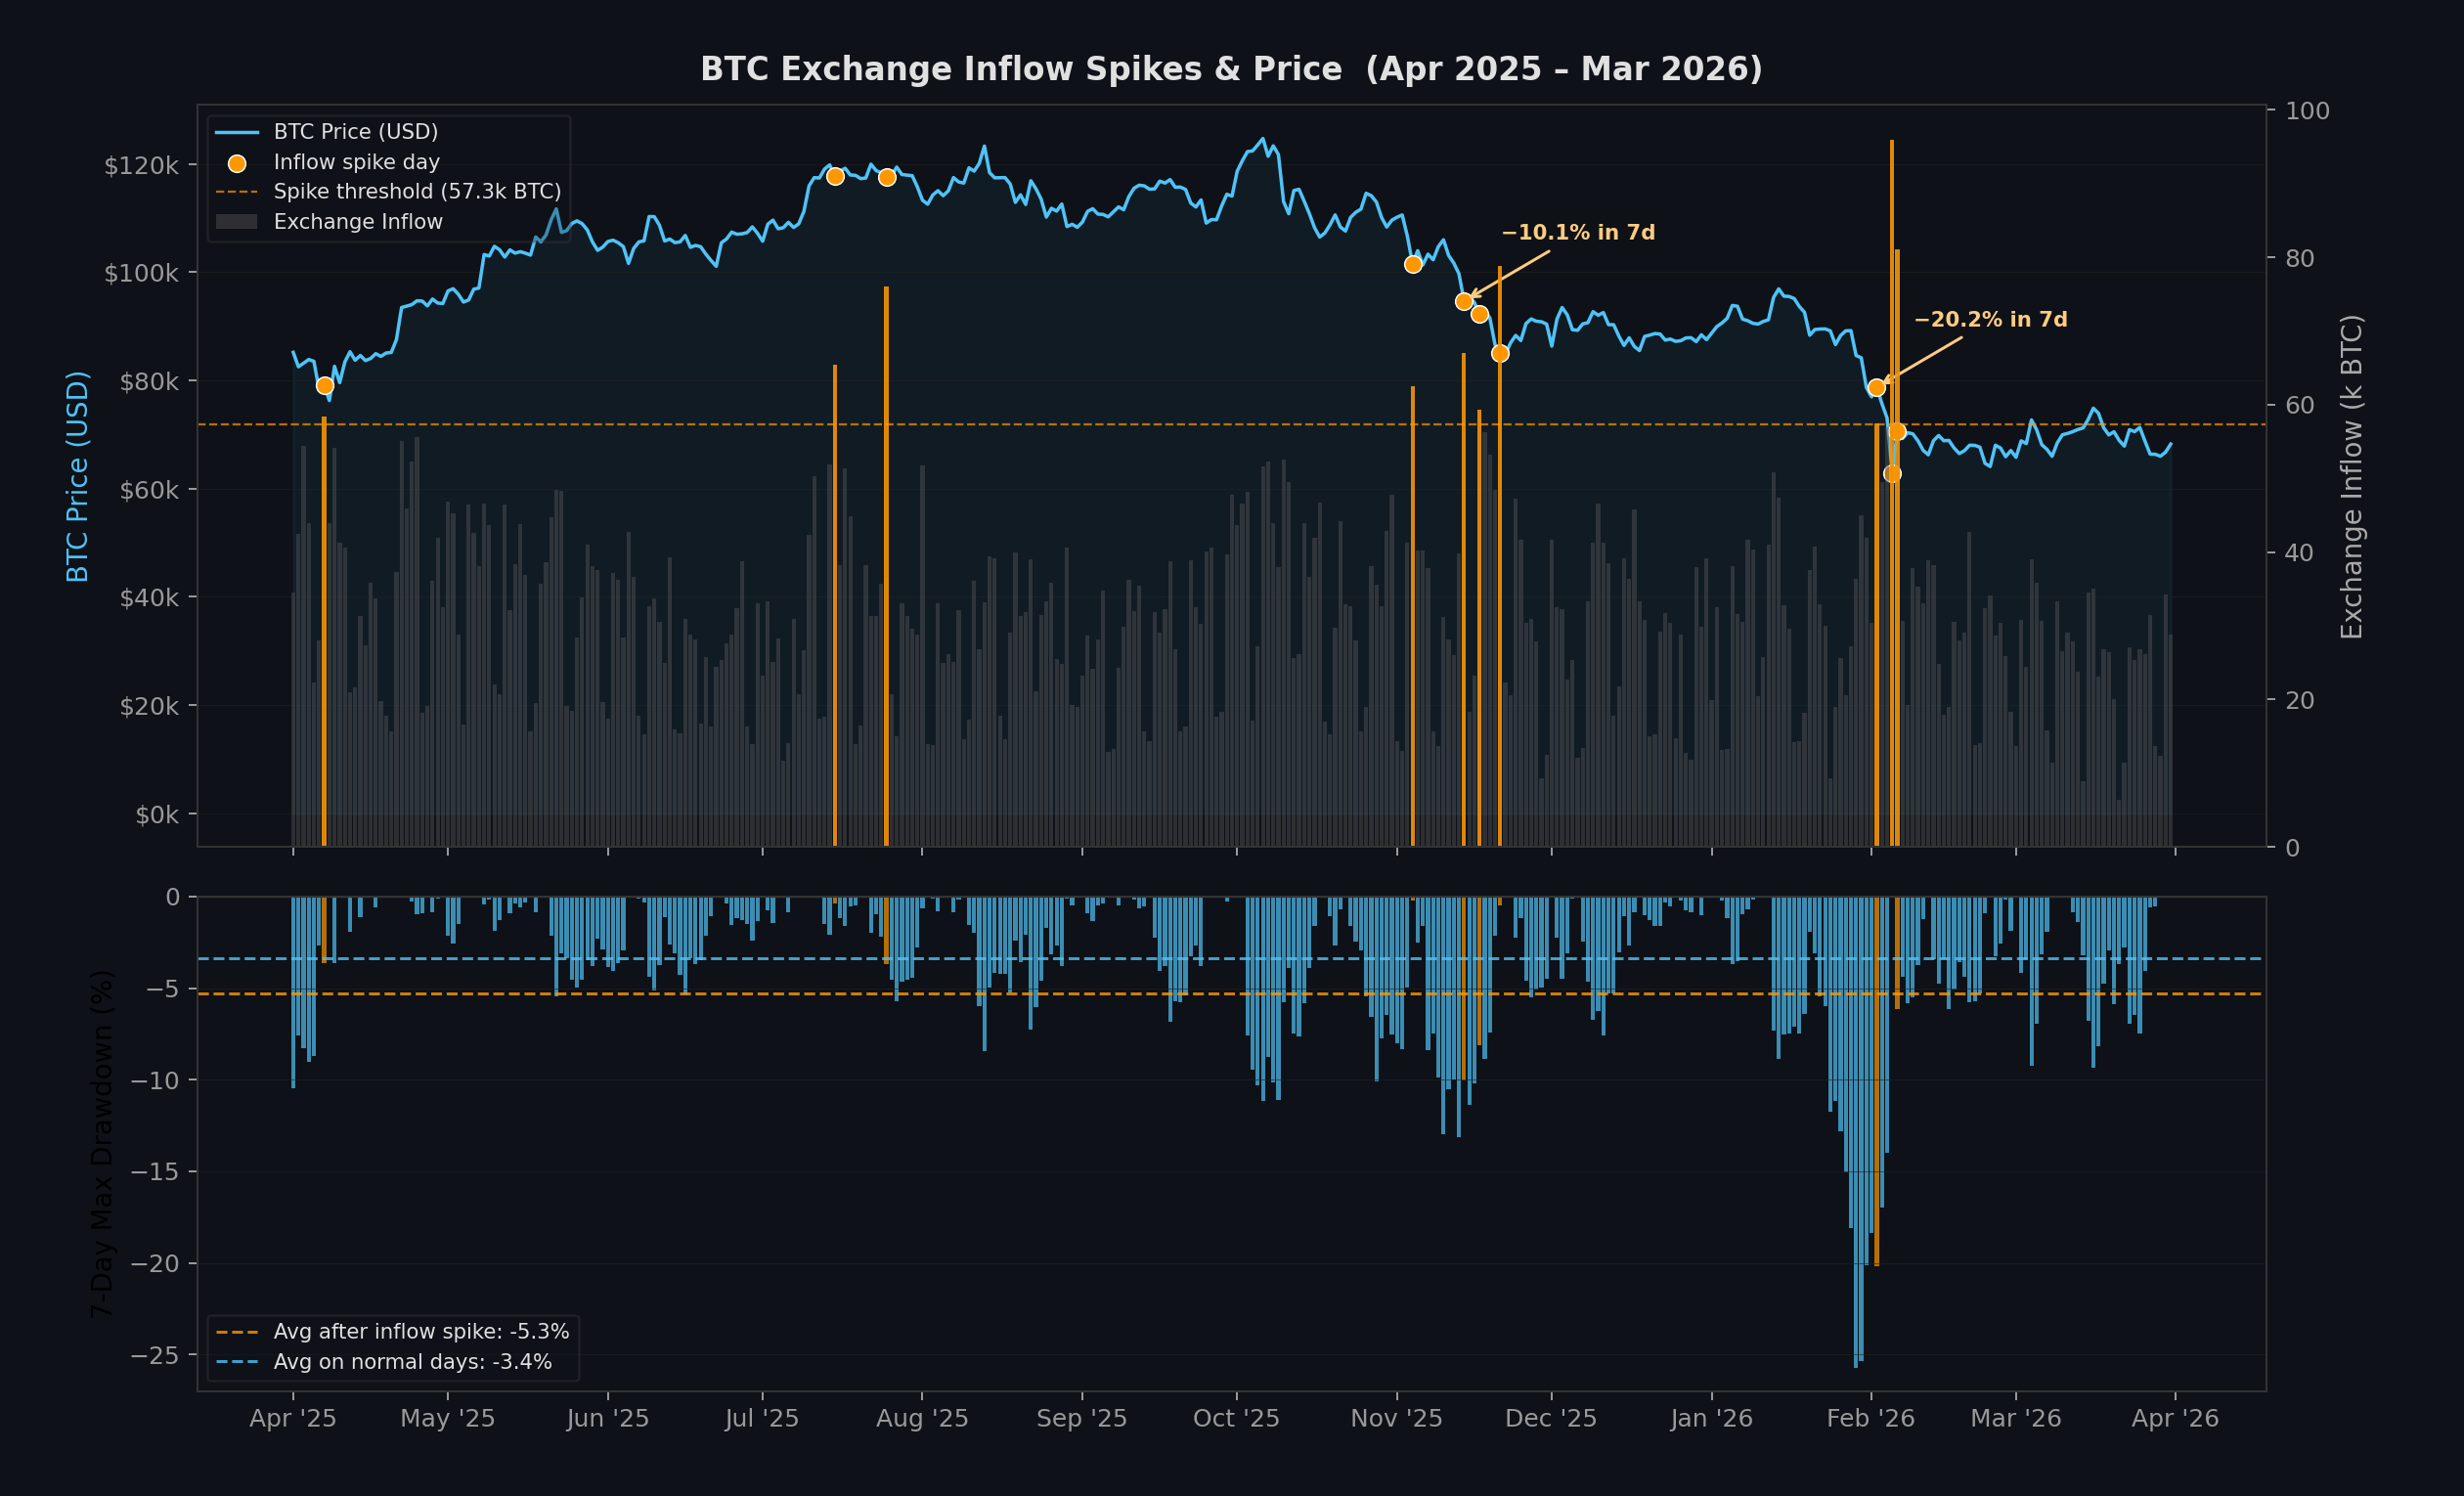
The AI-generated visualisation of Glassnode data

Get started with AI Crypto Research on Glassnode Data

The Glassnode CLI requires an API key, available to Glassnode Professional subscribers.

  1. Install the Glassnode CLI and configure your API key. See documentation
  2. Open your preferred AI coding agent (Claude Code, Codex, Cursor, Gemini CLI, OpenClaw, etc.)
  3. Start prompting. Try questions such as:
    • "Download ETH staking deposits for the last 6 months and plot the trend"
    • "Compare BTC and ETH exchange netflows over the last 90 days"
    • "Find which metric has the highest correlation with BTC 30-day returns"

The Glassnode CLI allows agents to discover and retrieve metric data without requiring manual API lookup or writing boilerplate code. Combined with an AI coding agent, the Glassnode CLI turns a research question into results in minutes.

Perguntas relacionadas

QWhat is the main advantage of using AI coding agents for crypto research as described in the article?

AThe main advantage is that AI coding agents automate the entire research workflow, allowing analysts to provide a natural-language hypothesis or research question, and the agent handles writing the code, fetching data, running analysis, and returning results, significantly speeding up the process.

QWhich specific AI agent is used in the walkthrough example for analyzing BTC exchange inflows?

AThe walkthrough uses Claude Code, but it notes that any AI agent capable of executing Python and shell commands, such as ChatGPT's Codex, Cursor, GitHub Copilot, Google Gemini CLI, or OpenClaw, would work.

QWhat hypothesis is tested in the example prompt given to the AI agent?

AThe hypothesis tested is: 'Extreme BTC exchange inflow events (days with inflows > 2 standard deviations above the mean) are predictive of 7-day forward drawdowns.'

QWhat are the key steps the AI agent performs behind the scenes after receiving the prompt?

AThe agent discovers the right metrics using Glassnode CLI commands, downloads the data (exchange inflows and closing price), writes and runs a Python analysis to compute spike thresholds and drawdowns, and returns a statistical comparison and summary.

QWhat is required to use the Glassnode CLI for AI-assisted research as mentioned in the article?

ATo use the Glassnode CLI, you need an API key, which is available to Glassnode Professional subscribers, and you must install and configure the CLI tool following the documentation.

Leituras Relacionadas

UNI Doubles in Two Months Against the Trend: A 5-Year-Overdue Value Realization

Amidst a generally stagnant crypto market in June and July, UNI, the governance token of Uniswap, saw a significant surge, nearly doubling in price from around $2.3 to $4.6. This rally represents a delayed but significant value reassessment, triggered by the practical implementation of its long-debated "fee switch" mechanism. The key turning point was the on-chain execution of the UNIfication proposal in December 2025. It activated a protocol fee on select pools, directed Unichain sequencer revenue (net of costs) to a communal treasury, executed a one-time burn of 100 million UNI, and established a system where all protocol revenue flows into a "TokenJar" contract. This treasury has a single exit: purchasing and permanently burning UNI via a "Firepit" contract. Initially, the market reacted tepidly as the generated revenue and corresponding burn rate were modest. The narrative shifted dramatically in July 2025 with two major developments. First, the launch of Robinhood Chain, tailored for tokenized stocks, rapidly became a primary source of volume and fees for Uniswap, at one point contributing nearly half of its weekly fees. Second, governance votes successfully expanded the fee mechanism to v4 pools and initiated a temperature check for fees on Robinhood Chain. The activation of v4 fees caused the protocol's daily revenue earmarked for UNI burns to nearly triple. The core of UNI's recent price action is the transition from a pure governance token to a cash-flow asset with a permanent, protocol-funded buyer. Its effectiveness is amplified by UNI's mature and widely distributed supply, with no major impending unlocks to dilute the impact of the buybacks. The sustainability of this rally now hinges on whether the transaction volume, particularly on Robinhood Chain, persists after its initial gas subsidies expire, determining if this is a genuine value realization or a subsidy-fueled spike.

marsbitHá 57m

UNI Doubles in Two Months Against the Trend: A 5-Year-Overdue Value Realization

marsbitHá 57m

Breaking: Google Earth Urgently Pulls Back Nano Banana 2 Image Generation Feature!

Google Earth's newly launched "Create image" feature, powered by the Nano Banana 2 AI image generation model, was abruptly withdrawn shortly after its release due to being "played" by users. The feature allowed users to generate and overlay AI-created visuals directly onto real-world satellite and 3D maps in Google Earth. The tool enabled creative applications like historical recreations (e.g., visualizing ancient Pompeii), generating informational graphics for landmarks, and envisioning architectural projects or futuristic cityscapes on real terrain. It operated under "geospatial grounding," meaning the AI respected the underlying geography, topography, and perspective of the chosen map view. The model also integrated with Gemini to retrieve relevant factual information. However, upon release, users quickly tested its limits. A prominent example involved reimagining Philadelphia's historic Independence Hall as a post-apocalyptic ruin overrun by "happy" zombies, evil clowns, and giant alien mechs. This highlighted both the feature's playful potential and its risks regarding the generation of inappropriate or misleading content on realistic maps, leading to its swift temporary removal. Google stated it would re-release the feature after implementing "enhanced guardrails." Analysts note this move strategically leverages Google's vast proprietary geospatial data, positioning its AI not just for artistic generation but for spatially accurate world visualization—a unique advantage in the competitive AI image generation landscape.

marsbitHá 2h

Breaking: Google Earth Urgently Pulls Back Nano Banana 2 Image Generation Feature!

marsbitHá 2h

Altman Admits: Overestimated AI Snatching Jobs! Huang Renxun: The Unemployment Narrative Is Completely Backwards

Sam Altman has revised his earlier predictions about AI rapidly replacing jobs, admitting he overestimated the speed at which AI would eliminate entry-level white-collar roles. Speaking on the "Invest Like the Best" podcast, he stated that people do not truly want an AI CEO, as accountability and human connection remain critical. He found that individuals prefer interacting with people who can be held responsible for decisions. Similarly, NVIDIA's Jensen Huang argued that the narrative of AI destroying jobs is misguided. He distinguishes between tasks and jobs, noting that while AI can automate specific tasks, entire jobs—encompassing communication, judgment, coordination, and accountability—are not eliminated. He cited examples like radiologists and software engineers, where demand for these roles has increased as AI handles repetitive tasks, allowing for business expansion and the creation of more positions. Data from a University of Maryland and LinkUp study supports this, showing that U.S. job postings for new graduates have actually risen, countering the fear of vanishing entry-level roles. However, a significant shift is occurring: the traditional entry-level tasks that help newcomers gain experience are being automated, making initial career access more challenging. The key insight is that as AI takes over standardized tasks, the enduring value of human work shifts toward areas of responsibility, trust-building, and final decision-making—aspects that AI cannot replicate. The real "moat" for professionals lies in these irreplaceable human elements.

marsbitHá 2h

Altman Admits: Overestimated AI Snatching Jobs! Huang Renxun: The Unemployment Narrative Is Completely Backwards

marsbitHá 2h

Trading

Spot
活动图片