2026-08-08 Sábado

Notícias de cripto - Página 357

Mantenha-se a par do mercado de cripto. Notícias em tempo real, análises, preços, histórias em alta e análise de especialistas — tudo num só lugar.

An AI Version of the 'Subprime Crisis'? A Hidden Debt of $1.8 Trillion is Accumulating in the Shadows Amid the Frenzy

Amidst the AI infrastructure construction boom, a massive debt expansion is forming, with the most dangerous portion remaining off-balance sheets. Morgan Stanley research reveals approximately $1.8 trillion in off-balance-sheet exposures, including nearly $1 trillion in purchase commitments and over $800 billion in non-active lease contracts. These future cash outflows are not recorded as liabilities. The leverage of hyperscale cloud companies has surged from 0.9x to 1.8x in just two quarters. Private credit firms like Apollo and Blackstone are shifting leverage into the supply chain through complex, opaque SPV (Special Purpose Vehicle) financing structures. Global AI-related bond issuance has skyrocketed, with annual volume projected to exceed $570 billion. However, capital expenditure growth is outpacing revenue and free cash flow. Major cloud providers may see free cash flow approach zero or turn negative in 2026. A significant 'depreciation cliff' looms as vast amounts of current capital spending, recorded as 'construction in progress,' have yet to begin depreciating, artificially inflating current profit margins. Future depreciation could severely pressure earnings. The core risk is identified as a series of timing mismatches, not an immediate solvency crisis. Investment is racing ahead of monetization, leverage is being obscured, and accounting classifications hinder comparability. The entire financing structure faces a fundamental stress test if AI commercialization lags or enterprise clients shift to cheaper alternatives, potentially triggering chain reactions within the highly interconnected funding ecosystem.

marsbit06/15 07:38

An AI Version of the 'Subprime Crisis'? A Hidden Debt of $1.8 Trillion is Accumulating in the Shadows Amid the Frenzy

marsbit06/15 07:38

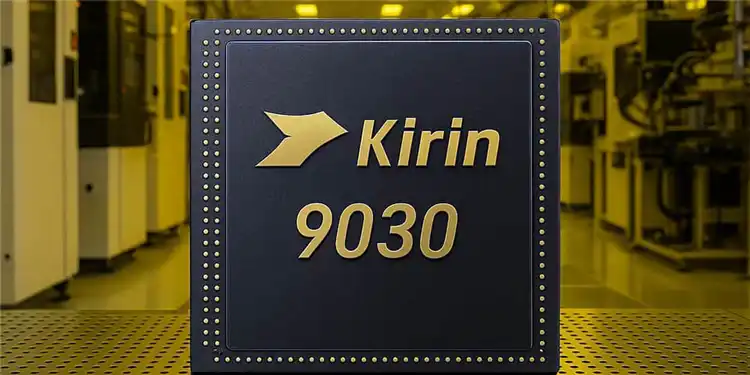
SemiAnalysis Dissects Huawei's Kirin 9030: Process Technology Halted, So They Folded the Chip

SemiAnalysis has published a detailed teardown report on the HiSilicon Kirin 9030 Pro chipset found in Huawei's Mate 80 Pro. Fabricated using SMIC's most advanced N+3 node without EUV lithography, the analysis reveals significant technical achievements and strategic shifts. The report indicates SMIC's N+3 has achieved transistor density comparable to TSMC's N6 (113.4 vs 107.7 MTr/mm²), primarily through aggressive use of Self-Aligned Quadruple Patterning (SAQP) for its metal layers. This results in a notably small 32.5nm M0 metal pitch. However, SemiAnalysis notes this achievement comes with significantly higher process complexity, cost, and potential yield challenges compared to competitors using more advanced tools. The Kirin 9030 design maximizes this constrained density. While its GPU performance has improved ~70% and matches Qualcomm's 2022 flagship level, the CPU core's IPC lags behind current top-tier designs from Apple and Qualcomm, a gap attributed to the underlying manufacturing technology rather than design capability. Facing long-term restrictions on advanced tools, Huawei is charting a new path. The report highlights the company's "LogicFolding" roadmap, a 3D stacking technique aimed at shortening signal paths to boost performance and efficiency. The goal is to reach 5GHz frequency and a projected density of 295 MTr/mm² by 2031. SemiAnalysis concludes that export controls have not halted China's chip progress but have fundamentally altered its trajectory, making it more expensive and complex. This has spurred innovation in alternative areas like 3D stacking and domestic EDA tool development, with Huawei's supply chain also beginning to integrate Chinese memory from CXMT.

marsbit06/15 06:52

SemiAnalysis Dissects Huawei's Kirin 9030: Process Technology Halted, So They Folded the Chip

marsbit06/15 06:52

How Will the Price Move Before SpaceX's Next Share Unlock?

TL;DR Investors buying SPCX after SpaceX's IPO are not simply investing in a typical tech stock. It’s a high-valuation asset driven by Musk's narrative, Starlink, and space transport potential, but with a key twist: a very small initial float of ~4% has led to significant post-listing price appreciation. The current price action reflects a timing gap. Before the first lock-up expiration (estimated around August, subject to official confirmation), scarcity and high demand could continue to push prices up. Short-term bulls focus on low float, FOMO, and potential index inclusion. However, bears point to the supply dynamics that will change post-lockup. Existing shareholders still hold over 95% of shares, which will be released in stages starting from the first unlock window. This introduces future selling pressure from low-cost holders. The upcoming Q2 earnings report is a critical catalyst before the unlock. It will test whether the company's fundamentals can justify the current ~$2.1T valuation. Strong results could support the pre-unlock momentum, while weak figures could amplify concerns about future supply. The trading thesis is shifting from immediate scarcity ("can't buy enough") to evaluating future absorption capacity ("who will buy when more supply hits"). The path ahead hinges on the specifics of the unlock schedule, Q2 earnings performance, and whether anticipated passive index buying materializes.

marsbit06/15 06:31

How Will the Price Move Before SpaceX's Next Share Unlock?

marsbit06/15 06:31

Bitcoin Short-Term Bullish Structure Validated, HYPE Low-Entry Window Opens | Guest Analysis

**Market Analysis Summary (Week of June 2026)** **Overall Market Context:** The market environment is exceptionally complex, with the unexpected US-Iran agreement and the reopening of the Strait of Hormuz triggering a global asset repricing and significant volatility. This heightened noise underscores the importance of a structured analytical framework. **Bitcoin (BTC) Analysis & Strategy:** * **Current Status:** The price has climbed above $65,000, currently in a rebound phase (segment 38-39) following a complex 12-segment correction from the May high of $82,850. * **Key Levels:** * **Primary Resistance:** $69,500–$70,500. A successful breakout above $65,000 targets this zone. * **Primary Support:** $65,000 (immediate), followed by $59,000–$60,000 and $55,000. * **Weekly Outlook & Strategy:** The focus is on the confirmation of the $65,000 level. * **Bullish Scenario (Hold $65K):** A move toward the $69.5K–$70.5K resistance zone is anticipated, which is a potential area for initiating medium-term short positions. * **Bearish Scenario (Break below $65K):** A retest of the $60,000–$62,000 support range is likely. * **Medium-Term Strategy:** Currently neutral. Plan to establish short positions (up to 60% allocation) either in the $69.5K–$70.5K resistance zone upon signs of rejection, or on a confirmed breakdown below $65,000 and further below $59K–$60K. * **Short-Term Strategy:** Utilize 30% capital for scalping opportunities based on support/resistance levels, using 30/60-minute charts. **HYPE Analysis & Strategy:** * **Current Status:** The price has stabilized around $52 after a four-segment decline from the June high of $75.87 and is now in a rebound (segment 50-51). * **Key Levels:** * **Primary Resistance:** $62.50–$64.57. Watch for potential rejection here to form a lower high. * **Primary Support:** $52–$55.50, followed by $47–$49. * **Weekly Outlook & Strategy:** Adopt a "buy on dips, avoid chasing rallies" approach. * **Core View:** Monitor the price action and potential formation of a lower high ("endpoint 51") in the $62.50–$64.57 resistance zone. * **Short-Term Strategy:** Consider light long positions (max 30% allocation) if the price finds support and shows reversal signals in the $52–$54.50 or deeper $47–$49 support zones, confirmed by proprietary quantitative bottom signals. **Trade Review:** Last week's HYPE short-term long trade, executed based on proprietary "Price Difference" and "Momentum" model signals, yielded a profit of approximately 11.88%. The entry was near $54.39 and exit near $60.85. **Risk Management Reminder:** Always set an initial stop-loss upon entry. Move stop-loss to breakeven at +1% profit, then trail it upwards to lock in gains as the trade progresses. *Disclaimer: All analysis, models, and strategies are based on personal technical analysis for educational purposes only, not investment advice. The market carries inherent risk.*

Odaily星球日报06/15 06:27

Bitcoin Short-Term Bullish Structure Validated, HYPE Low-Entry Window Opens | Guest Analysis

Odaily星球日报06/15 06:27

Bitcoin Short-Term Bullish Structure Validated, HYPE Accumulation Window Opens | Guest Analysis

**Bitcoin and HYPE Market Analysis: Short-Term Outlook and Trading Strategies** This market analysis examines Bitcoin (BTC) and HYPE amid volatile conditions, providing short-term outlooks and specific trading strategies. **Key Outlooks:** * **Bitcoin (BTC):** Focus is on whether BTC's recent move above $65,000 holds. A successful breakout could lead to a test of the $69,500-$70,500 resistance zone, where medium-term short positions are considered. A failure, breaking below $65,000, may trigger a decline towards the $59,000-$60,000 support area. * **HYPE:** The token completed a four-wave correction and is now rebounding. The key resistance zone is $62.5-$64.57. The trading strategy is "buy on dips," looking for entry opportunities near the $52-$54.5 or deeper $47-$49 support zones, pending confirmation from proprietary models. **BTC Trading Strategy:** * **Medium-term:** Primarily looking to establish short positions (up to 60% allocated capital) if price rallies to the $69,500-$70,500 resistance area and shows signs of reversal. Alternative plans involve initiating shorts on a breakdown below $65,000. * **Short-term:** Allocate up to 30% capital for intraday "spread" trades based on support/resistance levels on 30/60-minute charts. **HYPE Trading Strategy:** * **Short-term:** Adopt a dip-buying approach. Consider light long positions (under 30% capital) when price tests key support levels ($52-$54.5 or $47-$49) and shows stabilization, confirmed by proprietary "Price Spread" and "Momentum Quant" models. **Trade Recap:** The analysis reviews a successful HYPE long trade from the previous week, executed at ~$54.39 and closed at ~$60.85 for an ~11.88% gain, based on signals from the aforementioned models. **Risk Management Emphasis:** The article stresses strict capital allocation (under 30-60%), immediate initial stop-loss placement, and a trailing stop-loss protocol to lock in profits as trades move favorably. ***Disclaimer:** All analysis, models, and strategies are for educational purposes based on technical analysis, not investment advice. Markets are volatile; trade with caution.*

marsbit06/15 06:24

Bitcoin Short-Term Bullish Structure Validated, HYPE Accumulation Window Opens | Guest Analysis

marsbit06/15 06:24

Super-Rich Hoarded Record Cash in February, Stock Market Hit New Highs Four Months Later: Who's Getting Fooled?

In February, the total assets in US money market funds reached a record high of approximately $8.25 trillion, a trend highlighted by high-net-worth individuals increasing their cash holdings. Notably, Warren Buffett's Berkshire Hathaway amassed a $381.7 billion cash pile ahead of his 2025 retirement, while other prominent figures like Peter Thiel sold tech stocks, fueling narratives of wealthy investors seeking safety. However, by June, the trend reversed. Money market fund assets fell to around $7.87 trillion, indicating a flow of capital back into equities. Concurrently, the S&P 500 and Nasdaq reached all-time highs, with the S&P 500 surpassing 7600 points. This market surge occurred despite the earlier defensive moves, highlighting a potential opportunity cost for those who retreated to cash. Analysis shows that since early 2022, the S&P 500's total return significantly outpaced that of prime money market funds. The capital shifted from equities appears to have been partly reallocated into alternative investments like real estate, art, and private credit, especially among ultra-high-net-worth individuals. Meanwhile, major investment banks like Goldman Sachs and Morgan Stanley have raised their year-end targets for the S&P 500, citing AI-driven earnings growth, while also cautioning about risks including market concentration and economic fragility beneath the surface rally.

marsbit06/15 06:02

Super-Rich Hoarded Record Cash in February, Stock Market Hit New Highs Four Months Later: Who's Getting Fooled?

marsbit06/15 06:02

Robot Vacuums Have Been Competing for 20 Years, So Why Are 90% of Chinese Households Still Hesitant?

The article explores why over 90% of Chinese households are still hesitant to adopt robotic vacuum cleaners despite two decades of industry development, identifying a core "trust gap" as the primary barrier. The central issue is not a lack of need, but user concerns about reliability in dynamic, real-world home environments. Common anxieties include the robot dragging pet waste, colliding with transparent objects, tangling in cords, scattering cat litter, getting stuck on thresholds, missing corners under furniture, and requiring high-maintenance bases that develop odors. The industry's past focus on competing on technical specs (suction power, mopping functions) has not adequately addressed these practical usability and trust problems. The piece then examines DJI's entry into the market with its ROMO 2 model as a potential new approach. Leveraging its expertise in spatial perception and obstacle avoidance from drones, DJI's solution emphasizes "less intervention" through three key principles: less manual re-cleaning, less user rescue missions, and less maintenance. Specific ROMO 2 features highlighted include advanced obstacle recognition (handling transparent objects and small items), adaptive leg mechanisms for climbing thresholds (up to 8.5cm), an extendable arm for reaching under furniture, AI for identifying and appropriately handling different mess types (e.g., avoiding scattering dry debris), and a self-cleaning base designed to minimize user upkeep. The article argues the next phase of competition should shift from a "parameter race" to a "trust race." It draws a parallel to the iPhone's simplification of the smartphone, suggesting that focusing on a reliable, low-hassle user experience—where people feel confident leaving their floors to the machine—is what's needed to finally convince the vast majority of观望ing families. The ultimate test for products like the ROMO 2 will be long-term user adoption, retention, and口碑, not just technical specifications.

marsbit06/15 06:01

Robot Vacuums Have Been Competing for 20 Years, So Why Are 90% of Chinese Households Still Hesitant?

marsbit06/15 06:01

活动图片