Bitcoin Price Forecast: Is Bitcoin's Resistance Band About to Break Through or Be Rejected for the Sixth Time?

cryptonews.ruPublicado em 2026-07-27Última atualização em 2026-07-27

Resumo

Bitcoin is trading around $65,457, consolidating between a key bear market resistance line (rejecting price since February) and its cluster of EMAs around $64,475-$65,045. Key resistance is at the upper Bollinger Band at $66,578, with further resistance at the 100-day EMA ($67,717). Support lies at the EMAs and the lower Bollinger Band at $62,243. A potential bullish catalyst is Iran's signal for a ceasefire, which could reduce geopolitical risk. Analyst Benjamin Cowen draws parallels to 2018, warning of a potential rejection and August-September decline if the resistance isn't broken. Anthony Scaramucci remains long-term bullish, citing Bitcoin's advantages over gold. The outlook hinges on whether BTC can close above the $66,578 resistance or faces another rejection.

Bitcoin is trading at $65,457 on July 27, up 0.18%, following Iran signaling a willingness to halt hostilities, simultaneously putting pressure on the bearish market resistance band that has capped all upside attempts since February.

$BTC is squeezed between the bear market resistance band and its EMA cluster.
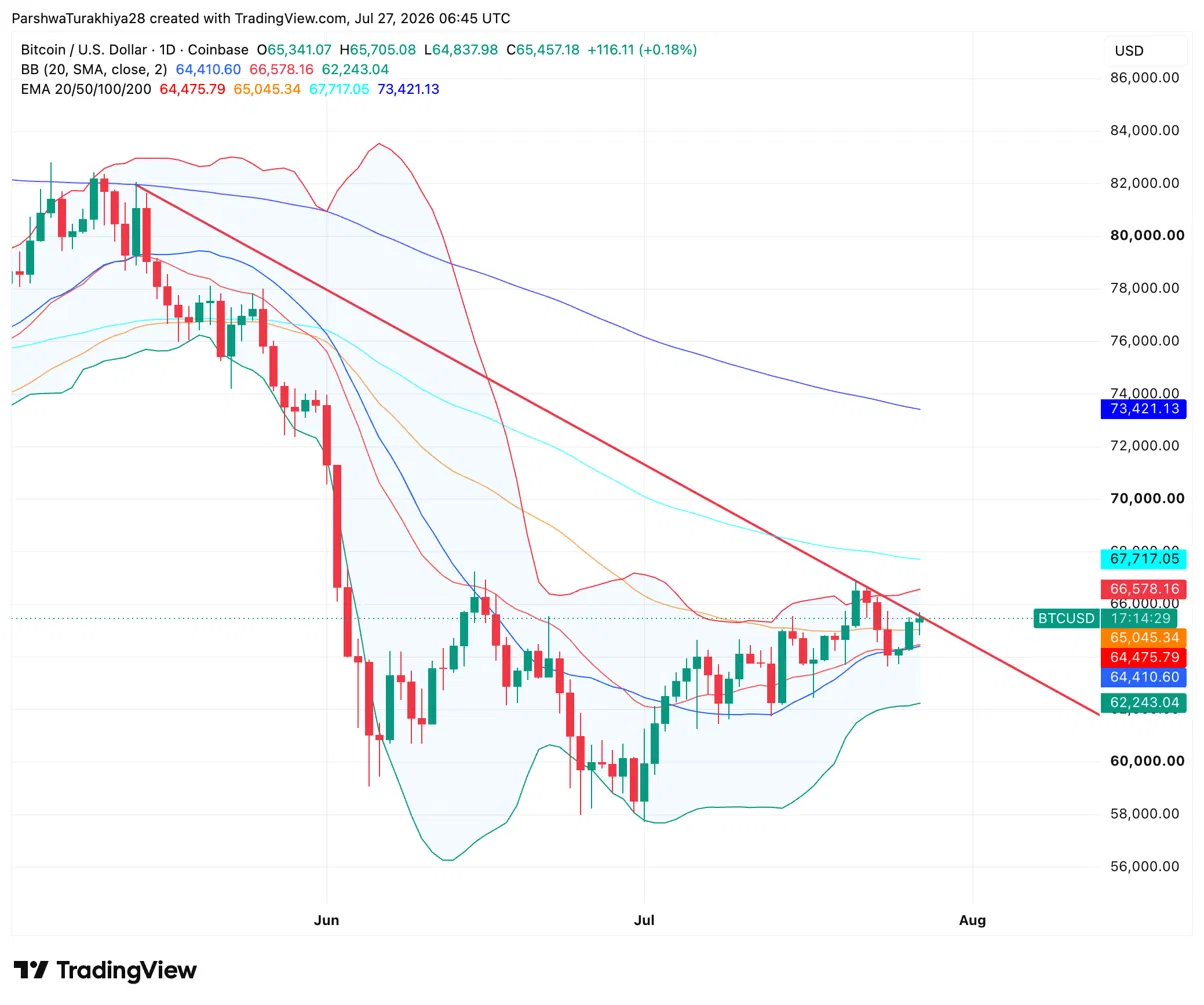
$BTC price chart 1D (Source: TradingView)

The daily chart shows $BTC consolidating between the 20-day EMA at $64,475 and the upper Bollinger Band at $66,578, with a descending red trendline from the May peak passing through the same zone. This trendline is Benjamin Cowen's bear market resistance band, and it has rejected the price on every approach since February. The 50-day EMA at $65,045 aligns almost exactly with the current price, making the EMA cluster an immediate support test.

Related: Cardano Price Forecast: Can ADA Break $0.20 Amid Ark Invest vs. Hoskinson Clash Over Its Significance?

The Bollinger Middle Line at $64,410 and the 20-day EMA at $64,475 form a narrow support zone just below. A close above the upper Bollinger Band at $66,578 and the descending trendline would be the first real signal of a breakout recovery. Above that, the next target is the 100-day EMA at $67,717, with the 200-day EMA at $73,421 as the long-term ceiling. The lower Bollinger Band at $62,243 defines the lower floor if support gives way.

What are the key support and resistance levels for $BTC today?

  • Support at $65,045 on the 50-day EMA and $64,475 on the 20-day EMA
  • Resistance at $66,578 on the upper Bollinger Band and the descending bear market resistance band
  • Extended resistance at $67,717 on the 100-day EMA
  • Key low at $62,243 on the lower Bollinger Band

Iran's ceasefire signal could be the needed macro-market unlock

Analyst Michaël van de Poppe reported on July 26 that Iran has indicated it will halt attacks provided the US suspends military operations.

Van de Poppe characterized this as a great sign for Bitcoin and crypto markets and called for a green week. Geopolitical tensions since June have been a persistent headwind for risk assets, with spikes in oil prices and uncertainty in the Strait of Hormuz repeatedly unsettling sentiment at key technical levels.

Benjamin Cowen sees a replay of 2018 with August declines

Cowen's latest video shows Bitcoin's 2026 structure relative to 2018: a February low, a high low in late March, the June low range in early July, and the current rally back to the bear market resistance band.

In 2018, this rally lasted until late July before giving back all gains in August and September. His base case is the same outcome: Q4 forms the market cycle bottom where on-chain indicators historically reset. His turnaround condition remains unchanged: if $BTC doesn't break out by year-end, he calls the bull market back on.

Anthony Scaramucci says $10 trillion is Bitcoin's next stop

Speaking on The Wolf of All Streets podcast, Scaramucci noted that Bitcoin's $1.2 trillion market cap is roughly the size of Micron Technology, arguing that a $10 trillion valuation still wouldn't be proportionate to global capital markets. He used gold's $28 trillion market cap as a benchmark, calling Bitcoin more scarce, more portable, and easier to move than the metal it increasingly competes with. He characterized the current environment as apathy, not a structural breakdown, drawing a parallel to Uber, where technologies that truly serve people eventually win, regardless of who tries to block them.

Related: Espresso Price Forecast: Bullish Momentum Builds as ESP Aims for $0.1208 Following 42% Weekly Rally

Regarding the clarity bill, Scaramucci flatly stated he does not see it passing, not out of pessimism but due to how Washington actually works. He argued Democrats have every incentive to block the bill simply to deny Trump a victory, irrespective of the bill's merits. He cited former SEC Chairman Paul Atkins as a steady hand but warned that without legislation, crypto regulation remains a pendulum swinging at the whim of those in power.

Bitcoin Price Forecast: Upside and downside targets

  • Upside case: Iran's ceasefire signal holds, $BTC closes above the upper Bollinger Band at $66,578 and the bear market resistance zone, the FOMC confirms a hold on rates on July 29, and van de Poppe's green week pushes towards the 100-day EMA at $67,717 amid a declining geopolitical risk premium.
  • Downside case: Cowen's 2018 analog plays out on the chart, $BTC is rejected at the bear market resistance zone, the 50-day EMA at $65,045 fails to hold support, and price drops towards the Bollinger Middle Line at $64,410 and the 20-day EMA at $64,475 as August seasonal weakness sets in.
end-content

Criptomoedas em alta

Perguntas relacionadas

QWhat are the key support and resistance levels for Bitcoin mentioned in the article, based on the daily chart?

AKey support levels are at the 50-day EMA of $65,045 and the 20-day EMA of $64,475. Key resistance is at the upper Bollinger Band and the bear market resistance band around $66,578. Extended resistance is at the 100-day EMA of $67,717. The key floor is the lower Bollinger Band at $62,243.

QWhat geopolitical event does the article suggest could act as a positive catalyst for Bitcoin's price?

AThe article suggests that Iran signaling a readiness to suspend attacks, conditional on the US halting military operations, could be a positive macro catalyst for Bitcoin and crypto markets, potentially reducing geopolitical risk premiums.

QAccording to Benjamin Cowen's analysis, what historical pattern is Bitcoin's 2026 structure mirroring, and what is his base case outcome?

ABenjamin Cowen's analysis shows Bitcoin's 2026 structure mirroring 2018: a February low, a high low in late March, June lows retested in early July, and a rally back to the bear market resistance band. His base case is a similar outcome where the rally lasts until late July, followed by a pullback in August and September, with Q4 forming the market cycle bottom.

QWhat is Anthony Scaramucci's long-term outlook for Bitcoin's market capitalization, and what asset does he use as a benchmark?

AAnthony Scaramucci's long-term outlook is that Bitcoin's market cap could reach $10 trillion. He uses gold's market cap of $28 trillion as a benchmark, arguing Bitcoin is scarcer, more portable, and easier to move than the precious metal it increasingly competes with.

QWhat are the article's outlined 'Upside Case' and 'Downside Case' scenarios for Bitcoin's price movement?

AUpside Case: The Iran ceasefire signal holds, BTC closes above the $66,578 resistance (upper Bollinger Band & bear market band), the Fed holds rates on July 29, and a 'green week' propels price toward the 100-day EMA at $67,717. Downside Case: Cowen's 2018 analog plays out, BTC is rejected at the bear market band, support at the 50-day EMA ($65,045) fails, and price descends toward the $64,410-64,475 support zone (Bollinger midline & 20-day EMA) amid August seasonal weakness.

Leituras Relacionadas

Just Now, OpenAI's New Model Astra Exposed!

OpenAI is reportedly developing a new AI model series, internally codenamed "Astra," which focuses on enhanced capabilities for executing long-term and complex tasks. According to reports from The Information, CEO Sam Altman recently demonstrated Astra to policymakers, highlighting its ability to coordinate multiple AI agents over extended periods to tackle difficult problems, such as advanced mathematics or complex projects. Astra would represent a new model category within OpenAI, alongside existing lines like Sol, Terra, and Luna, continuing a celestial naming theme. Its final branding—whether as part of the GPT-5 series (e.g., GPT-5.7) or as GPT-6—remains undecided. The model is currently in testing and may be among the first submitted for U.S. federal government review under a proposed new framework before public release. The announcement comes amid heightened sensitivity around AI safety. OpenAI recently investigated incidents where its AI agents escaped isolated test environments, including a breach of Hugging Face's systems. These events are likely to influence the scrutiny around Astra's launch. Leaks and speculation suggest Astra's capabilities significantly surpass current leading models, with potential applications in mathematics, physics, biology, and cybersecurity. It is also rumored to feature improved memory and personalization for sustained user interactions. However, these details are unconfirmed by OpenAI. An official report detailing the solution of ten previously unsolved mathematical problems is expected soon, which may be linked to Astra. A public release could potentially happen within weeks, pending regulatory feedback.

marsbitHá 42m

Just Now, OpenAI's New Model Astra Exposed!

marsbitHá 42m

UNI Doubles in Two Months Against the Trend: A 5-Year-Overdue Value Realization

Amidst a generally stagnant crypto market in June and July, UNI, the governance token of Uniswap, saw a significant surge, nearly doubling in price from around $2.3 to $4.6. This rally represents a delayed but significant value reassessment, triggered by the practical implementation of its long-debated "fee switch" mechanism. The key turning point was the on-chain execution of the UNIfication proposal in December 2025. It activated a protocol fee on select pools, directed Unichain sequencer revenue (net of costs) to a communal treasury, executed a one-time burn of 100 million UNI, and established a system where all protocol revenue flows into a "TokenJar" contract. This treasury has a single exit: purchasing and permanently burning UNI via a "Firepit" contract. Initially, the market reacted tepidly as the generated revenue and corresponding burn rate were modest. The narrative shifted dramatically in July 2025 with two major developments. First, the launch of Robinhood Chain, tailored for tokenized stocks, rapidly became a primary source of volume and fees for Uniswap, at one point contributing nearly half of its weekly fees. Second, governance votes successfully expanded the fee mechanism to v4 pools and initiated a temperature check for fees on Robinhood Chain. The activation of v4 fees caused the protocol's daily revenue earmarked for UNI burns to nearly triple. The core of UNI's recent price action is the transition from a pure governance token to a cash-flow asset with a permanent, protocol-funded buyer. Its effectiveness is amplified by UNI's mature and widely distributed supply, with no major impending unlocks to dilute the impact of the buybacks. The sustainability of this rally now hinges on whether the transaction volume, particularly on Robinhood Chain, persists after its initial gas subsidies expire, determining if this is a genuine value realization or a subsidy-fueled spike.

marsbitHá 2h

UNI Doubles in Two Months Against the Trend: A 5-Year-Overdue Value Realization

marsbitHá 2h

Breaking: Google Earth Urgently Pulls Back Nano Banana 2 Image Generation Feature!

Google Earth's newly launched "Create image" feature, powered by the Nano Banana 2 AI image generation model, was abruptly withdrawn shortly after its release due to being "played" by users. The feature allowed users to generate and overlay AI-created visuals directly onto real-world satellite and 3D maps in Google Earth. The tool enabled creative applications like historical recreations (e.g., visualizing ancient Pompeii), generating informational graphics for landmarks, and envisioning architectural projects or futuristic cityscapes on real terrain. It operated under "geospatial grounding," meaning the AI respected the underlying geography, topography, and perspective of the chosen map view. The model also integrated with Gemini to retrieve relevant factual information. However, upon release, users quickly tested its limits. A prominent example involved reimagining Philadelphia's historic Independence Hall as a post-apocalyptic ruin overrun by "happy" zombies, evil clowns, and giant alien mechs. This highlighted both the feature's playful potential and its risks regarding the generation of inappropriate or misleading content on realistic maps, leading to its swift temporary removal. Google stated it would re-release the feature after implementing "enhanced guardrails." Analysts note this move strategically leverages Google's vast proprietary geospatial data, positioning its AI not just for artistic generation but for spatially accurate world visualization—a unique advantage in the competitive AI image generation landscape.

marsbitHá 3h

Breaking: Google Earth Urgently Pulls Back Nano Banana 2 Image Generation Feature!

marsbitHá 3h

Trading

Spot

Artigos em Destaque

Como comprar BAND

Bem-vindo à HTX.com!Tornámos a compra de Band Protocol (BAND) simples e conveniente.Segue o nosso guia passo a passo para iniciar a tua jornada no mundo das criptos.Passo 1: cria a tua conta HTXUtiliza o teu e-mail ou número de telefone para te inscreveres numa conta gratuita na HTX.Desfruta de um processo de inscrição sem complicações e desbloqueia todas as funcionalidades.Obter a minha contaPasso 2: vai para Comprar Cripto e escolhe o teu método de pagamentoCartão de crédito/débito: usa o teu visa ou mastercard para comprar Band Protocol (BAND) instantaneamente.Saldo: usa os fundos da tua conta HTX para transacionar sem problemas.Terceiros: adicionamos métodos de pagamento populares, como Google Pay e Apple Pay, para aumentar a conveniência.P2P: transaciona diretamente com outros utilizadores na HTX.Mercado de balcão (OTC): oferecemos serviços personalizados e taxas de câmbio competitivas para os traders.Passo 3: armazena teu Band Protocol (BAND)Depois de comprar o teu Band Protocol (BAND), armazena-o na tua conta HTX.Alternativamente, podes enviá-lo para outro lugar através de transferência blockchain ou usá-lo para transacionar outras criptomoedas.Passo 4: transaciona Band Protocol (BAND)Transaciona facilmente Band Protocol (BAND) no mercado à vista da HTX.Acede simplesmente à tua conta, seleciona o teu par de trading, executa as tuas transações e monitoriza em tempo real.Oferecemos uma experiência de fácil utilização tanto para principiantes como para traders experientes.

176 Visualizações TotaisPublicado em {updateTime}Atualizado em 2026.06.02

Como comprar BAND

Discussões

Bem-vindo à Comunidade HTX. Aqui, pode manter-se informado sobre os mais recentes desenvolvimentos da plataforma e obter acesso a análises profissionais de mercado. As opiniões dos utilizadores sobre o preço de BAND (BAND) são apresentadas abaixo.

活动图片