Global Adoption Of Stablecoins Leaves US In The Dust—Report

bitcoinistPublicado em 2024-10-18Última atualização em 2024-10-18

Resumo

The US-based consumers' adoption of stablecoins is facing a slowdown in 2024 even when there is increasing activity in Bitcoin...

The US-based consumers’ adoption of stablecoins is facing a slowdown in 2024 even when there is increasing activity in Bitcoin that rose in popularity following the launch of the spot Bitcoin exchange-traded funds.

The graph below shows a decline in transactions by US-regulated platforms in just under a year. This can be attributed to the growing problem of US-based stablecoins in terms of regulation and adoption within the country.

This indicates that the stablecoins of emerging markets with bases outside the US are experiencing higher implementation. As stablecoins see increased use globally, this type of digital asset is being used to carry value and conduct cheap transactions in every nook and corner of the world.

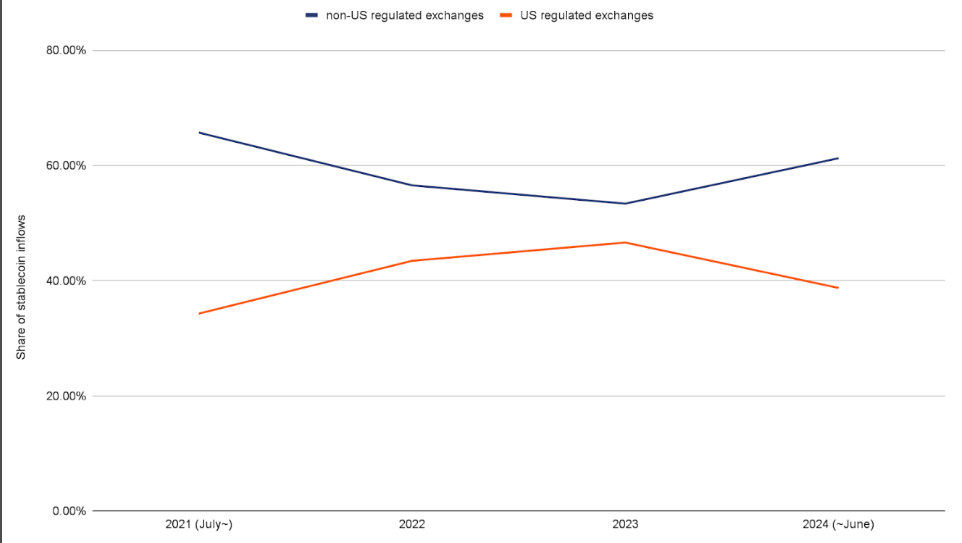
Share of stablecoin inflows to exchanges regulated in the United States and those not regulated in the US. Source: Chainalysis

Global Demand For US Dollar-Backed Assets

As countries aim for a more stable asset base, usually in the form of the dollar, stablecoins will help enhance global financial inclusion, especially in areas where there are few, if any, stable currencies. Such a need for reliable and well preserved assets will fuel the use of stablecoins.

As of today, the market cap of cryptocurrencies stood at $2.26 trillion. Chart: TradingView.com

As 2022 ended, It was observed about $1 trillion in US dollars had been found abroad, which approximately equals to about half of the entire US dollar supply which just further emphasizes how stablecoins are increasingly replacing dollar cash in markets where local currencies are prone to volatility.

Image: Built In

The results align with the words of Paolo Ardoino, the Tether CEO, who recently stated that stablecoin demand mainly comes from developing countries like Argentina, Turkey, and Vietnam. In such regions, people seek stablecoins for protection against inflation and currency erosion and, hence, are increasingly applying them as financial instruments for everyday operations and deposit purposes.

Stablecoins: Regulatory Challenges And The US Position

The lack of an appropriate framework for digital assets puts the United States at a competitive disadvantage; financial hubs in Europe and the United Arab Emirates attract stablecoin projects because of much friendlier regulatory environments. According to Chainalysis, it has been pointed out by companies like Circle that the lack of a US regulatory framework for stablecoins could present a threat to American interests.

More countries are coming forward to set clear guidelines that encourage the use of stablecoins and the US isn’t left behind in the call to action; Chainalysis deems it to be this gap in regulation that will likely ensure the country remains competitive within the emerging digital asset landscape, providing the catalyst on innovation within the stablecoin market.

Featured image from Pexels, chart from TradingView

Christian Encila

Christian Encila

Christian, a journalist and editor with leadership roles in Philippine and Canadian media, is fueled by his love for writing and cryptocurrency. Off-screen, he's a cook and cinephile who's constantly intrigued by the size of the universe.

Leituras Relacionadas

Annual Loss Rate Only 0.03%: Data Disassembles the Real Risk of DeFi Lending

DeFi lending's real-world annual loss rate from hacks and exploits is approximately 0.03% of the Total Value Locked (TVL), excluding cross-chain bridge incidents. This analysis, based on data from DeFi Llama, shows that while lending protocols are frequent targets due to their concentrated assets, the actual financial impact relative to the sector's massive scale is minimal. The overall DeFi hack total of $77.51B is heavily skewed by cross-chain bridge breaches. Removing those, losses drop to $45.18B, with lending and AMM protocols being the most affected non-bridge categories. Risk has significantly improved as the ecosystem has matured. For the year leading to May 2026, net losses in EVM and Solana lending protocols were $30.1 million against an average daily TVL of $99.6 billion, resulting in the 0.03% loss rate. Notably, the industry's asset recovery capability, exemplified by the full recovery and surplus from the Euler Finance hack, mitigates net losses, with a ~20% recovery rate for non-bridge lending incidents. Attack scale follows a log-normal distribution, meaning most incidents are small, and catastrophic losses are rare. This demonstrates that diversification across protocols is an effective risk mitigation strategy. The data indicates that DeFi lending has evolved into a measurable, compartmentalized, and relatively low-risk sector within the broader digital asset landscape.

marsbitHá 5m

Annual Loss Rate Only 0.03%: Data Disassembles the Real Risk of DeFi Lending

marsbitHá 5m

BTC on a Roller Coaster, HYPE Hits New Highs | Guest Analysis

**Market Analysis: BTC Volatility and HYPE's New Highs** This week, markets experienced significant volatility. Macro pressures intensified with a bond market sell-off, rising rate hike expectations, and oil surpassing $110. Bitcoin (BTC) broke below $78K and is currently testing a critical range. The core debate centers on the nature of BTC's rally from its February low: Is it the start of a new uptrend (Path 1: bullish) or merely a B-wave rally within a larger monthly corrective structure (Path 2: bearish)? The outcome of the battle in the $78,500-$79,500 zone is key this week. * **For BTC:** * **Mid-term:** Maintain a neutral, cash position. * **Short-term:** Two contingency plans with ≤30% position size and strict stop-losses: * **Plan A (Bearish):** Sell if price rebounds but faces resistance in the $78,500-$79,500 zone. * **Plan B (Bearish):** Sell if price convincingly breaks below the $73,500-$75,000 support. * A break above $90,000-$93,100 would strongly favor the bullish Path 1 scenario. * **For HYPE:** HYPE continues its independent rally, hitting new highs with over 10% gains this week. The trend remains bullish as long as price holds above the key support at $38.41. * **Short-term Strategies (≤30% position):** * **Plan A (Bullish):** Buy on a confirmed break above $45.76. * **Plan B (Bearish):** Sell short on a confirmed break below $45.76. * **Plan C (Bullish):** Buy on a pullback finding support near $38.41. **Trade Review:** Last week, a disciplined 1x leveraged BTC long trade at $79,812, based on model signals, was closed at $81,426 for a ~2.02% profit. **Important:** Market conditions change rapidly. This analysis is for informational purposes only and does not constitute investment advice. Trade with caution and proper risk management.

marsbitHá 1h

BTC on a Roller Coaster, HYPE Hits New Highs | Guest Analysis

marsbitHá 1h

Trading

Spot
Futuros
活动图片