Dogecoin Price To $10: Similar Patterns That Led To Previous Parabolic Breakout Have Reappeared

bitcoinistPublicado em 2024-10-18Última atualização em 2024-10-18

Resumo

The Dogecoin price is once again gearing up for a significant move to the upside. In a recent price analysis...

The Dogecoin price is once again gearing up for a significant move to the upside. In a recent price analysis of current price movement and previous price action, an analyst suggested Dogecoin is on track to repeat another parabolic run, potentially sending its price skyrocketing to $10.

Dogecoin Price Exhibiting Parabolic Pattern

Recent Dogecoin price movements have put the meme coin back in the spotlight, with a noticeable breakout over the past few days. The meme coin’s price increased to hit $0.129, its highest price point so far in October. This rally has allowed Dogecoin to outpace many other large market cap cryptocurrencies in both daily and weekly performance.

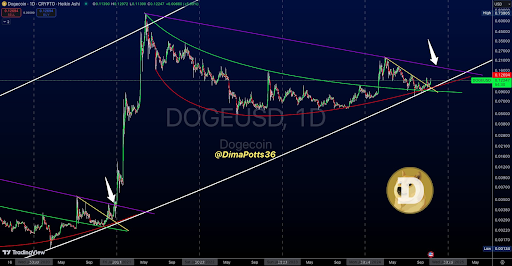
According to a price analysis posted on social media platform X, Dima James Potts noted that this recent breakout resembles the initial stages of Dogecoin’s parabolic breakout move in 2021. 

The daily candlestick timeframe chart shows the Dogecoin price broke above the upper trendline (yellow line) of a falling wedge in September. After briefly retesting this level during the first two weeks of October, it has since begun another upward climb. As Dima James Potts pointed out, this back-and-forth movement is similar to Dogecoin’s price action in January 2021 before it went on a parabolic run throughout the rest of the year until it peaked at its current all-time high of $0.7316.

Back then, the Dogecoin price broke above the upper trendline of a similar falling wedge on the daily candlestick timeframe chart, retested it, and then continued pushing up. If history were to repeat itself, this would lead to monumental gains for the Dogecoin price in the coming months.

Dogecoin
Source: X

What’s Next For Doge? A Move To $10?

The last time Dogecoin went on such a parabolic rally, it skyrocketed by over 16,000%. According to the analyst, Dogecoin is ready to repeat such a move, but it needs to close above $0.18 first. This $0.18 target represents a purple descending trendline drawn from Dogecoin’s all-time high, which has largely acted as resistance for the past few years.

Once the Dogecoin bulls are able to break above this trendline with a weekly close above $0.18, this would set the stage for massive upward moves, just like in the last cycle. This, in turn, would see Dogecoin breaking above its all-time high into new price territories. 

The analyst also speculates that Dogecoin could soar as high as $10 in this upcoming cycle, which would represent a monumental 8,110% increase from its current price. However, reaching such a lofty target would require a huge influx of capital from retail and institutional investors, far greater than the volume seen during the 2021 rally.

At the time of writing, the Dogecoin price is trading at $0.1228.

Dogecoin price chart from Tradingview.com
DOGE price still holding $0.12 | Source: DOGEUSDT on Tradingview.com
Featured image created with Dall.E, chart from Tradingview.com
Scott Matherson

Scott Matherson

Scott Matherson is a leading crypto writer at Bitcoinist, who possesses a sharp analytical mind and a deep understanding of the digital currency landscape. Scott has earned a reputation for delivering thought-provoking and well-researched articles that resonate with both newcomers and seasoned crypto enthusiasts. Outside of his writing, Scott is passionate about promoting crypto literacy and often works to educate the public on the potential of blockchain.

Leituras Relacionadas

Annual Loss Rate Only 0.03%: Data Disassembles the Real Risk of DeFi Lending

DeFi lending's real-world annual loss rate from hacks and exploits is approximately 0.03% of the Total Value Locked (TVL), excluding cross-chain bridge incidents. This analysis, based on data from DeFi Llama, shows that while lending protocols are frequent targets due to their concentrated assets, the actual financial impact relative to the sector's massive scale is minimal. The overall DeFi hack total of $77.51B is heavily skewed by cross-chain bridge breaches. Removing those, losses drop to $45.18B, with lending and AMM protocols being the most affected non-bridge categories. Risk has significantly improved as the ecosystem has matured. For the year leading to May 2026, net losses in EVM and Solana lending protocols were $30.1 million against an average daily TVL of $99.6 billion, resulting in the 0.03% loss rate. Notably, the industry's asset recovery capability, exemplified by the full recovery and surplus from the Euler Finance hack, mitigates net losses, with a ~20% recovery rate for non-bridge lending incidents. Attack scale follows a log-normal distribution, meaning most incidents are small, and catastrophic losses are rare. This demonstrates that diversification across protocols is an effective risk mitigation strategy. The data indicates that DeFi lending has evolved into a measurable, compartmentalized, and relatively low-risk sector within the broader digital asset landscape.

marsbitHá 8m

Annual Loss Rate Only 0.03%: Data Disassembles the Real Risk of DeFi Lending

marsbitHá 8m

BTC on a Roller Coaster, HYPE Hits New Highs | Guest Analysis

**Market Analysis: BTC Volatility and HYPE's New Highs** This week, markets experienced significant volatility. Macro pressures intensified with a bond market sell-off, rising rate hike expectations, and oil surpassing $110. Bitcoin (BTC) broke below $78K and is currently testing a critical range. The core debate centers on the nature of BTC's rally from its February low: Is it the start of a new uptrend (Path 1: bullish) or merely a B-wave rally within a larger monthly corrective structure (Path 2: bearish)? The outcome of the battle in the $78,500-$79,500 zone is key this week. * **For BTC:** * **Mid-term:** Maintain a neutral, cash position. * **Short-term:** Two contingency plans with ≤30% position size and strict stop-losses: * **Plan A (Bearish):** Sell if price rebounds but faces resistance in the $78,500-$79,500 zone. * **Plan B (Bearish):** Sell if price convincingly breaks below the $73,500-$75,000 support. * A break above $90,000-$93,100 would strongly favor the bullish Path 1 scenario. * **For HYPE:** HYPE continues its independent rally, hitting new highs with over 10% gains this week. The trend remains bullish as long as price holds above the key support at $38.41. * **Short-term Strategies (≤30% position):** * **Plan A (Bullish):** Buy on a confirmed break above $45.76. * **Plan B (Bearish):** Sell short on a confirmed break below $45.76. * **Plan C (Bullish):** Buy on a pullback finding support near $38.41. **Trade Review:** Last week, a disciplined 1x leveraged BTC long trade at $79,812, based on model signals, was closed at $81,426 for a ~2.02% profit. **Important:** Market conditions change rapidly. This analysis is for informational purposes only and does not constitute investment advice. Trade with caution and proper risk management.

marsbitHá 1h

BTC on a Roller Coaster, HYPE Hits New Highs | Guest Analysis

marsbitHá 1h

Trading

Spot
Futuros
活动图片