Coinbase + Glassnode: The Q3 Guide to Crypto Markets

insights.glassnodePublicado em 2024-07-24Última atualização em 2024-10-16

We are excited to release the third edition of our quarterly series, the 'Guide to Crypto Markets,' produced in collaboration with Coinbase Institutional. This report provides a thorough analysis of key developments in the crypto markets each quarter, including price performance, on-chain analytics, industry events, and derivatives data.

📄
Download your copy of the report here.

As with the previous issues of this guide, our goal is to provide institutional traders and investors with a better understanding of the digital asset market through actionable insights based on on-chain data. This edition focuses on three main insights: the rapid increase in on-chain activity, the transformative impact of ETFs, and an analysis of the current market cycle:

Key Highlights:

  • Gauging the Market Cycle: Crypto markets are known for their distinct cycles of gains and drawdowns. Recent data suggests that despite a second-quarter pullback, we are likely in the middle of the current bull cycle that began in late 2022. Historical patterns indicate that such corrections are typical and align with past market behaviors.
  • ETFs Have Altered the Landscape: Spot Bitcoin ETFs have amassed close to $50 billion in AUM within six months, attracting new investors and deepening market liquidity. ETFs have introduced a regulated, familiar investment vehicle that complements existing options, positively impacting the broader crypto ecosystem.
  • On-Chain Activity is Increasing Rapidly: Over the past six months, various metrics such as total value locked (TVL), active addresses, and user base size indicate a significant uptick in on-chain activity. This surge is driven by diverse use cases, including lending, staking, and trading. As existing use cases mature and new innovations emerge, on-chain adoption is expected to grow further.

Here are a few trends from the past quarter that are worth highlighting from an investor perspective:

MVRV Momentum is a tool that helps analysts monitor market trends by tracking the average unrealized profit multiple held by investors (MVRV) relative to its 365-day moving average.

Interactive chart explaining MVRV Momentum of ETH

When MVRV trades above its 365-day average, it typically indicates robust uptrends and improving investor profitability, often leading to increased positions during market corrections. Conversely, when MVRV falls below the 365-day average, it often signals significant unrealized losses, increasing uncertainty and risk-off decisions.

View live chart in Glassnode Studio

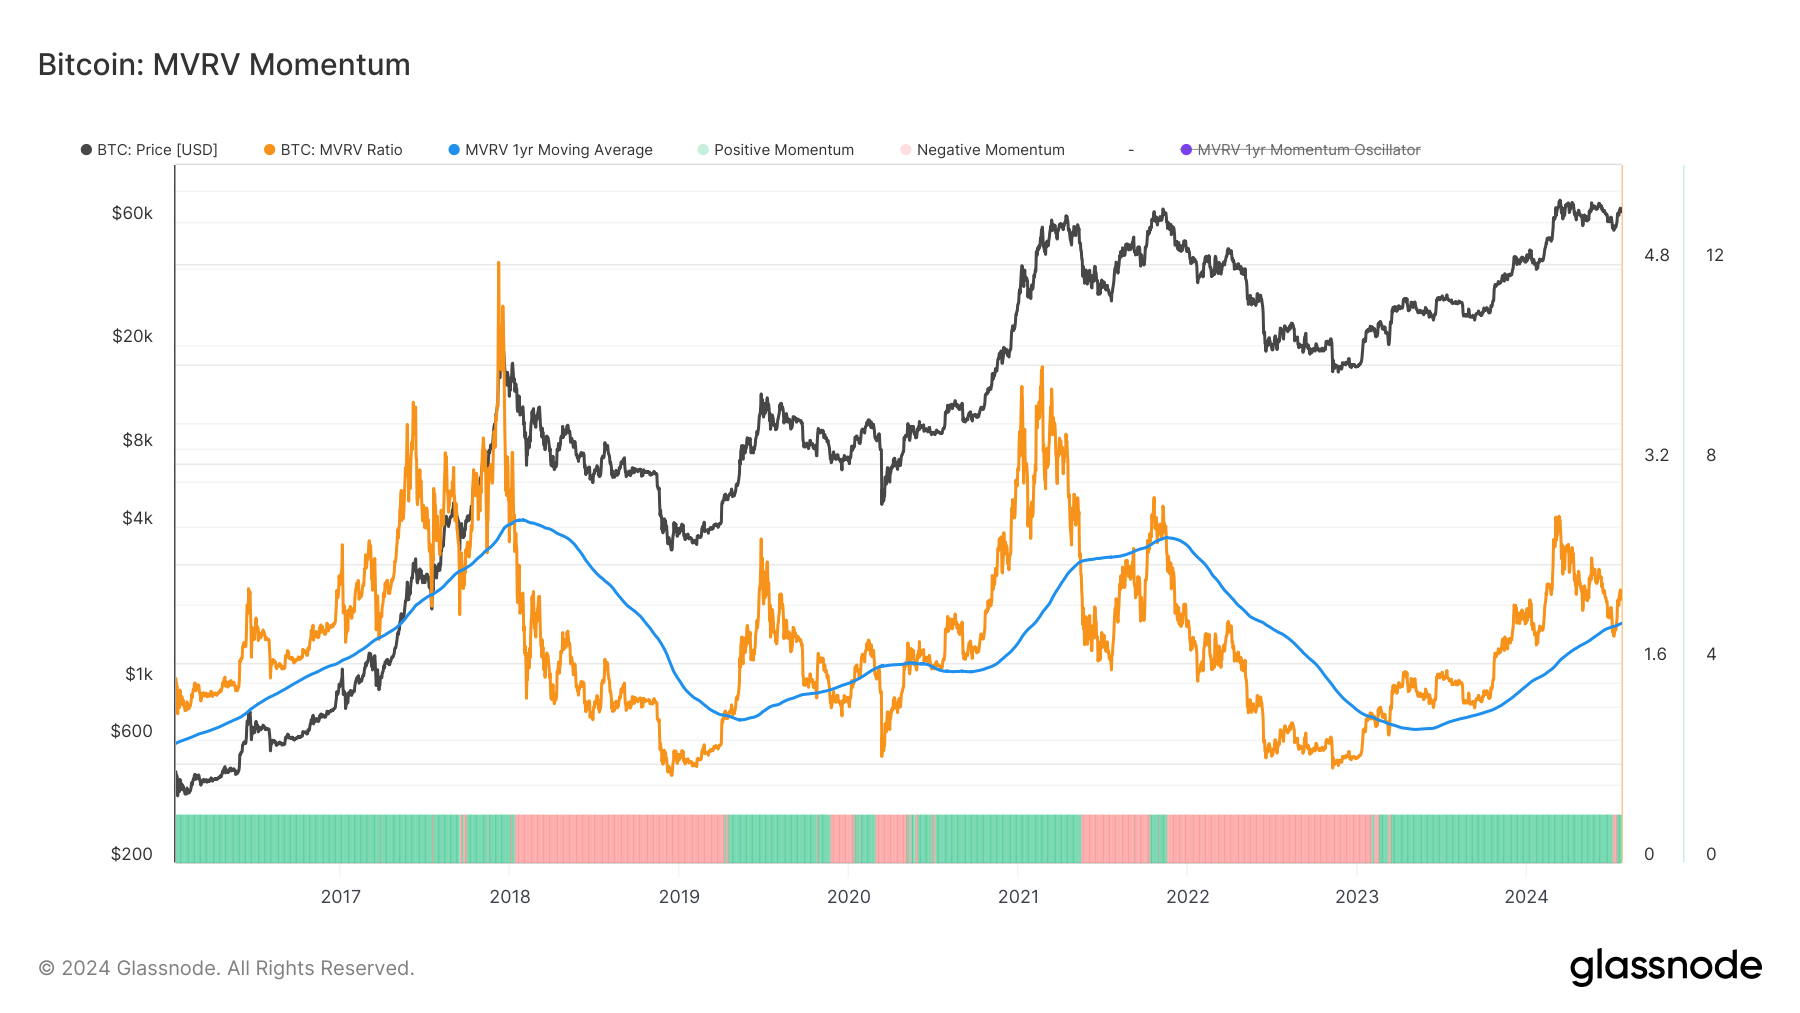
In early July, the MVRV ratio found support near its 365-day moving average, suggesting the 2024 uptrend remains intact with positive investor profitability.

BTC Cycle Performance and Drawdowns

View live chart in Glassnode Studio

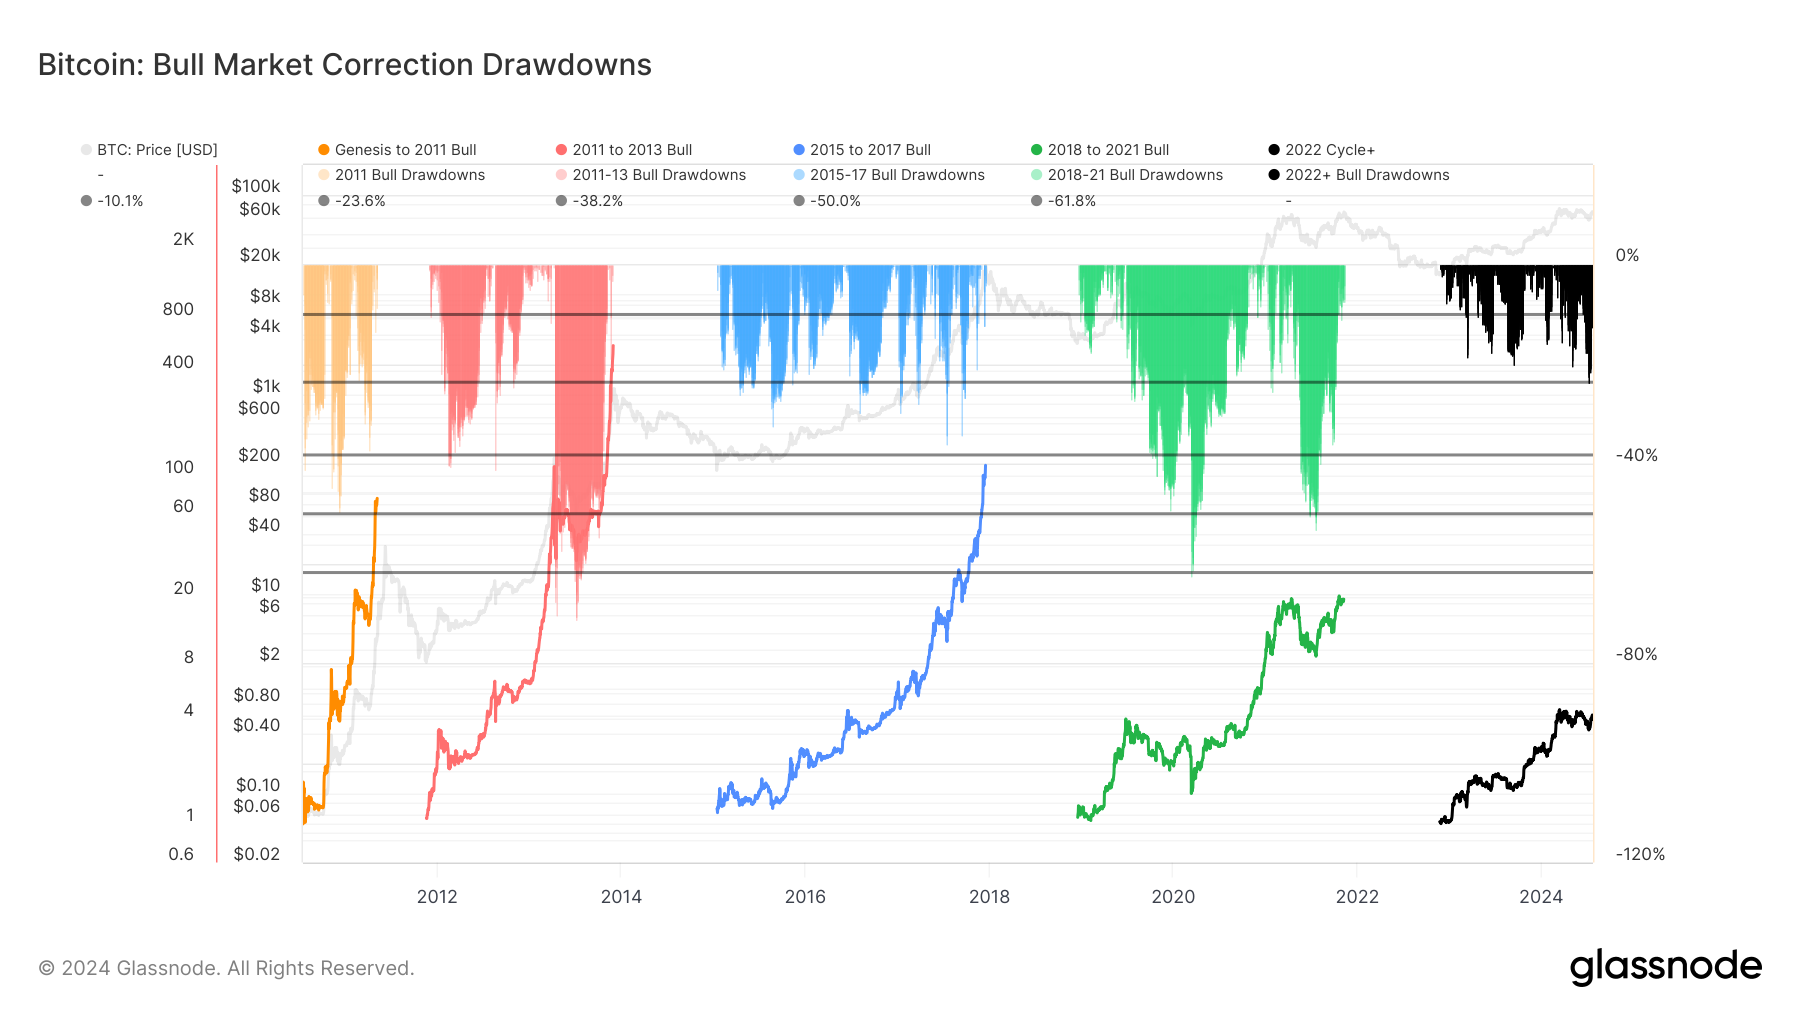
The current bull market, which began in late 2022, has seen Bitcoin prices increase by 400%. Following the collapse of FTX, Bitcoin experienced 18 months of steady price appreciation, reaching an ATH of $73k. Afterwards, the market entered a range-bound phase for three months, followed by a -26% drawdown.

Interactive chart explaining Bitcoin cycles

This downtrend is shallower compared to previous cycles, indicating a robust market structure and reduced volatility. The 2023-24 cycle mirrors the 2018-21 and 2015-17 cycles, providing valuable insights into cycle structure and duration.

BTC Spot ETF Balances

View live chart in Glassnode Studio

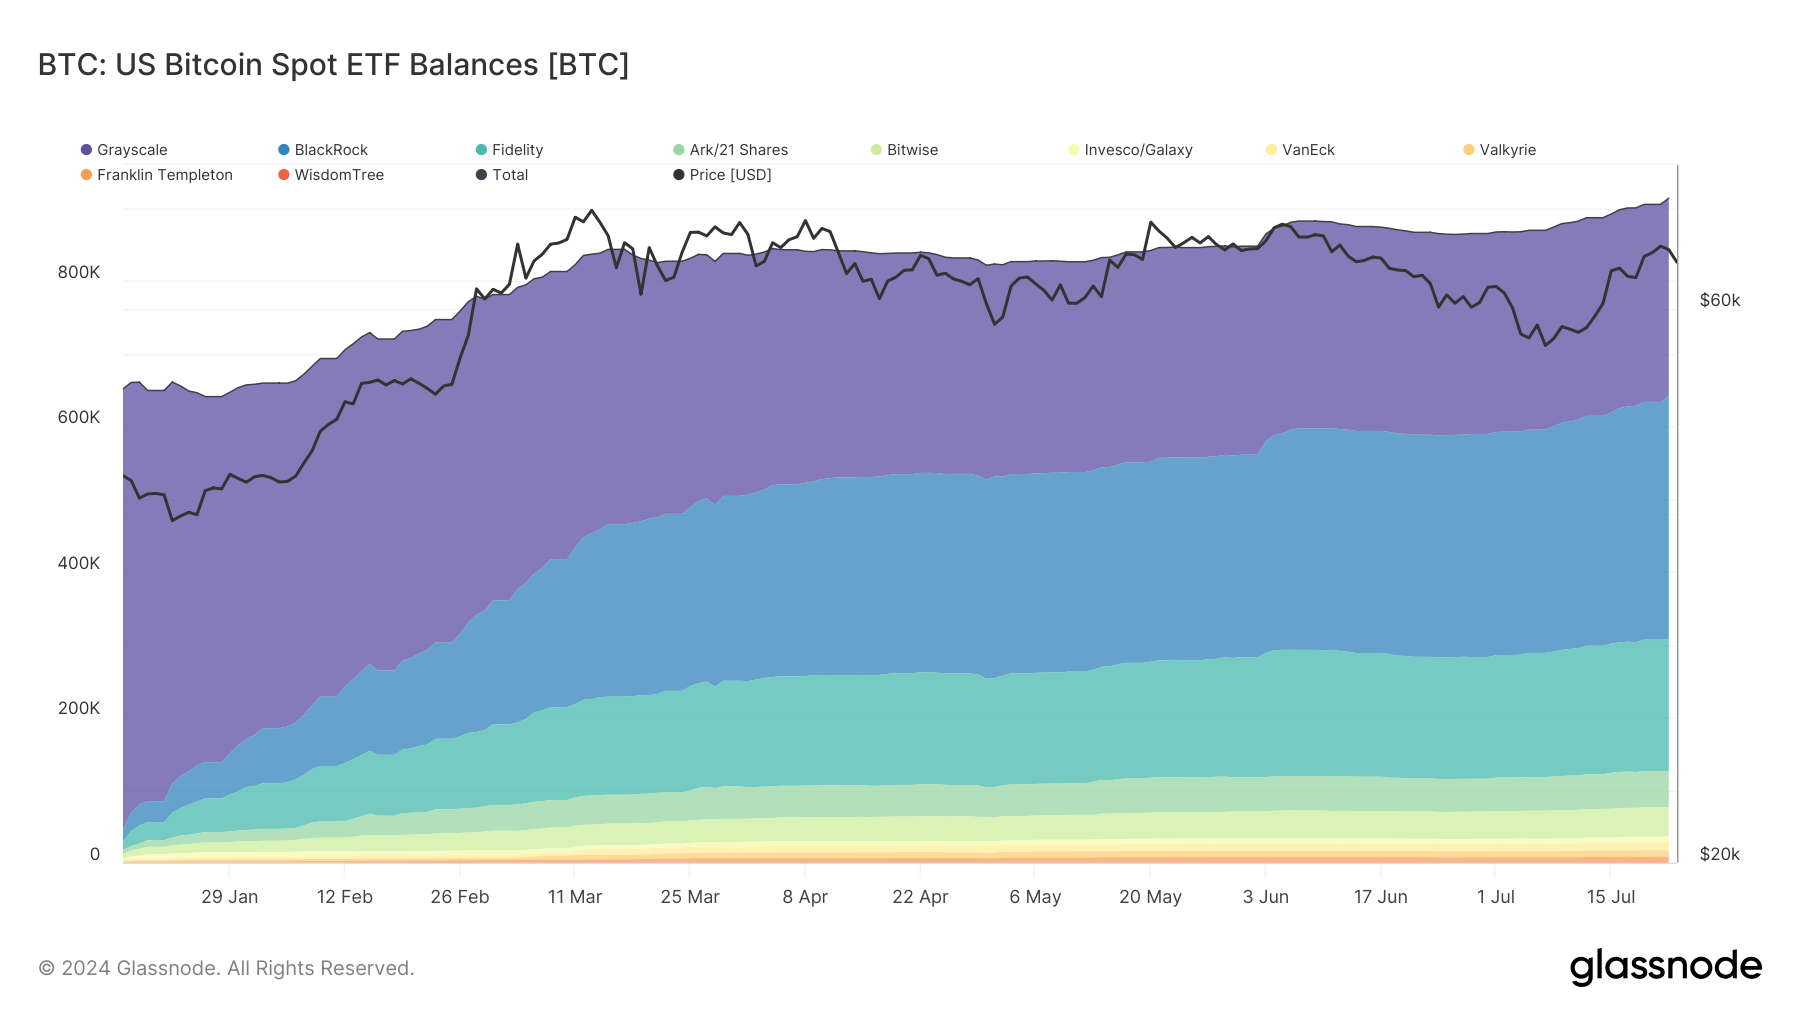
Tracking the balances of the top ten US-traded Bitcoin ETFs provides a view of the capital inflow into these products. Spot Bitcoin ETFs have seen unprecedented success, with over $50 billion in AUM, making them the most successful ETF launch in history.

Interactive chart comparing demand from BTC ETFs and new Bitcoin issuance from miners

Since their launch, ETF inflows have also significantly outpaced new Bitcoin issuance, creating substantial demand. This increased demand has driven up trading volumes in both spot and derivatives markets.

BTC Futures Volume and Open Interest

View live chart in Glassnode Studio

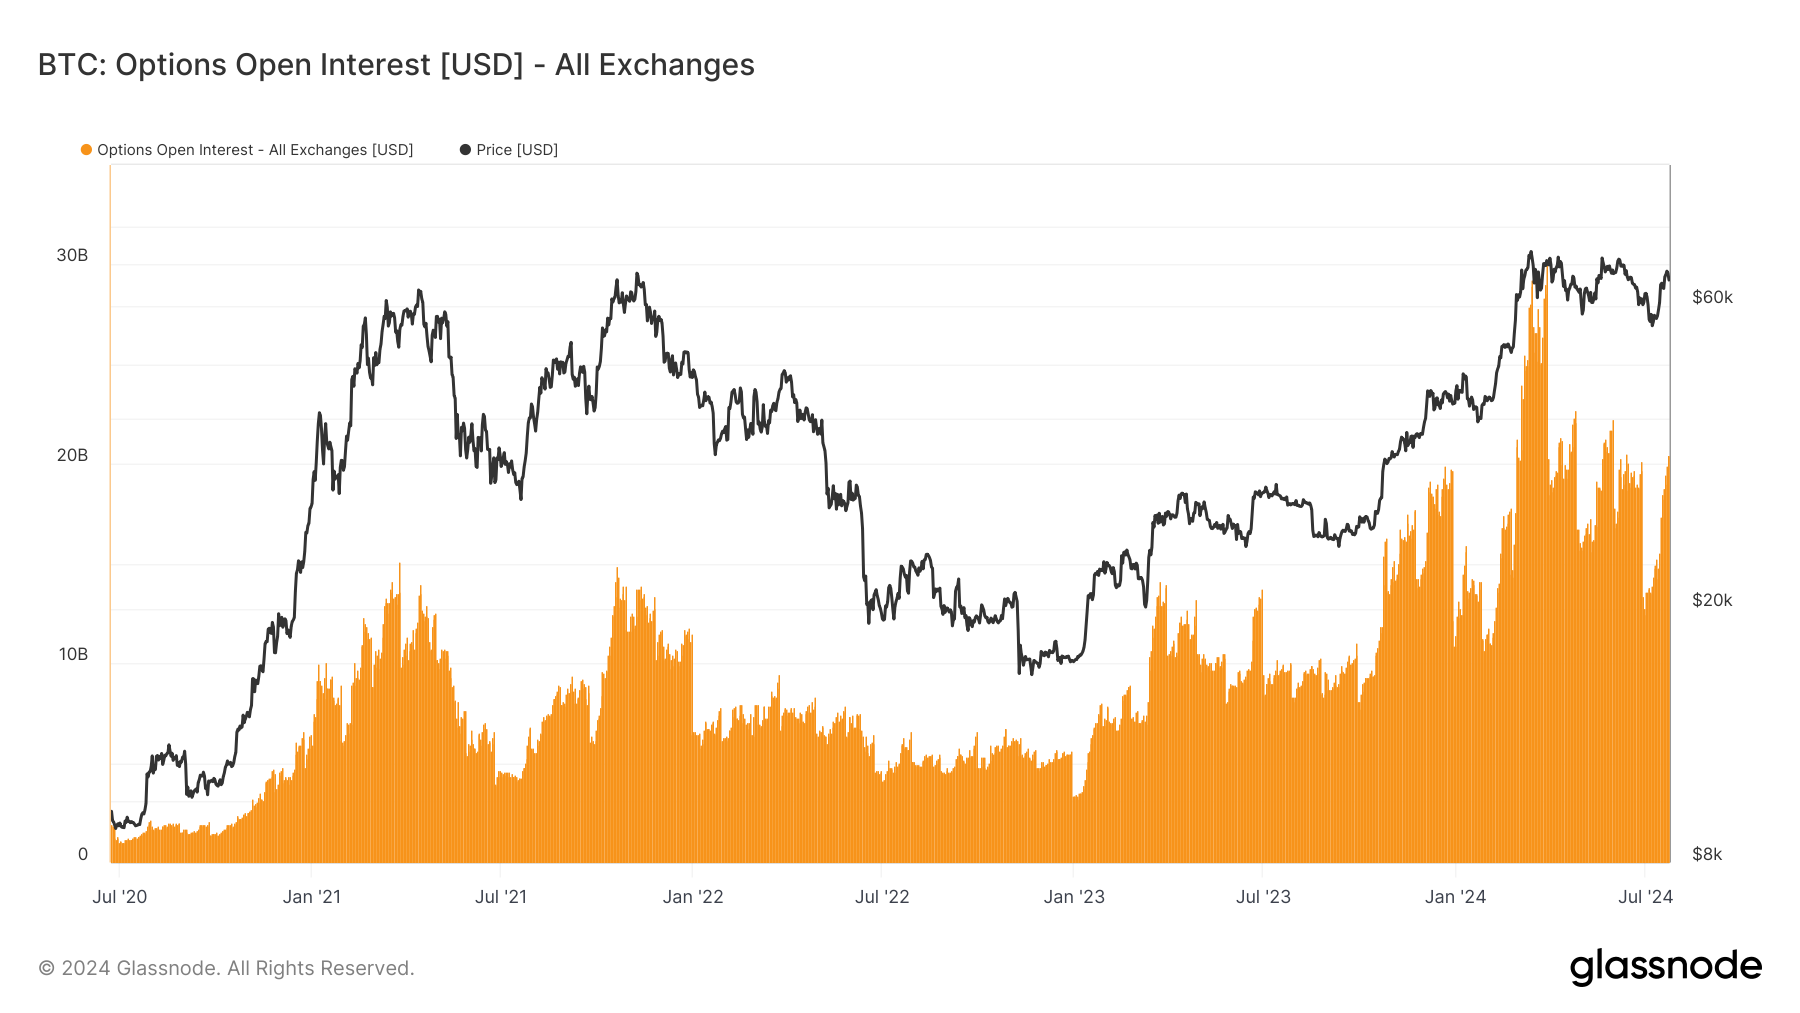
The trading volume and open interest in Bitcoin futures have risen substantially. Traditional futures and perpetual futures both show increased participation and liquidity, reflecting the growing interest in Bitcoin derivatives.

Interactive chart explaining trends in BTC futures

To explore these and other topics in depth and enhance your digital asset investment strategies, explore the full version of the Q3 2024 'Guide to Crypto Markets'.

Download the full report here.

Glassnode remains committed to providing the highest quality data and analysis to support institutional investors in the world of digital assets. Contact us for bespoke reports, data services, and more. For more reports on the current trends in the crypto markets, please visit our Insights blog.

Leituras Relacionadas

STRC 跌破面值,比特币财库实验进入下半场

The price of STRC, Strategy's dividend-paying preferred stock, has fallen below its $100 face value, triggering a re-evaluation of the "bitcoin treasury" corporate model. This highlights a critical tension: the company's asset base consists of high-volatility, non-cash-flow-generating Bitcoin, while its capital structure requires continuous cash payouts for dividends and interest. The decline of STRC signals that market pressure is shifting from asset price volatility to the pricing of the company's financing tools. Strategy's core model involves a three-step conversion: turning equity into Bitcoin exposure, converting Bitcoin holdings into capital market credit, and packaging non-yielding BTC into cash-paying securities like STRC. While Strategy holds a massive 847,363 BTC, the focus is now on cash flow mismatches. The company faces annual preferred stock dividend obligations of approximately $1.7 billion, far exceeding the cash flow from its legacy software business. Its ability to meet these obligations relies on continued access to capital markets. The market is now scrutinizing which of three potential costs becomes untenable first: rising dividend costs to attract investors, dilution costs from issuing more common stock, or the reputational cost of selling BTC—a move contrary to its "hodl" narrative. For the broader crypto market, a constrained Strategy means the potential loss of a predictable, narrative-driven marginal buyer for Bitcoin. The STRC discount serves as a reminder that the longevity of such models depends not just on Bitcoin's price, but also on financing windows, cash reserves, and investor willingness to pay a "trust premium" for the structure.

marsbitHá 24m

STRC 跌破面值,比特币财库实验进入下半场

marsbitHá 24m

Standard Chartered Bank’s 50-Fold Fantasy: Predicting AAVE to Reach $3,500

Standard Chartered Bank has issued an optimistic research report predicting that the AAVE token could surge 50-fold to $3,500 by 2030. This forecast is based on the projection that the total value locked (TVL) in DeFi will grow 37x to approximately $2.7 trillion, driven by stablecoin expansion and the tokenization of real-world assets (RWA). The bank's model links Aave's potential valuation directly to its protocol revenue, which is primarily driven by net interest margins. The report highlights Aave's current dominant position, noting it captures over 80% of the net earnings ("protocol retained earnings") in the lending sector while holding only about half of its TVL. It also points to the recent launch of the Aave V4 architecture and a healthy revenue stream of $142 million in 2025 as positive fundamentals. Grayscale's separate analysis, applying traditional valuation metrics like DCF, concluded AAVE is currently undervalued. However, the article notes significant challenges. Aave's peer-to-pool lending model suffers from inherent capital inefficiency, with an estimated $52 million annual "deadweight loss" due to idle funds needed for liquidity buffers. This structural flaw was exposed during the April KelpDAO exploit, which locked a WETH pool at 100% utilization for days. Emerging protocols like Morpho, with more efficient point-to-point models, are cited as growing competitive threats. In summary, while institutional forecasts paint a macro picture of massive growth fueled by RWA adoption, Aave's path forward hinges on addressing its core structural limitations and competitive pressures within the evolving DeFi lending landscape.

链捕手Há 1h

Standard Chartered Bank’s 50-Fold Fantasy: Predicting AAVE to Reach $3,500

链捕手Há 1h

Tidal Investment: We Remain Bullish on the AI Industry Chain, But the Reasons Have Changed

Tidal Investment remains optimistic about the AI industry chain, but the rationale has shifted. The market narrative has changed. While recent large-scale IPOs (e.g., SpaceX) and major fundraising plans by tech giants like Alphabet and Meta have caused some nervousness, this isn't a sign of an AI peak. The focus has moved from the initial question of AI's viability to the sustainability of massive investment cycles. The key players—primarily the major cloud providers—are not slowing down; their capital expenditure (Capex) guidance for 2026 has been increased across the board (e.g., Alphabet to $180B, Amazon to $200B). This investment cycle is proving resilient and difficult to stop. Unlike traditional hardware cycles, current AI Capex is distributed across multiple physical layers—computing, memory, networking, and critically, power infrastructure. Bottlenecks are shifting from chips to elements like electricity, transformers, and cooling systems, which have much longer lead times and cannot be easily pre-built like fiber optics during the dot-com bubble. Supply chain data (e.g., Eaton's 240% YoY data center orders) confirms this broad-based, project-driven expansion. Market concerns are acknowledged but viewed differently. First, while Capex growth currently outpaces revenue growth, raising ROI questions, this mirrors the early scaling phase of cloud computing itself. A change in view would require concrete signals like downward Capex revisions or missed AI product targets, which haven't materialized by mid-2026. Second, comparisons to the 2000 dot-com bust are flawed. That crash was driven by a massive, parallel oversupply of cheap capacity (fiber). The current cycle faces *supply constraints* in critical, capital-intensive physical infrastructure that cannot be overbuilt as easily. In conclusion, the wave of fundraising reflects the next, more complex act of the AI story. Physical bottlenecks and sustained high Capex plans suggest this is not the finale but an ongoing, capital-intensive build-out phase. The script has changed, but the play is far from over.

marsbitHá 2h

Tidal Investment: We Remain Bullish on the AI Industry Chain, But the Reasons Have Changed

marsbitHá 2h

Tidal Investment: We Remain Bullish on the AI Industry Chain, But for Different Reasons Now

Tidal Investments remains optimistic about the AI industry chain, but the rationale has shifted. The market is concerned about massive concurrent fundraising by tech giants like SpaceX, OpenAI, Alphabet, and Meta, fearing an AI peak. However, the authors argue this signals the next act of AI development, not its end. Capital expenditure (Capex) from major cloud providers (Alphabet, Amazon, Meta, Microsoft, Oracle) continues to surge aggressively into 2026. This investment cycle is more resilient than past hardware cycles due to its scale and complexity. Bottlenecks have shifted from chips to critical physical infrastructure like power grids, transformers, cooling, and data center construction—areas with long lead times and limited capacity for rapid expansion. Supply chain data (e.g., Eaton's orders) confirms substantial, tangible progress. Key market concerns are addressed: 1. **ROI vs. Capex Growth**: While Capex growth outpaces revenue, the authors note cloud giants have historically overcome similar phases through scale. The cycle will only be in danger if Capex guidance is cut, orders are canceled, or AI product demand falters—none of which are currently observed. 2. **Comparison to the 2000 Dot-com Bubble**: Unlike the telecom bubble, where cheap, oversupplied fiber crashed prices, AI infrastructure (especially power) is constrained, customized, and subject to lengthy approvals, making a similar supply glut and crash unlikely. In conclusion, the wave of fundraising reflects the immense, ongoing capital needs for AI's next phase, constrained by slow-moving physical bottlenecks. The AI cycle is not over; the script has simply changed.

链捕手Há 2h

Tidal Investment: We Remain Bullish on the AI Industry Chain, But for Different Reasons Now

链捕手Há 2h

Trading

Spot
Futuros
活动图片