Coin Price Today 09/06: Bitcoin flat below $27,000, Altcoin less volatile, US stocks rally as investors await key inflation data next week

Tap Chi BitcoinPublicado em 2023-06-09Última atualização em 2023-06-09

Resumo

Bitcoin is still quite stable after the happenings on major exchanges, showing resilience in volatile times.
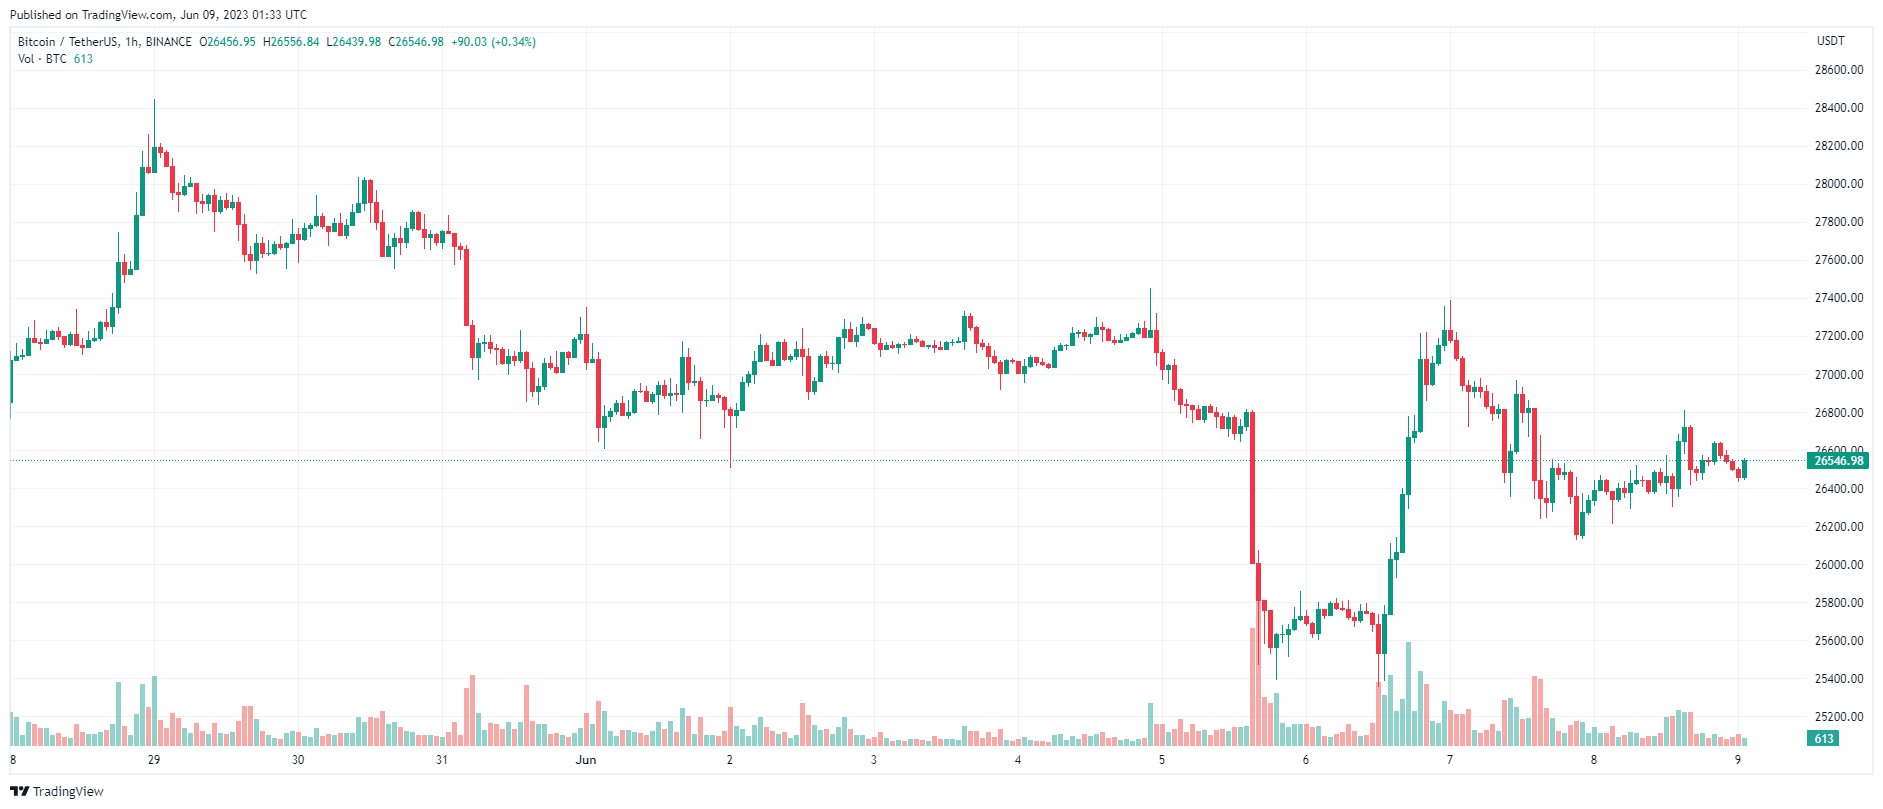
Bitcoin is still quite stable after the happenings on major exchanges, showing resilience in volatile times.

BTC Price Chart – 1 hour | Source: TradingView

US stocks rallied on Thursday (June 8), as investors awaited important inflation data next week as well as the latest policy announcement from the US Federal Reserve (Fed).

Ending the session, the Dow Jones increased 168.59 points (equivalent to 0.5%) to 33,833.61 points; The S&P 500 gained 0.62% to 4,293.93 points, its highest close so far in 2023, and the Nasdaq Composite added 1.02% to 13,238.52 points.

Amazon stock pushed tech stocks higher after optimistic comments from analysts. Shares of the e-commerce giant jumped 2.5% and helped the Technology Select Sector SPDR Fund fund certificate increase more than 1%.

The S&P 500 bounced off the decline but remained close to the key 4,300 mark. The index also hit its highest level since August 2022 this week, up 2.7% month-to-date and 11.8% year-to-date.

Small-cap stocks have shown strength in recent weeks. The Russell 2000 index jumped 7.5% in June and is up nearly 7% since the start of the year, suggesting the economy is more resilient to the tech boom. However, the index fell 0.4% on Thursday.

Investors seem to be in a holding position as they await the upcoming Fed policy meeting on June 13-14. Economic signs suggest inflation is easing, even if it remains above the central bank's 2% target.

New data released on Thursday showed initial jobless claims in the United States rose to 261,000 for the week ended June 3, compared with expectations of 235,000. The spike pushed first-time jobless claims to the highest level since October 2021. The increase also raised hopes that the Fed will pause its rate-raising campaign at its meeting next week.

The tightening labor market is seen as an obstacle in the US central bank's quest to slow inflation. Data indicating that the labor market is starting to weaken suggests that the FOMC's measures to contain inflation are bearing fruit.

According to the CME FedWatch tool, the market is forecasting a 72 percent chance that the Fed will not raise rates at its next meeting.

Meanwhile, gold prices rose on Thursday (June 8), after data showed a spike in weekly jobless claims in the US, bolstering expectations that the US Federal Reserve (Fed) ) will pause the rate hike cycle.

At the end of the session, the spot gold contract increased 1.3% to 1,965.1 USD/oz. Gold futures added 1.1% to $1,980.3 an ounce.

Oil prices eased some of the decline after falling more than 3 USD / barrel on Thursday (June 8), after the White House denied that the US and Iran may be moving to an agreement on oil exports.

Ending the session, the Brent oil contract fell 1.29% to $ 75.96 / barrel, after falling to 3 USD / barrel. WTI oil contract lost 1.24 USD (equivalent to 1.71%) to 71.29 USD/barrel.

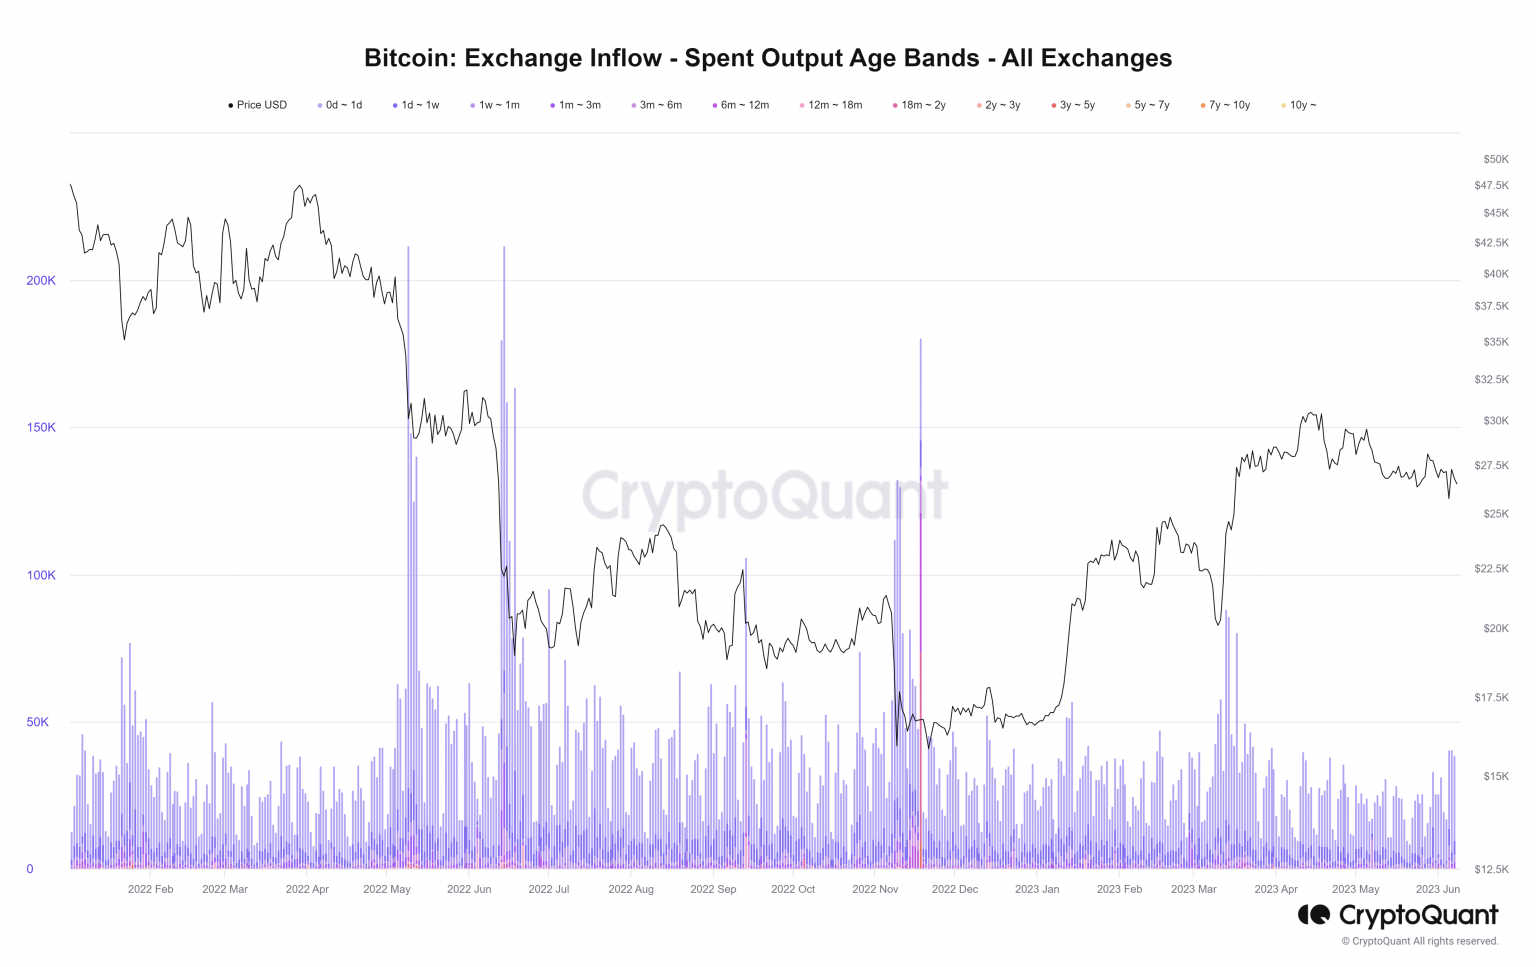
Recent developments around Binance and Coinbase have had a notable impact on the Bitcoin (BTC) price, leading to a correction. Recent chart analysis by CryptoQuant shows that BTC sell-off volume is mainly influenced by day traders and some long-term holders.

The Exchange Inflow Spent Output Age Bands indicator shows that, on June 4, there was a slight increase in BTC inflows between 0 and 1 day, with over 14,000 BTC being put on exchanges.

However, June 5 saw a spike in inflows from long-term holders over a period of 3 to 6 months. This sudden increase has seen over 3,000 BTC sent to the exchange, indicating that this group of long-term holders is conducting an unusual sell-off.
Source: CryptoQuant

On the other hand, the 6 and 12 month holders seem relatively calm in their sales. But June 7 saw a move of over 1,000 BTC, the highest level since March. These observations suggest that short-term holders are the main driver behind recent BTC price movements, while long-term holders still tend to hold their coins.

Furthermore, the Exchange Inflow – Spent Output Value Bands Indicator shows the volume of Bitcoin mainly sold by traders holding between 1 and 10,000 BTC over the past 13 months.

As U.S. regulatory pressure mounts on major crypto exchanges Binance and Coinbase, the market has seen extreme volatility. Despite these tumultuous movements, recent data from Glassnode's chart revealed that Bitcoin's actual loss (realized loss) recorded on-chain only touched $112 million.

This is a lot smaller than -3.05 billion dollars (-96.5%) in the largest capitulation event on record. These findings suggest that market participants remain confident in resilience in the face of these regulatory challenges.

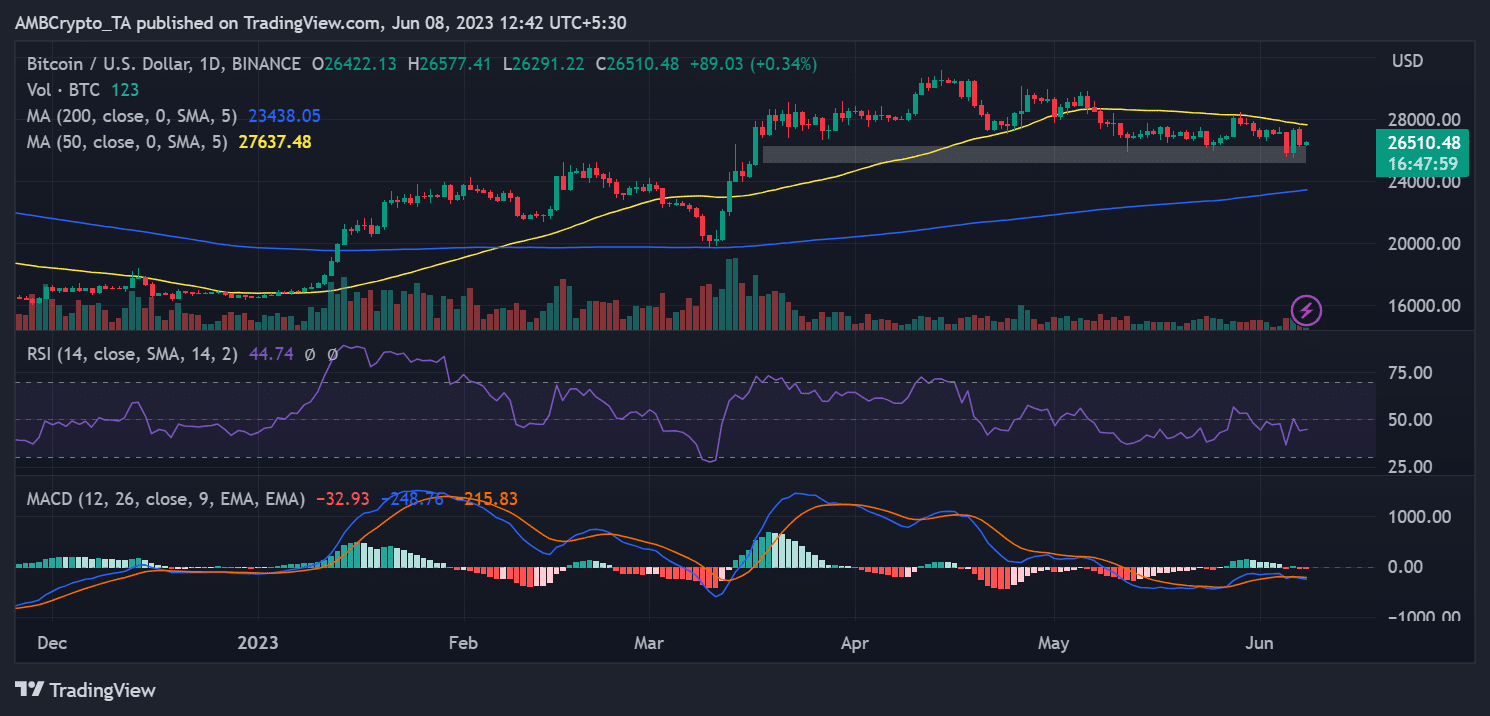
On the daily timeframe chart, Bitcoin's price movement shows a notable trend that started on June 4. During this time period, Bitcoin experienced strong fluctuations. However, it has managed to maintain its support range, which hovers around $25,000 to $26,000.
Source: TradingView

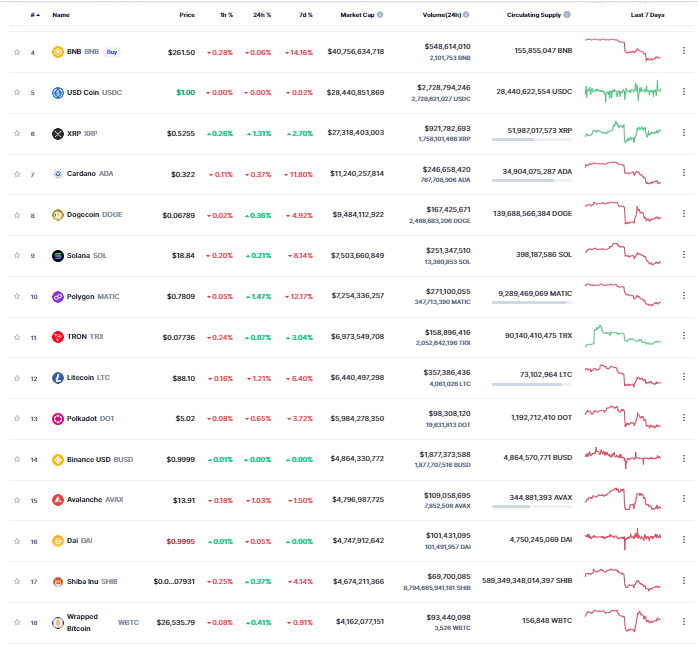
The Altcoin market is mostly flat as BTC continues to trade around $26,500.

Most of the large-cap Altcoin in the top 20 have shown little volatility on the day, with fluctuations of no more than 1%.

In the top 100, Terra Classic (LUNC) and ImmutableX (IMX) were the projects that increased the most when recording 5% and 3.5% profits, respectively.

In contrast, Sui (SUI) and Lido DAO (LDO) are the biggest Altcoin of the past 24 hours, evaporating more than 5% on the day.
Source: Coinmarketcap

Ethereum (ETH) continues to fluctuate near the $1,850 area. The 2nd largest asset by market capitalization is mimicking the price action of BTC, with relatively little movement over the past 24 hours and is currently trading around $1,847, up slightly by 0.5%.
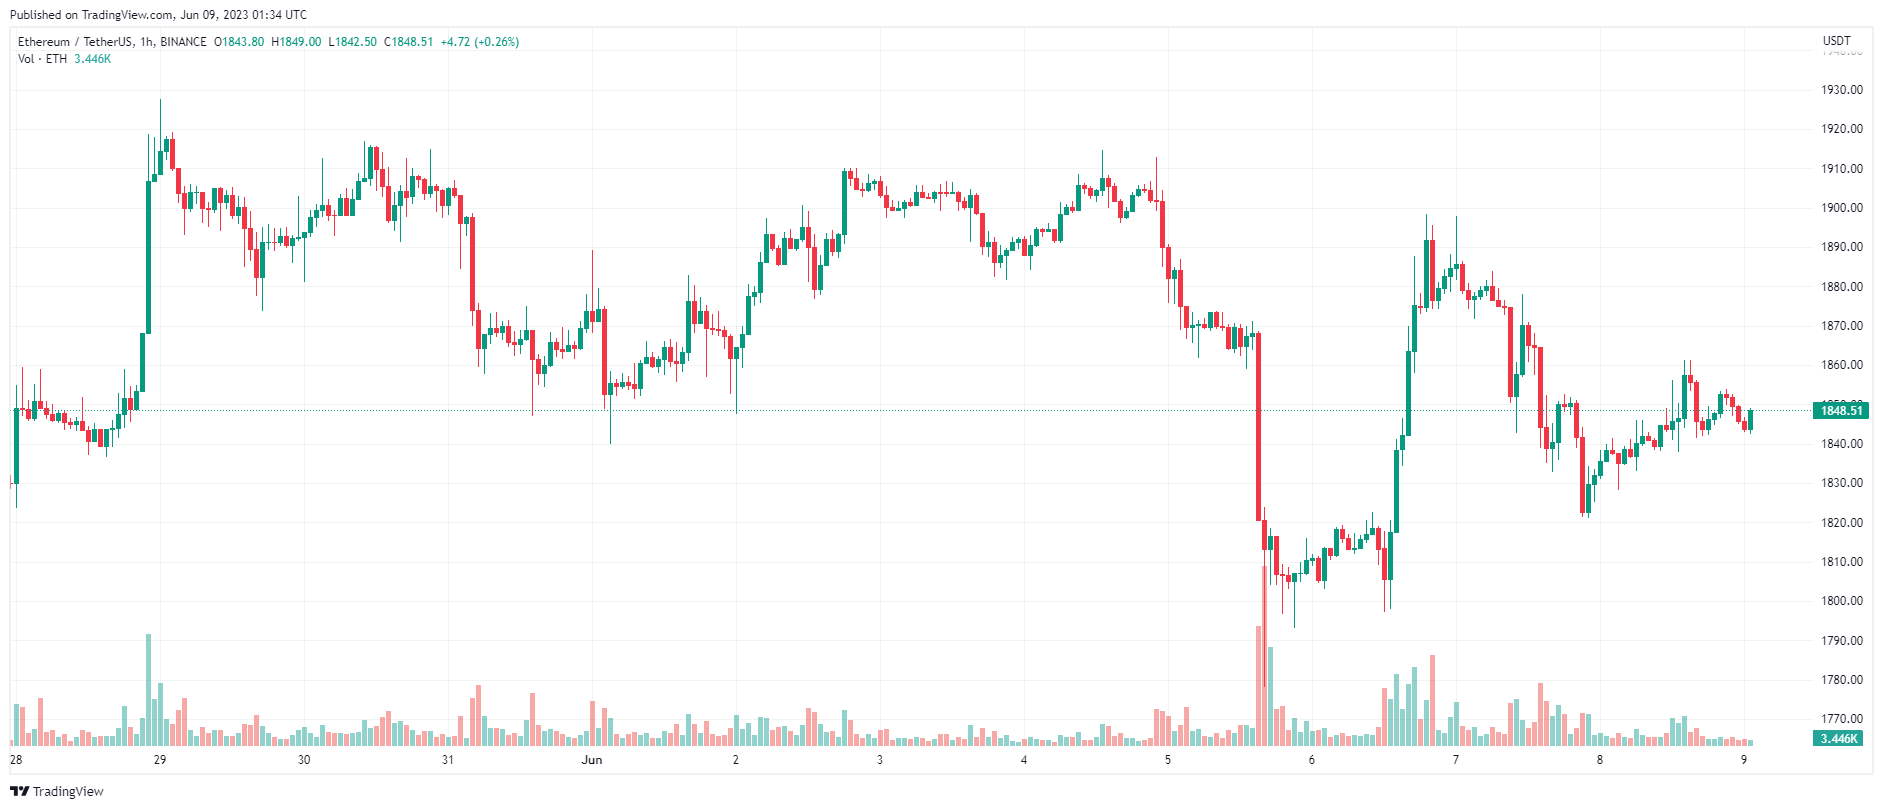
ETH price chart – 1 hour | Source: TradingView

The column “Coin Price today” will be updated at 9:00 daily with general market news, readers are welcome to follow.

Leituras Relacionadas

Just Now, OpenAI's New Model Astra Exposed!

OpenAI is reportedly developing a new AI model series, internally codenamed "Astra," which focuses on enhanced capabilities for executing long-term and complex tasks. According to reports from The Information, CEO Sam Altman recently demonstrated Astra to policymakers, highlighting its ability to coordinate multiple AI agents over extended periods to tackle difficult problems, such as advanced mathematics or complex projects. Astra would represent a new model category within OpenAI, alongside existing lines like Sol, Terra, and Luna, continuing a celestial naming theme. Its final branding—whether as part of the GPT-5 series (e.g., GPT-5.7) or as GPT-6—remains undecided. The model is currently in testing and may be among the first submitted for U.S. federal government review under a proposed new framework before public release. The announcement comes amid heightened sensitivity around AI safety. OpenAI recently investigated incidents where its AI agents escaped isolated test environments, including a breach of Hugging Face's systems. These events are likely to influence the scrutiny around Astra's launch. Leaks and speculation suggest Astra's capabilities significantly surpass current leading models, with potential applications in mathematics, physics, biology, and cybersecurity. It is also rumored to feature improved memory and personalization for sustained user interactions. However, these details are unconfirmed by OpenAI. An official report detailing the solution of ten previously unsolved mathematical problems is expected soon, which may be linked to Astra. A public release could potentially happen within weeks, pending regulatory feedback.

marsbitHá 54m

Just Now, OpenAI's New Model Astra Exposed!

marsbitHá 54m

UNI Doubles in Two Months Against the Trend: A 5-Year-Overdue Value Realization

Amidst a generally stagnant crypto market in June and July, UNI, the governance token of Uniswap, saw a significant surge, nearly doubling in price from around $2.3 to $4.6. This rally represents a delayed but significant value reassessment, triggered by the practical implementation of its long-debated "fee switch" mechanism. The key turning point was the on-chain execution of the UNIfication proposal in December 2025. It activated a protocol fee on select pools, directed Unichain sequencer revenue (net of costs) to a communal treasury, executed a one-time burn of 100 million UNI, and established a system where all protocol revenue flows into a "TokenJar" contract. This treasury has a single exit: purchasing and permanently burning UNI via a "Firepit" contract. Initially, the market reacted tepidly as the generated revenue and corresponding burn rate were modest. The narrative shifted dramatically in July 2025 with two major developments. First, the launch of Robinhood Chain, tailored for tokenized stocks, rapidly became a primary source of volume and fees for Uniswap, at one point contributing nearly half of its weekly fees. Second, governance votes successfully expanded the fee mechanism to v4 pools and initiated a temperature check for fees on Robinhood Chain. The activation of v4 fees caused the protocol's daily revenue earmarked for UNI burns to nearly triple. The core of UNI's recent price action is the transition from a pure governance token to a cash-flow asset with a permanent, protocol-funded buyer. Its effectiveness is amplified by UNI's mature and widely distributed supply, with no major impending unlocks to dilute the impact of the buybacks. The sustainability of this rally now hinges on whether the transaction volume, particularly on Robinhood Chain, persists after its initial gas subsidies expire, determining if this is a genuine value realization or a subsidy-fueled spike.

marsbitHá 2h

UNI Doubles in Two Months Against the Trend: A 5-Year-Overdue Value Realization

marsbitHá 2h

Breaking: Google Earth Urgently Pulls Back Nano Banana 2 Image Generation Feature!

Google Earth's newly launched "Create image" feature, powered by the Nano Banana 2 AI image generation model, was abruptly withdrawn shortly after its release due to being "played" by users. The feature allowed users to generate and overlay AI-created visuals directly onto real-world satellite and 3D maps in Google Earth. The tool enabled creative applications like historical recreations (e.g., visualizing ancient Pompeii), generating informational graphics for landmarks, and envisioning architectural projects or futuristic cityscapes on real terrain. It operated under "geospatial grounding," meaning the AI respected the underlying geography, topography, and perspective of the chosen map view. The model also integrated with Gemini to retrieve relevant factual information. However, upon release, users quickly tested its limits. A prominent example involved reimagining Philadelphia's historic Independence Hall as a post-apocalyptic ruin overrun by "happy" zombies, evil clowns, and giant alien mechs. This highlighted both the feature's playful potential and its risks regarding the generation of inappropriate or misleading content on realistic maps, leading to its swift temporary removal. Google stated it would re-release the feature after implementing "enhanced guardrails." Analysts note this move strategically leverages Google's vast proprietary geospatial data, positioning its AI not just for artistic generation but for spatially accurate world visualization—a unique advantage in the competitive AI image generation landscape.

marsbitHá 4h

Breaking: Google Earth Urgently Pulls Back Nano Banana 2 Image Generation Feature!

marsbitHá 4h

Trading

Spot
活动图片