Bitcoin plummeted on May 24 as the market retested key trendlines.
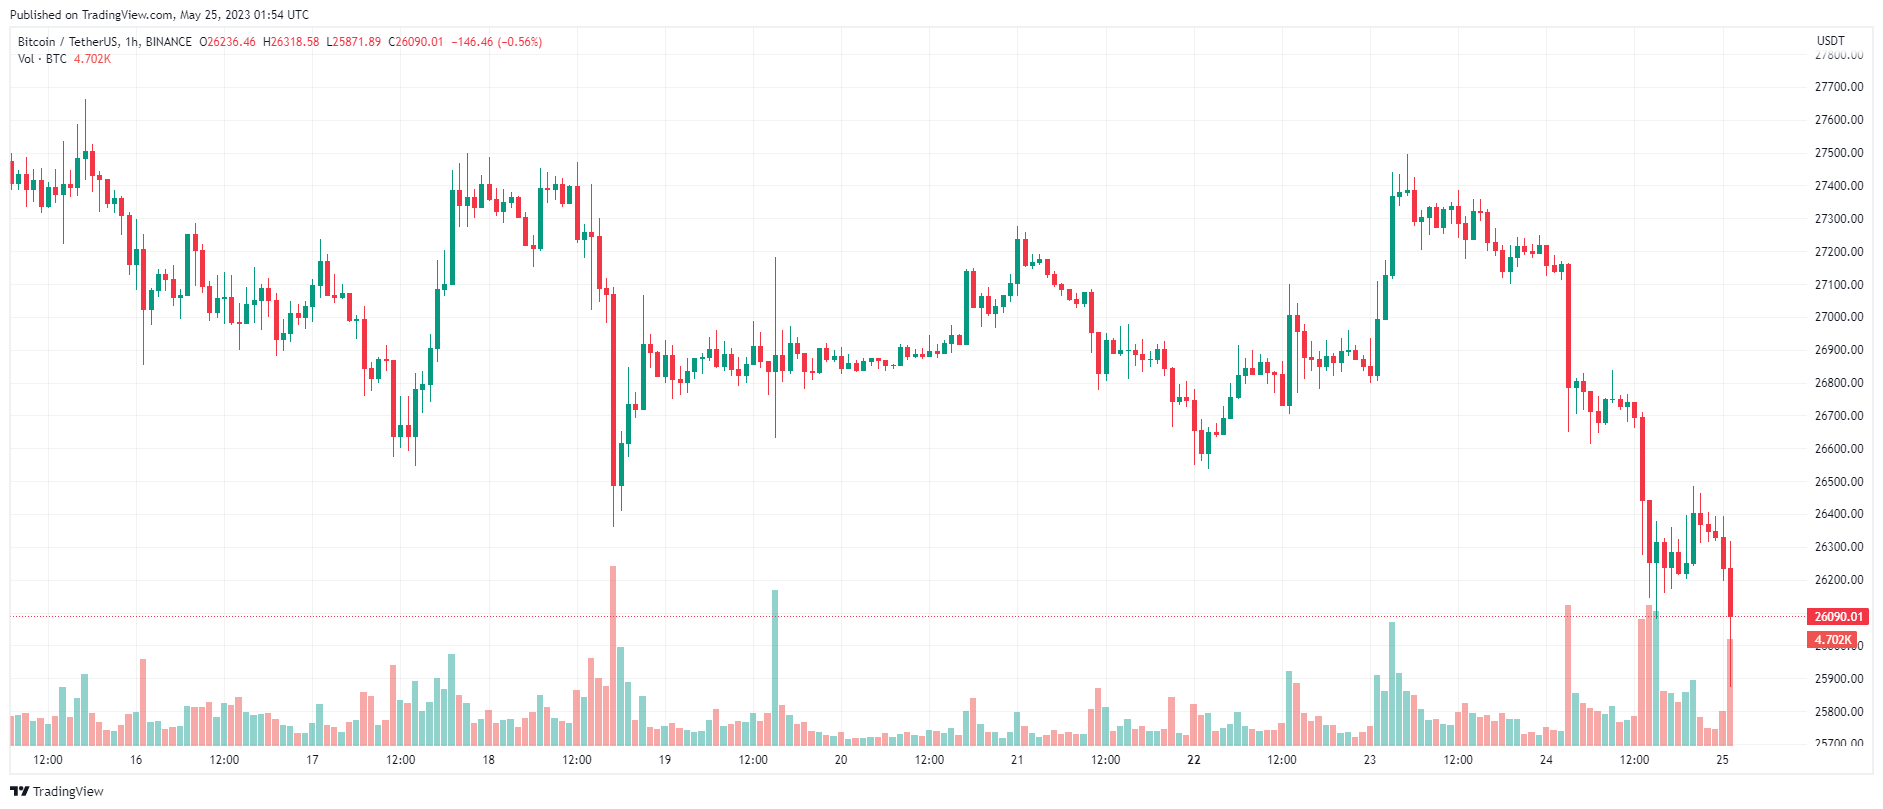
BTC Price Chart – 1 hour | Source: TradingView
The Dow Jones Industrial Average fell for a fourth straight session on Wednesday (May 24), as US lawmakers struggled to reach an agreement on the national debt ceiling.
Ending the session, the Dow Jones fell 255.6 points (or 0.77%) to 32,800 points. The S&P 500 lost 0.73% to 4,115.2, while the Nasdaq Composite dropped 0.61% to 12,484.1.
U.S. House of Representatives Speaker Kevin McCarthy said at a news conference late in the morning that negotiators were still at odds over spending limits and blamed Democrats for moving on to negotiations too late in the process. This. Mr. McCarthy also said he believes the negotiating teams can make progress by Wednesday.
US Treasury Secretary Janet Yellen had previously warned lawmakers that the possibility of default in early June was "very high". Yellen noted on Wednesday that she has seen "some stress in financial markets" as fears grow that the United States could default on its debt for the first time in history.
Adam Sarhan, CEO of 50 Park Investments, said: “The market is still in a bearish position due to a combination of overbought conditions and concerns about unfavorable debt ceiling results as June 1 approaches.” .
U.S. stocks hovered near bottoms, as the latest Federal Reserve meeting minutes released further signaled "uncertainty" over whether the central bank can raise interest rates again in June or not.
The minutes of the meeting indicated that the decision to raise interest rates at the next meeting will depend on upcoming data releases.
Meanwhile, gold prices fell as the dollar strengthened on Wednesday (May 24), reducing the flow of safe-haven money to gold in the face of an impending US debt default, as negotiations entered important period.
At the end of the session, the spot gold contract fell 0.6 percent to $1,963.1 an ounce, after gaining 0.5 percent previously. Gold futures lost 0.4 percent to $1,965.7 an ounce.
Oil prices rose on Wednesday (May 24), after an unexpected drop in US crude inventories and a warning from Saudi Arabia's Energy Minister raised the prospect of further OPEC+ production cuts. .
At the end of the session, the Brent oil contract gained 1.4 USD (equivalent to 1.8%) to 78.24 USD/barrel. The WTI oil contract added $1.27, or 1.7 percent, to $74.18 a barrel.
Data from TradingView shows BTC/USD establishing a local bottom at $25,890, the lowest since May 12.
The latest action is a world away from just a day earlier, when uptrends became the main story for the market and Bitcoin was aiming for the $27,500 region.
For now, traders need to keep an eye on important levels like the 100-day and 200-week moving averages.
“The market is retesting the 200-Week Moving Average. This is the MOST important level that BTC bulls need to hold,” summarized Material Indicators.
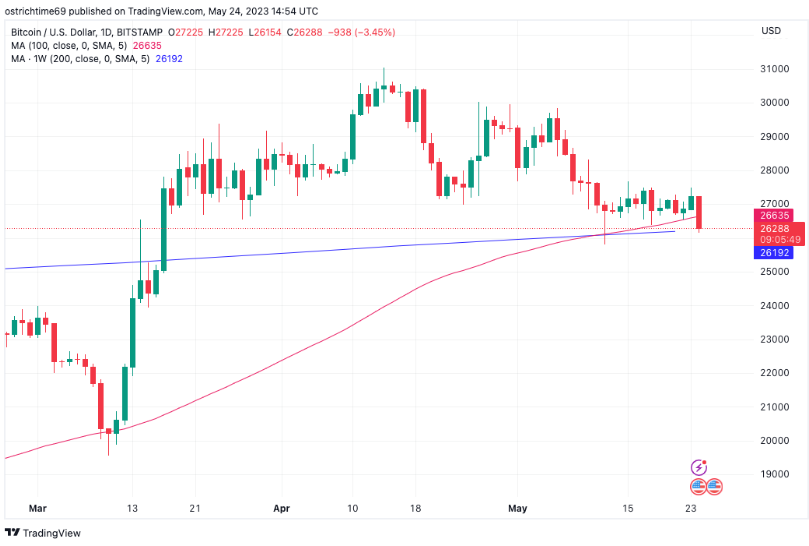
BTC/USD Candlestick Chart – 1-day with 100-day, 200-week MA | Source: TradingView
Michaël van de Poppe, founder and CEO of trading firm Eight, further notes on the 200-week MA and the EMA. He describes this as a “moment of truth” for the market.
For trading platform QCP Capital, now is the time for Bitcoin bulls to be cautious.
BTC/USD is in a time of uncertainty, increasing the chances of a correction. However, the final outcome will depend on resolving the debt ceiling issue.
“Despite the mid-term trend higher, BTC could quickly synchronize with what other macro markets are implying. However, in the 'no deal' case, we will easily break this year's highs."
Altcoin on fire as Bitcoin corrects more than 5% on the day.
Leading the way down were PancakeSwap (CAKE), Pepe (PEPE) and Fantom (FTM) as all three projects lost more than 10% of their value in just 24 hours.
KAVA (KAVA), Injective (INJ), ImmutableX (IMX), Litecoin (LTC), Sui (SUI), Stacks (STX), ApeCoin (Ape), Aptos (APT)… all fell from 6-9%.
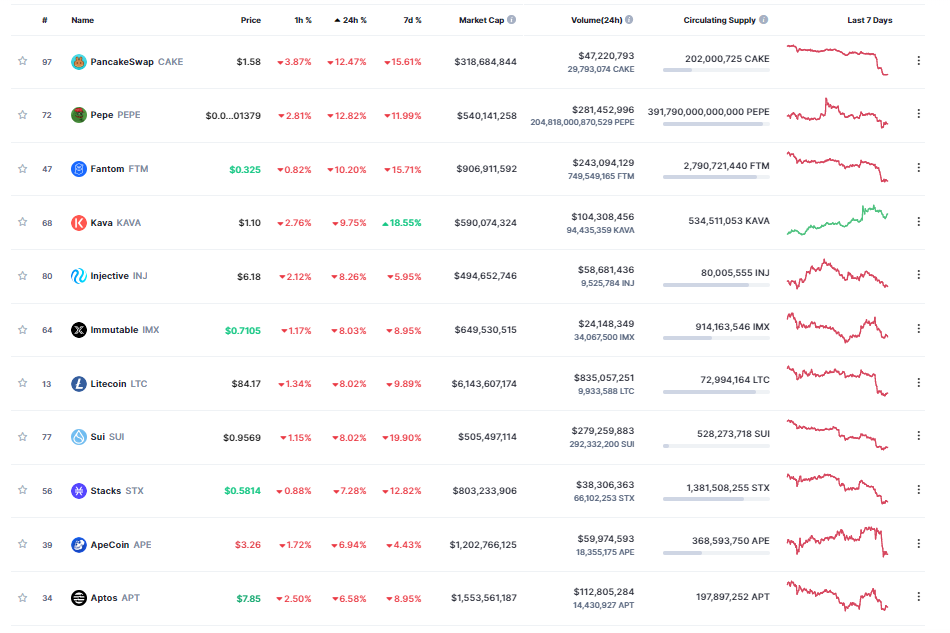
Source: Coinmarketcap
Ethereum (ETH) also officially lost the $1,800 mark after days of defending. The 2nd largest digital asset by market capitalization has established a local intraday bottom at $1,763 with a drop of over 5% and is currently trading around $1,775.
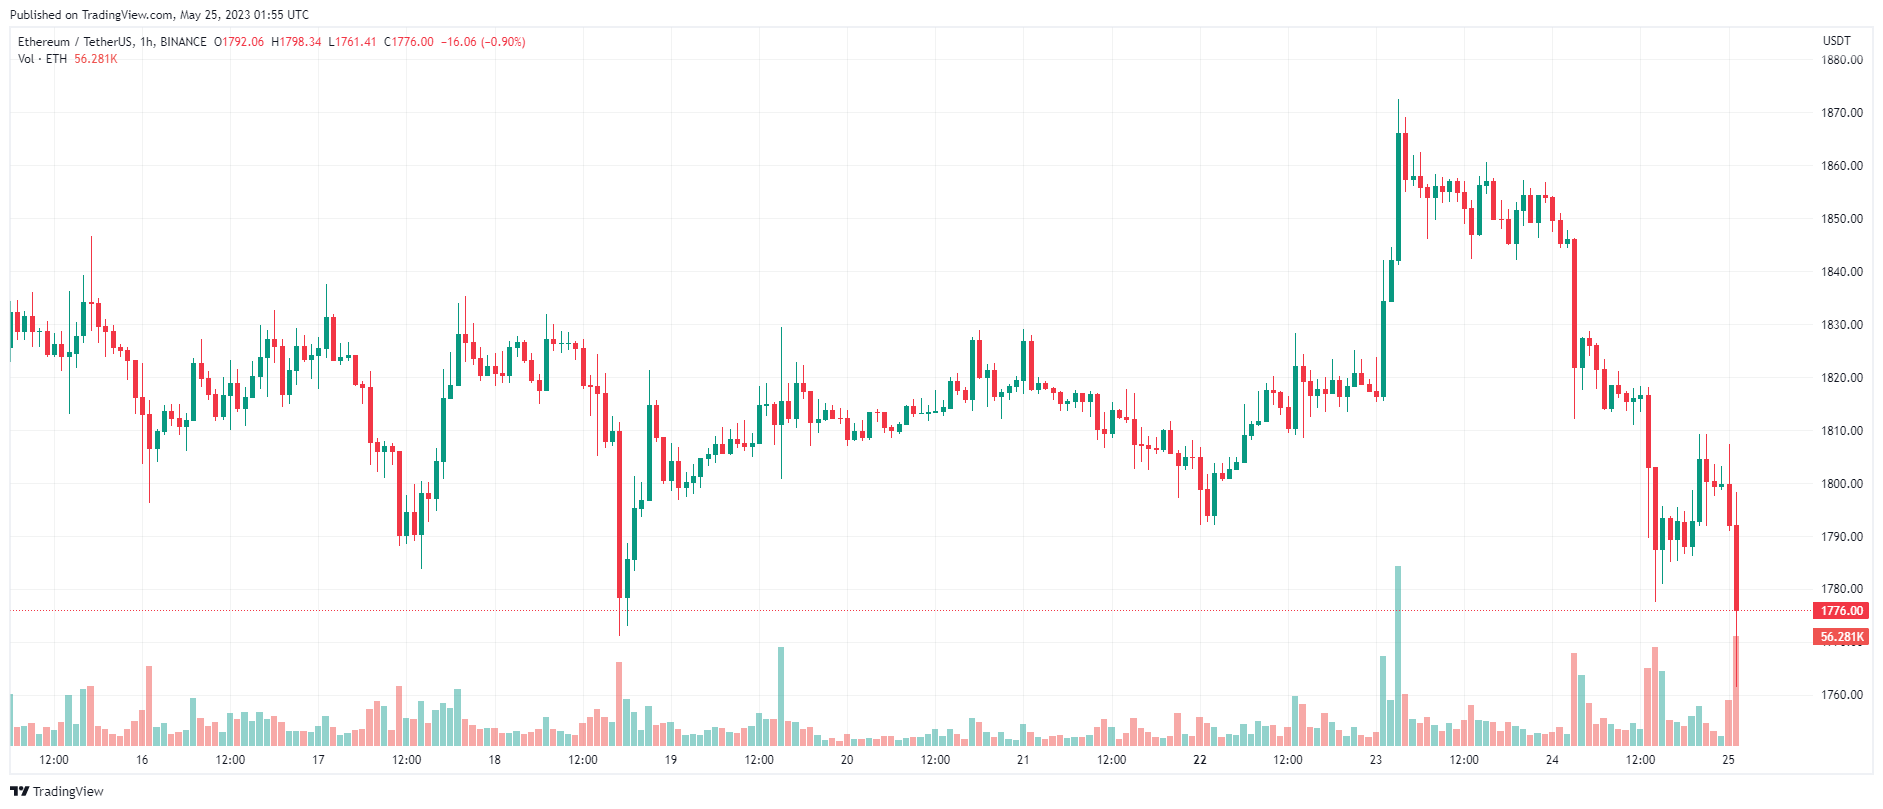
ETH price chart – 1 hour | Source: TradingView
The column “Coin Price today” will be updated at 9:00 daily with general market news, readers are welcome to follow.