XRP’s price action over the past several days has been tight and uneasy in a way that tends to make traders impatient. XRP is now drifting sideways just below $2, compressing into a narrower range between $1.9 and $1.96. To some, this looks like weakness.
To others, it looks like upside pressure is building. One technical analyst believes XRP’s price action is approaching a moment that could redefine the entire structure. That view was shared on X by crypto analyst Archie, who noted that its current consolidation is a precursor to a violent breakout that will send its price into new all-time highs.
Why The Current XRP Structure Matters
According to the technical analysis in question, XRP has been carving out a tightening pattern directly beneath a descending trendline that has acted as resistance since the beginning of the year. XRP printed a higher high of $2.4 in early January, retraced, and then began compressing into a narrow range of lower highs on the 30-minute candlestick chart.
The chart shows how the token has repeatedly respected the trendline without collapsing below support at $1.9. This, in turn, has created what Archie describes as a coil right under the resistance trendline. Interestingly, this kind of structure tends to resolve quickly once price makes contact with the trendline again.
Trendline Obliteration And The Push Beyond $2
According to the analyst’s prediction, the next touch of the trendline will not be another rejection. Instead, the next touch will lead to a clean break that sends XRP decisively through $2, which is a little more than a checkpoint. From his perspective, the repeated tests of resistance have weakened it, increasing the probability of a breakout as opposed to another downward rejection.
At the time of writing, the altcoin is trading at $1.91, down by 2.6% in the past 24 hours. However, looking closely at the chart Archie shared gives structure to what to expect once the trendline breaks.
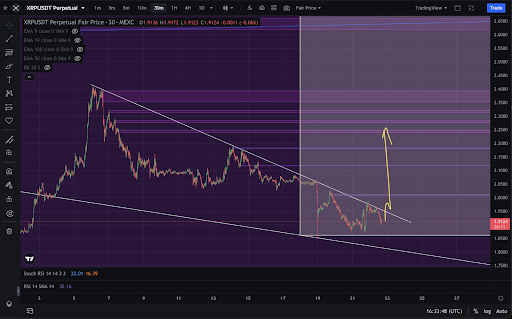
The first level is just above the descending trendline itself, around the $2.00 to $2.05 region. In the context of the chart, a clean move through this level is what flips the structure from compression below resistance into expansion above resistance.
Above that, the next highlighted resistance is just below $2.20. The chart then shows a broader resistance cluster between roughly $2.35 and $2.40. Reaching and breaking above this zone is much more significant, as it would show that the breakout is a genuine trend reversal.
At the top end of the projection, the highest marked region is around $2.60. This zone appears to be the final upside target shown on the chart and would place XRP firmly into price discovery territory relative to recent structure.