Biên tập: Cointelegraph
Biên dịch: AididiaoJP, Foresight News
Tiêu đề gốc: Tại sao chỉ có đầu tư định kỳ mới nắm bắt được cổ tức dài hạn của Bitcoin?
Cả dữ liệu backtest và mô hình dự báo đều chỉ ra rằng chiến lược đầu tư định kỳ (DCA) vào Bitcoin là cách tốt nhất để đầu tư BTC. Liệu phương pháp này còn hiệu quả trong chu kỳ bull market tiếp theo không?
5 tháng qua, Bitcoin đã trải qua mức giảm 50%, các nhà đầu tư thông minh sẽ điều chỉnh chiến lược trong thị trường bear và giai đoạn điều chỉnh này. Chiến lược này gọi là Dollar-Cost Averaging (DCA), tức là định kỳ đầu tư một số tiền cố định bất kể tình hình thị trường.
Thông qua dữ liệu chu kỳ thị trường trong quá khứ và mô phỏng giá BTC trong tương lai, chúng ta có thể thấy rõ hơn hiệu quả của phương pháp đầu tư ổn định này ở các thời điểm tham gia và chu kỳ đầu tư khác nhau.
Đầu tư định kỳ Bitcoin 5 năm, lợi nhuận ròng đáng kể
Từ tháng 1/2021, đầu tư định kỳ hàng tuần 250 USD mua Bitcoin, sau 5 năm tổng đầu tư là 67.500 USD. Theo dữ liệu mô phỏng DCA, chiến lược này đã mua được tổng cộng 1.65097905 BTC với giá mua trung bình 40.884 USD.
Tính theo giá Bitcoin hiện tại gần 71.000 USD, số BTC 1.65097905 này có giá trị khoảng 120.500 USD, lãi 53.000 USD (tăng 76%). Khi Bitcoin tăng lên 100.000 USD, danh mục này có giá trị khoảng 165.000 USD; còn tại đỉnh chu kỳ tháng 10/2025 gần 126.000 USD, giá trị danh mục đạt 208.000 USD.
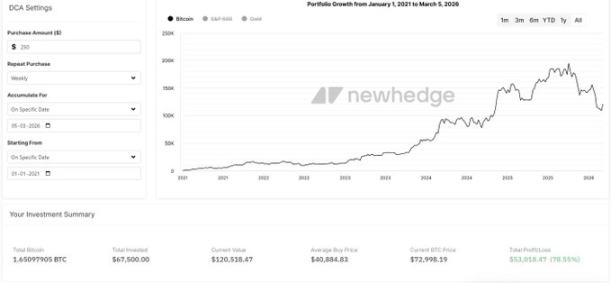
Chu kỳ DCA Bitcoin 2021-2026 Nguồn: Newhedge
Xem xét một chu kỳ đầu tư ngắn hơn để thấy tác động của thời điểm tham gia đến lợi nhuận ban đầu. Từ tháng 1/2024, đầu tư định kỳ hàng tuần 250 USD, tổng đầu tư 28.500 USD, mua tích lũy được 0.36863166 BTC với giá mua trung bình 77.312 USD.
Tính theo giá hiện tại 71.000 USD, số Bitcoin này có giá trị khoảng 26.909 USD, lỗ 6%. Khi giá đạt 100.000 USD, giá trị danh mục là 36.863 USD; khi đỉnh chu kỳ đạt 126.000 USD, giá trị danh mục là 46.448 USD.
Tháng 2 năm nay, nhà phân tích Swan Bitcoin Adam Livingston đã so sánh lợi nhuận của việc đầu tư định kỳ BTC và chỉ số S&P 500 trong 5 năm qua trên nền tảng X. Đầu tư hàng tuần 100 USD, BTC cuối cùng thu được 42.508 USD, S&P 500 thu được 37.470 USD, tỷ suất lợi nhuận lần lượt là 62.9% và 43.6%.
Livingston chỉ ra, mặc dù biến động giá Bitcoin lớn, nhưng dữ liệu lịch sử cho thấy kiên trì đầu tư định kỳ khi giá giảm, lợi nhuận dài hạn thậm chí còn cao hơn.
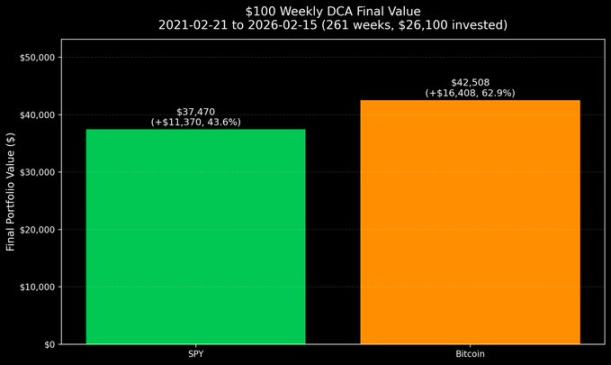
So sánh đầu tư định kỳ hàng tuần 100 USD vào BTC và S&P 500 Nguồn: Adam Livingston/X
Mô hình dài hạn: Thời gian mới là chìa khóa
Nghiên cứu mô phỏng triển vọng cũng kiểm tra hiệu quả của việc bắt đầu đầu tư định kỳ từ năm 2026. Từ tháng 1/2026, đầu tư định kỳ hàng tuần 250 USD, đến tháng 3/2030, tổng đầu tư khoảng 54.250 USD.
Dự báo giá dựa trên đường cong tăng trưởng lũy thừa dài hạn của Bitcoin (theo dõi mối quan hệ giữa giá lịch sử và thời gian trên biểu đồ log). Mô hình này tạo ra một dải hỗ trợ tăng và một đường xu hướng trung vị, về cơ bản trùng khớp với các chu kỳ thị trường trước đây.
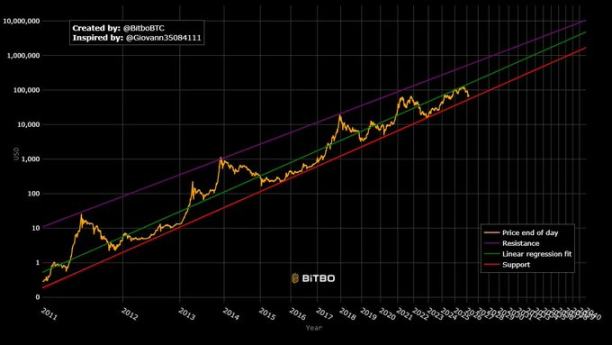
Đường cong tăng trưởng lũy thừa Bitcoin Nguồn: Bitbo.io
Theo mô hình này, các nhà phân tích ước tính đến năm 2028, mức hỗ trợ xu hướng dài hạn có thể vượt 100.000 USD, đây cũng là giả định cơ sở cho mô hình hóa DCA trong tương lai. Mô phỏng của Bitcoin Well cho thấy, đến tháng 3/2030, giá trung vị dự kiến ước tính khoảng 430.000 USD.
Cân nhắc khả năng giá có thể lệch, mô hình cũng xem xét ranh giới trên dưới của kênh lũy thừa, đưa ra một giá trị dự báo thấp hơn (khoảng 274.000 USD) và một giá trị dự báo cao hơn (khoảng 900.000 USD).
Dựa trên những giả định này, đầu tư định kỳ 4 năm có thể tích lũy khoảng 0.30 BTC:
-
Nếu giá BTC là 274.000 USD, giá trị danh mục khoảng 82.200 USD.
-
Nếu giá BTC là 430.000 USD (dự báo trung vị), giá trị danh mục khoảng 129.000 USD.
-
Nếu giá BTC là 900.000 USD, giá trị danh mục khoảng 270.000 USD.
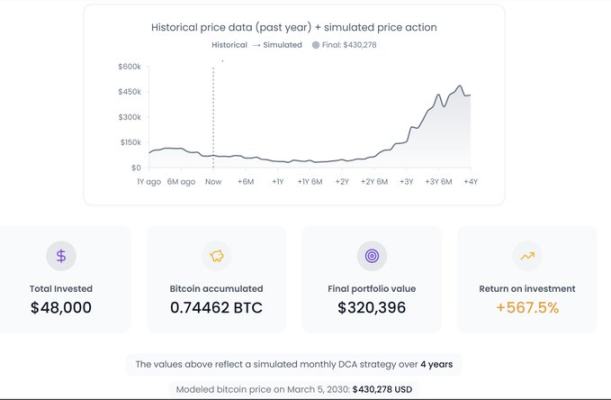
Kết quả đầu tư DCA tính đến tháng 3/2030 Nguồn: Bitcoin Well
Tháng 11/2025, nhà nghiên cứu Bitcoin Sminston With đã thực hiện một nghiên cứu, sử dụng mô hình dự báo tương tự để kiểm tra tác động của thời điểm tham gia đến lợi nhuận dài hạn. Kết quả phát hiện, ngay cả khi mua với giá cao hơn 20% so với giá 94.000 USD lúc đó và bán với giá thấp hơn 20% so với giá trung vị dự báo năm 2035, danh mục còn lại sau mười năm vẫn có lãi gần 300%.
Trong mô phỏng này, tổng tài sản cuối cùng gấp 7.7 lần số vốn ban đầu.
Kết luận nghiên cứu: Thời điểm tham gia ảnh hưởng đến mức độ lợi nhuận, nhưng nắm giữ dài hạn mới là chìa khóa quyết định quy mô lợi nhuận.