Author: Frank, PANews
Whenever the market enters a confusing phase of neither rising nor falling, some people try to use a "marking the boat to find the sword"-style historical backtracking method to predict the next trend. In such cases, people often see history repeating itself in these theories and charts, and seemingly automatically overlap the market trend for the next period with a certain period in the past.
This overlap seems to have a magical effect and is often verified. Some bloggers claim that the accuracy of such predictions can reach 75% to 80%.
This "marking the boat to find the sword"-style price prediction, which repeatedly goes viral on social media, is it helping the market identify phases, or is it packaging noise as prophecy?
From "Tick-Tock Fractals" to "History Rhymes"
The peak operation predicting the market peak in October 2025 was by an analyst named CryptoBullet, who created an analysis method called "tick-tock fractals." Starting in May 2025, CryptoBullet predicted that the BTC price would peak in October.
Ultimately, this model successfully predicted the end of the bull market. However, CryptoBullet predicted a price of $150,000, while the actual peak price only reached $126,000.
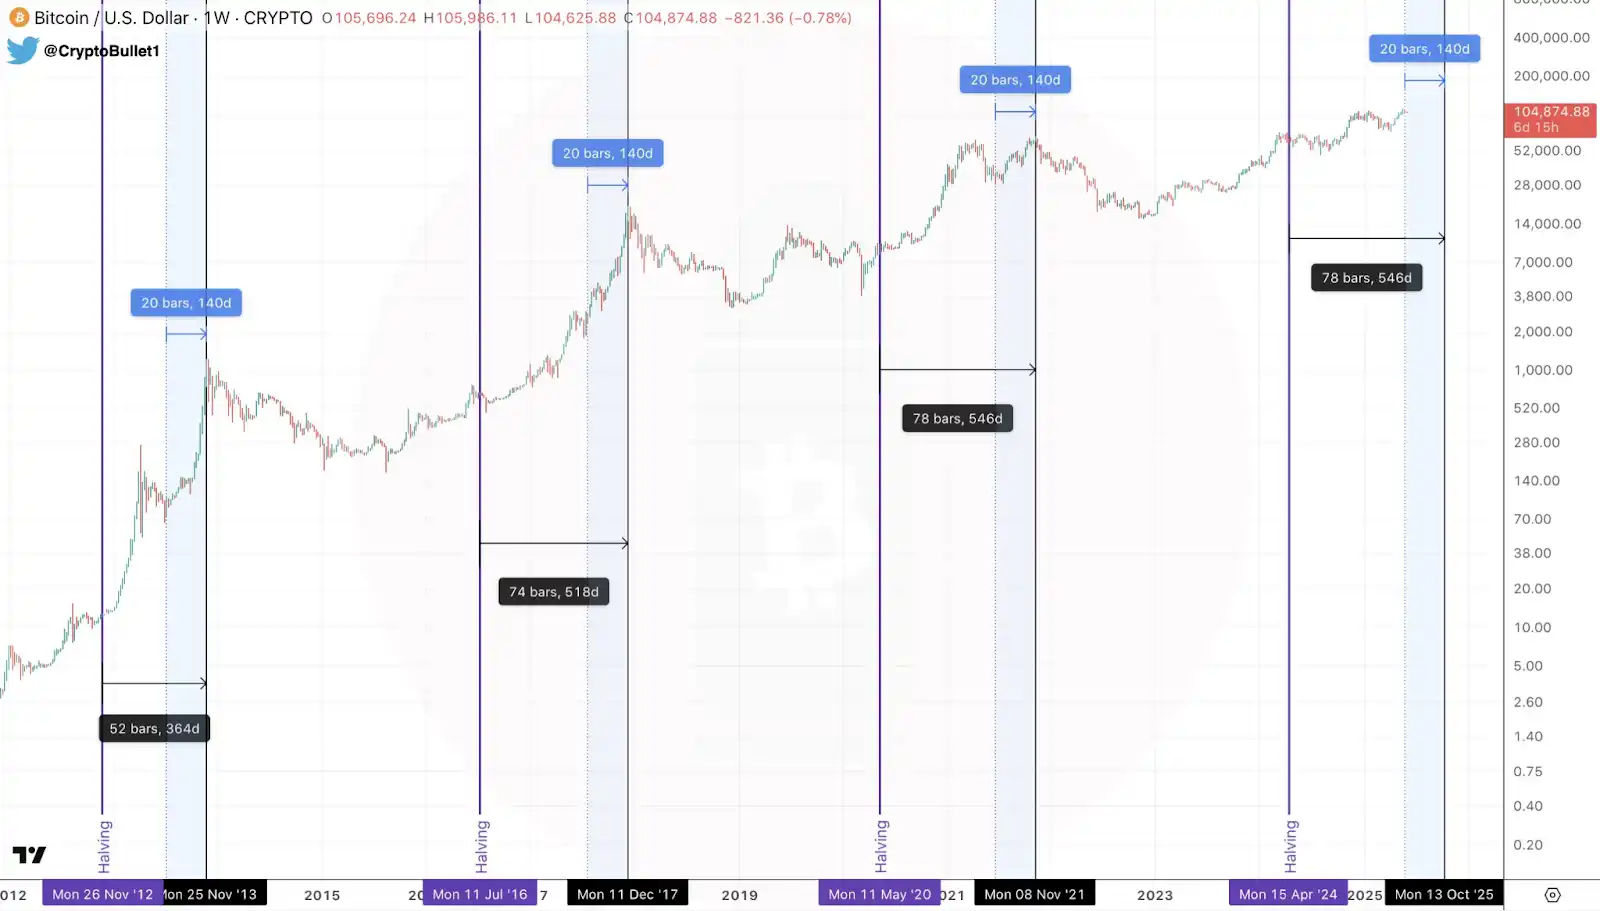
From the perspective of his prediction model's principles, achieving such an effect is also expected. His main logic is: in the past few cycles, a certain number of days after the halving often approached the top. When the market has entered a similar window, according to the same time interval and price development, it is likely to be October, with the highest price reaching $150,000. In this logic, the most important parameter is the time cycle, so the prediction of the time point was relatively accurate, but the price was not hit.
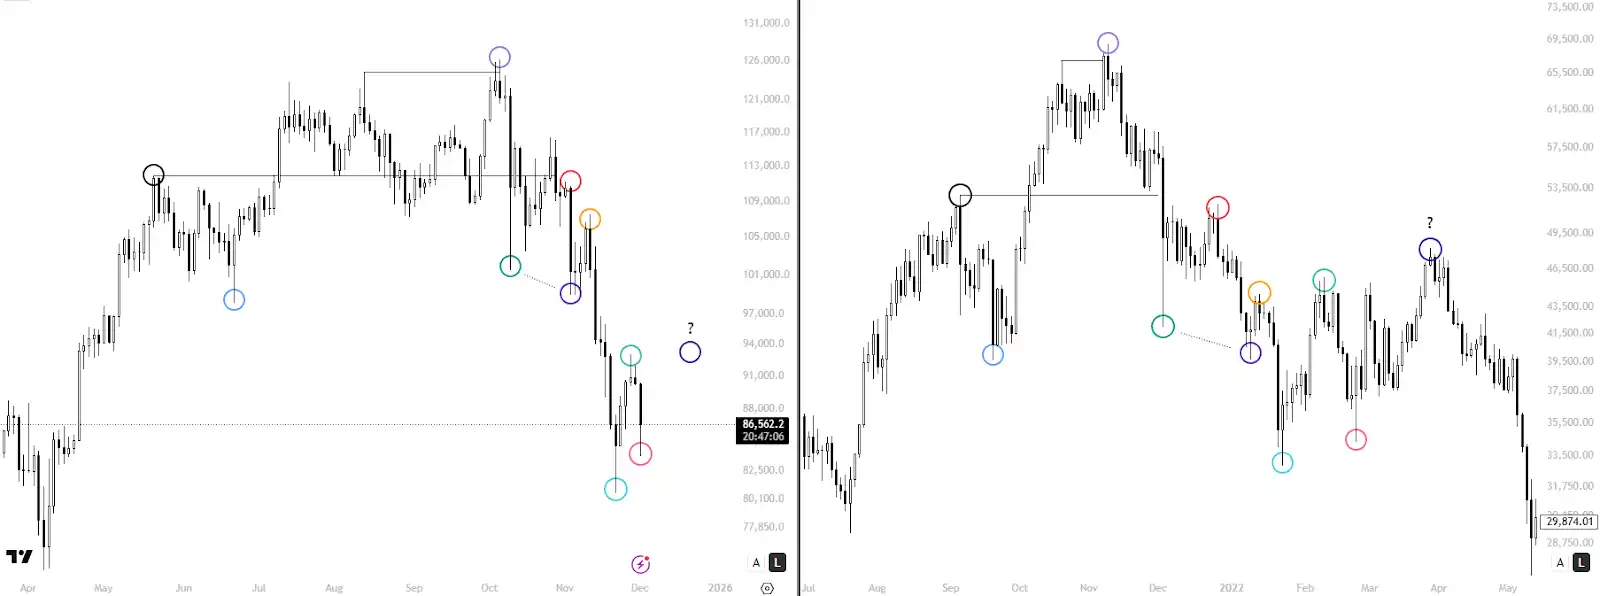
Another case is KillaXBT, whose core idea is: history does not repeat exactly, but often "rhymes." He combines time cycles, historical pivot windows, and structural symmetry to adapt to the current market.
For example, he does not force all time cycles into a proportion, emphasizing that whenever a certain time comes, something will happen. Instead, he compares and analyzes the current price window and trend with a certain stage in historical trends, then vaguely predicts the possible next trend.
This prediction does not involve very specific prices or specific time points. It only judges whether the next market movement will be up or down.
KillaXBT claims that the accuracy of such predictions can reach 75% to 80%.
PANews reviewed several of his recent predictions. For example, in December 2025, he analyzed that the price trend at that time was highly similar to that of 2021. He predicted that it might bottom out at $80,000 and then break through $90,000. The actual trend was that the price did not fall below $80,000, but it eventually broke through $90,000, reaching nearly $98,000 at its peak. Although the price prediction was not accurate, the trend was indeed similar to the 2021 interval he simulated.
In January 2026, KillaXBT stated based on another prediction method that, according to the statistical pattern of the past 7 months, the market fell by an average of 8% within two weeks after the 14th of each month. Therefore, he predicted that after January 14, the market might enter a downward channel again, falling by at least 8%.
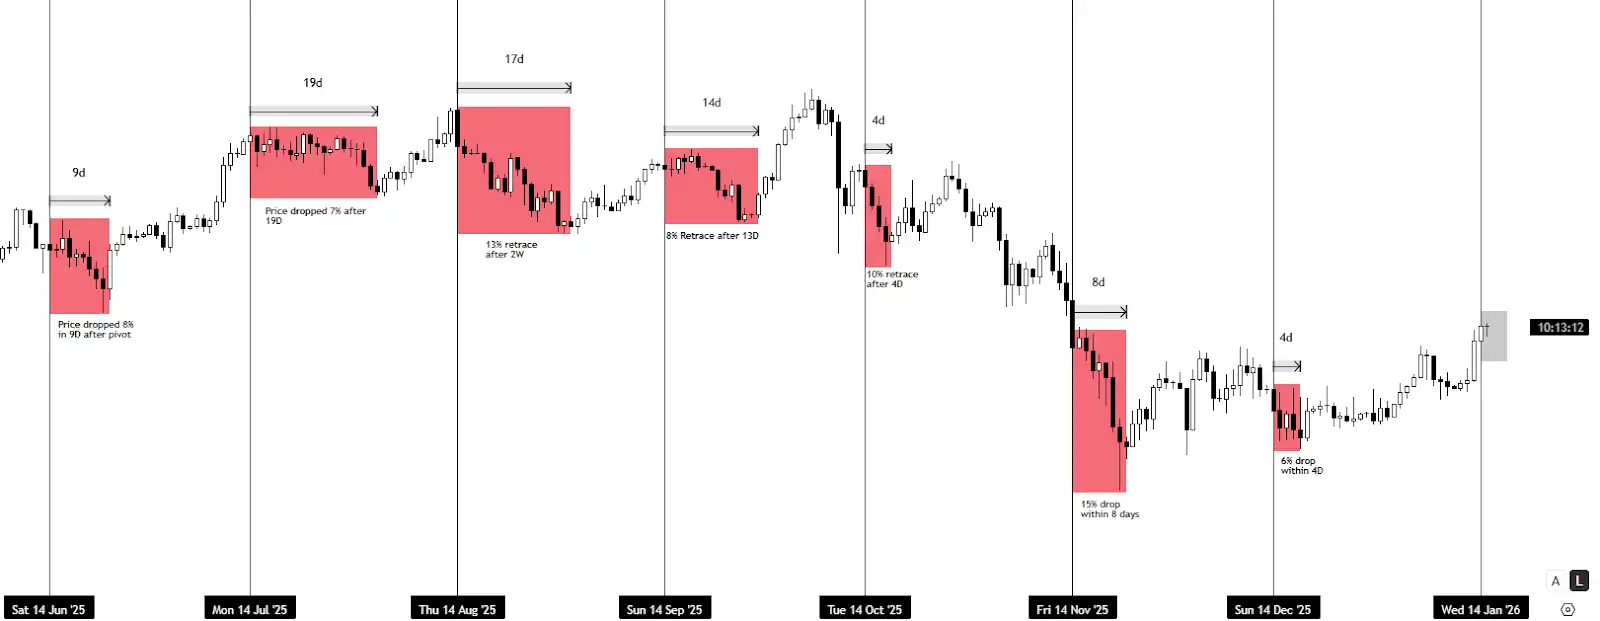
In fact, this prediction also showed accuracy. After a short-term peak on January 15, the market indeed entered a rapid downward channel, with a maximum drop of over 38%.
In February 2026, he predicted again that the current trend had a script similar to that of 2022. It might surge once and then break down to below $60,000 to form a bottom range. Of course, this prediction has not been verified yet. However, the recent rebound to around $74,000 also verified part of the trend in his prediction chart.
At first glance, KillaXBT's predictions are quite accurate. This has also won him a lot of attention and fans.
Mysticism or Science? The Three Logics Behind the High Win Rate of "Marking the Boat to Find the Sword"
But the next question is more practical: why are these "marking the boat to find the sword"-style predictions accurate? Is it mysticism or is there some scientific basis?
First: History does rhyme, but the essence of rhyming is that the market structure caused by liquidity and market heat is always similar. For example, in the "Wyckoff Trading Method," the market is divided into four stages: accumulation, markup, distribution, and markdown.
The repetition of this market evolution is behind the repetition of market emotions, from panic to狂热, and from狂热 to panic.
Second: This predictive effect is not the exclusive ability of the "marking the boat to find the sword" method; most commonly used technical indicators can achieve similar predictive effects. If you look back at the performance of indicators such as MACD, RSI, and trend lines in historical data, you will find that these indicators can also provide early warning signals at price tops and bottoms. However, firstly, these indicators are too familiar to the trader community and lack a sense of mystery. Secondly, compared to the "marking the boat to find the sword" method, these indicators are not as intuitive in showing specific trend structures (such as rising first and then falling). But people instinctively prefer this intuitive and simple way of expression.
Third: The lucky deviation after a large number of predictions. There is an example in the book "Fooled by Randomness": if you put an infinite number of monkeys in front of typewriters and let them type randomly, one of them will definitely type the epic poem "Iliad" word for word. This is not to say that these analysts are simply胡乱 analyzing, but to illustrate one thing: there are a large number of predictions on social media every day. Those wrong predictions are either ignored or silently deleted. The cases that remain and are公认 as high-quality are, to a large extent, also the deviation of the lucky ones. The goal of KOLs is traffic, while the goal of traders is the profit and loss of real money accounts.
"Marking the boat to find the sword"-style predictions are not new in the encryption field. Similar theories emerged years ago, such as TechDev superimposing Bitcoin's monthly line with the 2013 cycle and the gold trend in the 1970s, giving a top expectation of $200,000 to $390,000; PlanB used the stock-to-flow ratio model and floor model to extrapolate the halving rhythm to nearly $100,000. Many analysts directly applied the local intervals of 2017 and 2021 to the current trend.
By this cycle, these predictors have almost all折戟沉沙, with little topic热度. When the old prophets are eliminated by the market, new chart masters will appear with new mysticism. (Related reading: When "old maps" are no longer applicable:盘点8个失灵的加密经典指标及其背后的结构性原因)
Foreseeing the Direction is Not a Trading Strategy: Fatal Flaws in Actual Combat
Let's look at a more important question: is this "marking the boat to find the sword" useful for actual trading?
Let's review the several cases mentioned above to illustrate.
First, look at CryptoBullet's prediction: peaking in October 2025, $150,000. In actual trading, the factors usually considered are price direction, accurate timing, profit and loss stops, position management, etc.
In CryptoBullet's prediction, only a relatively vague time point is provided, and the price is wrong. As an executable trading strategy, such a judgment has limited reference value. It is difficult to accurately establish a short position in early October just because of the phrase "peak in October," because this judgment neither gives a clear entry point nor a clear failure condition. If a trader goes short too early, they may be stopped out by the rising end of the trend; if they wait until the price真正 shows a weakening signal, then look back at this prediction, it is more of a事后验证 "the time window is roughly correct," rather than a trading system that can be directly used to place orders.
Then look at KillaXBT's prediction in December. Its help for actual trading is also closer to direction judgment rather than an execution manual. He tells you that "the trend is likely to bottom out first and then break upward," but does not tell you whether to go long near $82,000, $80,000, or $78,000, nor does he tell you that if it falls below a certain position, it means this analogy fails. For medium- and long-term investors, such a judgment may help stabilize holdings and avoid panic selling during the decline. But for traders who need precise entry and exit points, it still lacks the most critical execution information.
KillaXBT's prediction in January may be the most accurate one, but the problem is that the price started to fall after the 15th. If you place an order according to such a prediction method, you may be stopped out by the upward price first, and this prediction structure does not have specific price information, so you cannot set stop profit and loss based on this prediction model.
In summary, this type of "marking the boat to find the sword"-style prediction is more like a phase identification tool than a directly reusable trading strategy. It can occasionally help the market identify risk areas and emotional inflection points, and it can indeed provide some inspiration in模糊 directions. But once packaged as a high-certainty prophecy, problems quickly appear.
History rhymes, but it doesn't copy according to screenshots.
For ordinary investors, what is truly worth learning from is not a certain "magic chart," but the emotions, liquidity, and structural changes that these charts attempt to提示; what真正 needs to be vigilant is treating this kind of模糊 phase judgment as a precise betting instruction.







