L'analyste crypto Merlijn a révélé que le prix du Bitcoin suit un schéma vieux de 100 ans, qui pourrait déterminer son prochain mouvement. L'analyste a également souligné les niveaux clés qui détermineront si la cryptomonnaie leader va s'envoler ou s'effondrer.
Le prix du Bitcoin suit un schéma vieux de 100 ans
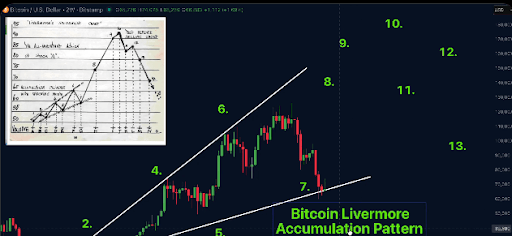
Dans un post sur X, Merlijn a noté que le prix du Bitcoin suit cette structure que Jesse Livermore a cartographiée dans les années 1920, la cryptomonnaie leader suivant chaque étape parfaitement. L'analyste a déclaré qu'un maintien du BTC au-dessus de 70 000 $ confirmerait la prochaine phase, tandis qu'une chute en dessous de 60 000 $ signifierait que la phase d'accumulation se prolongerait.
Le graphique accompagnant l'analyse a montré que le prix du Bitcoin pourrait monter jusqu'à 170 000 $ sur la base de ce modèle d'accumulation de Livermore. Cette ascension vers un nouveau plus haut historique (ATH) de 170 000 $ est prévue pour la fin de l'année ou au début de 2027. Ce niveau de prix devrait marquer un sommet pour la cryptomonnaie leader, qui pourrait ensuite chuter à 90 000 $.
Dans un autre post sur X, Merlijn a indiqué que le prix du Bitcoin devrait probablement connaître une nouvelle baisse. Cela est survenu alors qu'il notait un canal descendant du BTC avec un mouvement restant. L'analyste a déclaré que des plus bas plus élevés à l'intérieur du canal ont été formés, tandis que des rejets à la résistance se sont produits, donc une dernière purge vers 45 000 $ semble probable.
Une fois que le prix du Bitcoin aura connu cette dernière purge vers 45 000 $, Merlijn prédit que la cryptomonnaie leader pourrait alors s'envoler vers 140 000 $. Par ailleurs, la dernière purge vers 45 000 $ pourrait être invalidée si le BTC maintient 65 000 $ et que le canal descendant se brise. Cependant, l'objectif de douleur maximale s'activerait si le BTC venait à perdre ce niveau de prix.
Le BTC entre dans la zone de remise finale
L'analyste crypto Ali Martinez a déclaré que le prix du Bitcoin approche de la dernière fenêtre de remise avant le prochain marché haussier si l'histoire se répète. Il a en outre fait remarquer que si le fractal se maintient, alors il pourrait y avoir une fenêtre d'entrée en or entre le 6 octobre et le 16 octobre. Par ailleurs, la zone d'achat se situerait entre 41 500 $ et 45 000 $.
Martinez a ajouté que cela pourrait être le tremplin pour démarrer un nouveau cycle de 4 ans pour le prix du Bitcoin. « Le compte à rebours vers le prochain mouvement vertical du Bitcoin a commencé », a-t-il déclaré. L'analyste avait récemment noté que le prix du BTC était coincé dans une zone de non-transaction et que c'est un jeu d'attente pour le moment. Il a averti qu'il n'y aura pas de grand mouvement tant que la cryptomonnaie leader ne dépassera pas 70 685 $ ou ne tombera pas en dessous de 65 636 $, un niveau que Merlijn a souligné.
Au moment de la rédaction, le prix du Bitcoin s'échange aux alentours de 70 600 $, en hausse de plus de 3 % au cours des dernières 24 heures, selon les données de CoinMarketCap.