Bitcoin Network Activity Index Keeps Declining: Demand Still Weak?

bitcoinistPublished on 2026-03-26Last updated on 2026-03-26

Abstract

CryptoQuant's Bitcoin Network Activity Index, which combines metrics like active addresses and transaction counts, continues to decline, indicating weak on-chain demand. Despite Bitcoin's price rally to new all-time highs in 2025, the index has remained below its 365-day moving average—a bearish signal similar to patterns observed in late 2021. Concurrently, Glassnode's Accumulation Trend Score shows recent neutral or distribution-focused behavior across investor cohorts, contrasting with brief accumulation after February's price drop. Bitcoin currently trades around $70,900, up over 2% in 24 hours, but underlying network activity suggests persistent weak demand.

CryptoQuant’s Network Activity Index for Bitcoin has been locked in a downtrend, suggesting that demand for using the blockchain remains weak.

CryptoQuant’s Bitcoin Network Activity Index Has Been Cooling Off

As highlighted by CryptoQuant community analyst Maartunn in an X post, Bitcoin on-chain activity has been cooling off recently. The indicator of relevance here is the “Network Activity Index” from analytics firm CryptoQuant, which combines several activity-related metrics to showcase the overall situation on the blockchain.

The indicators referred to by the index include active addresses (both receiving and sending), transactions (total and per block), UTXO count, and bytes per block.

Now, here is the chart shared by Maartunn that shows how the CryptoQuant Network Activity Index has changed for Bitcoin over its history:

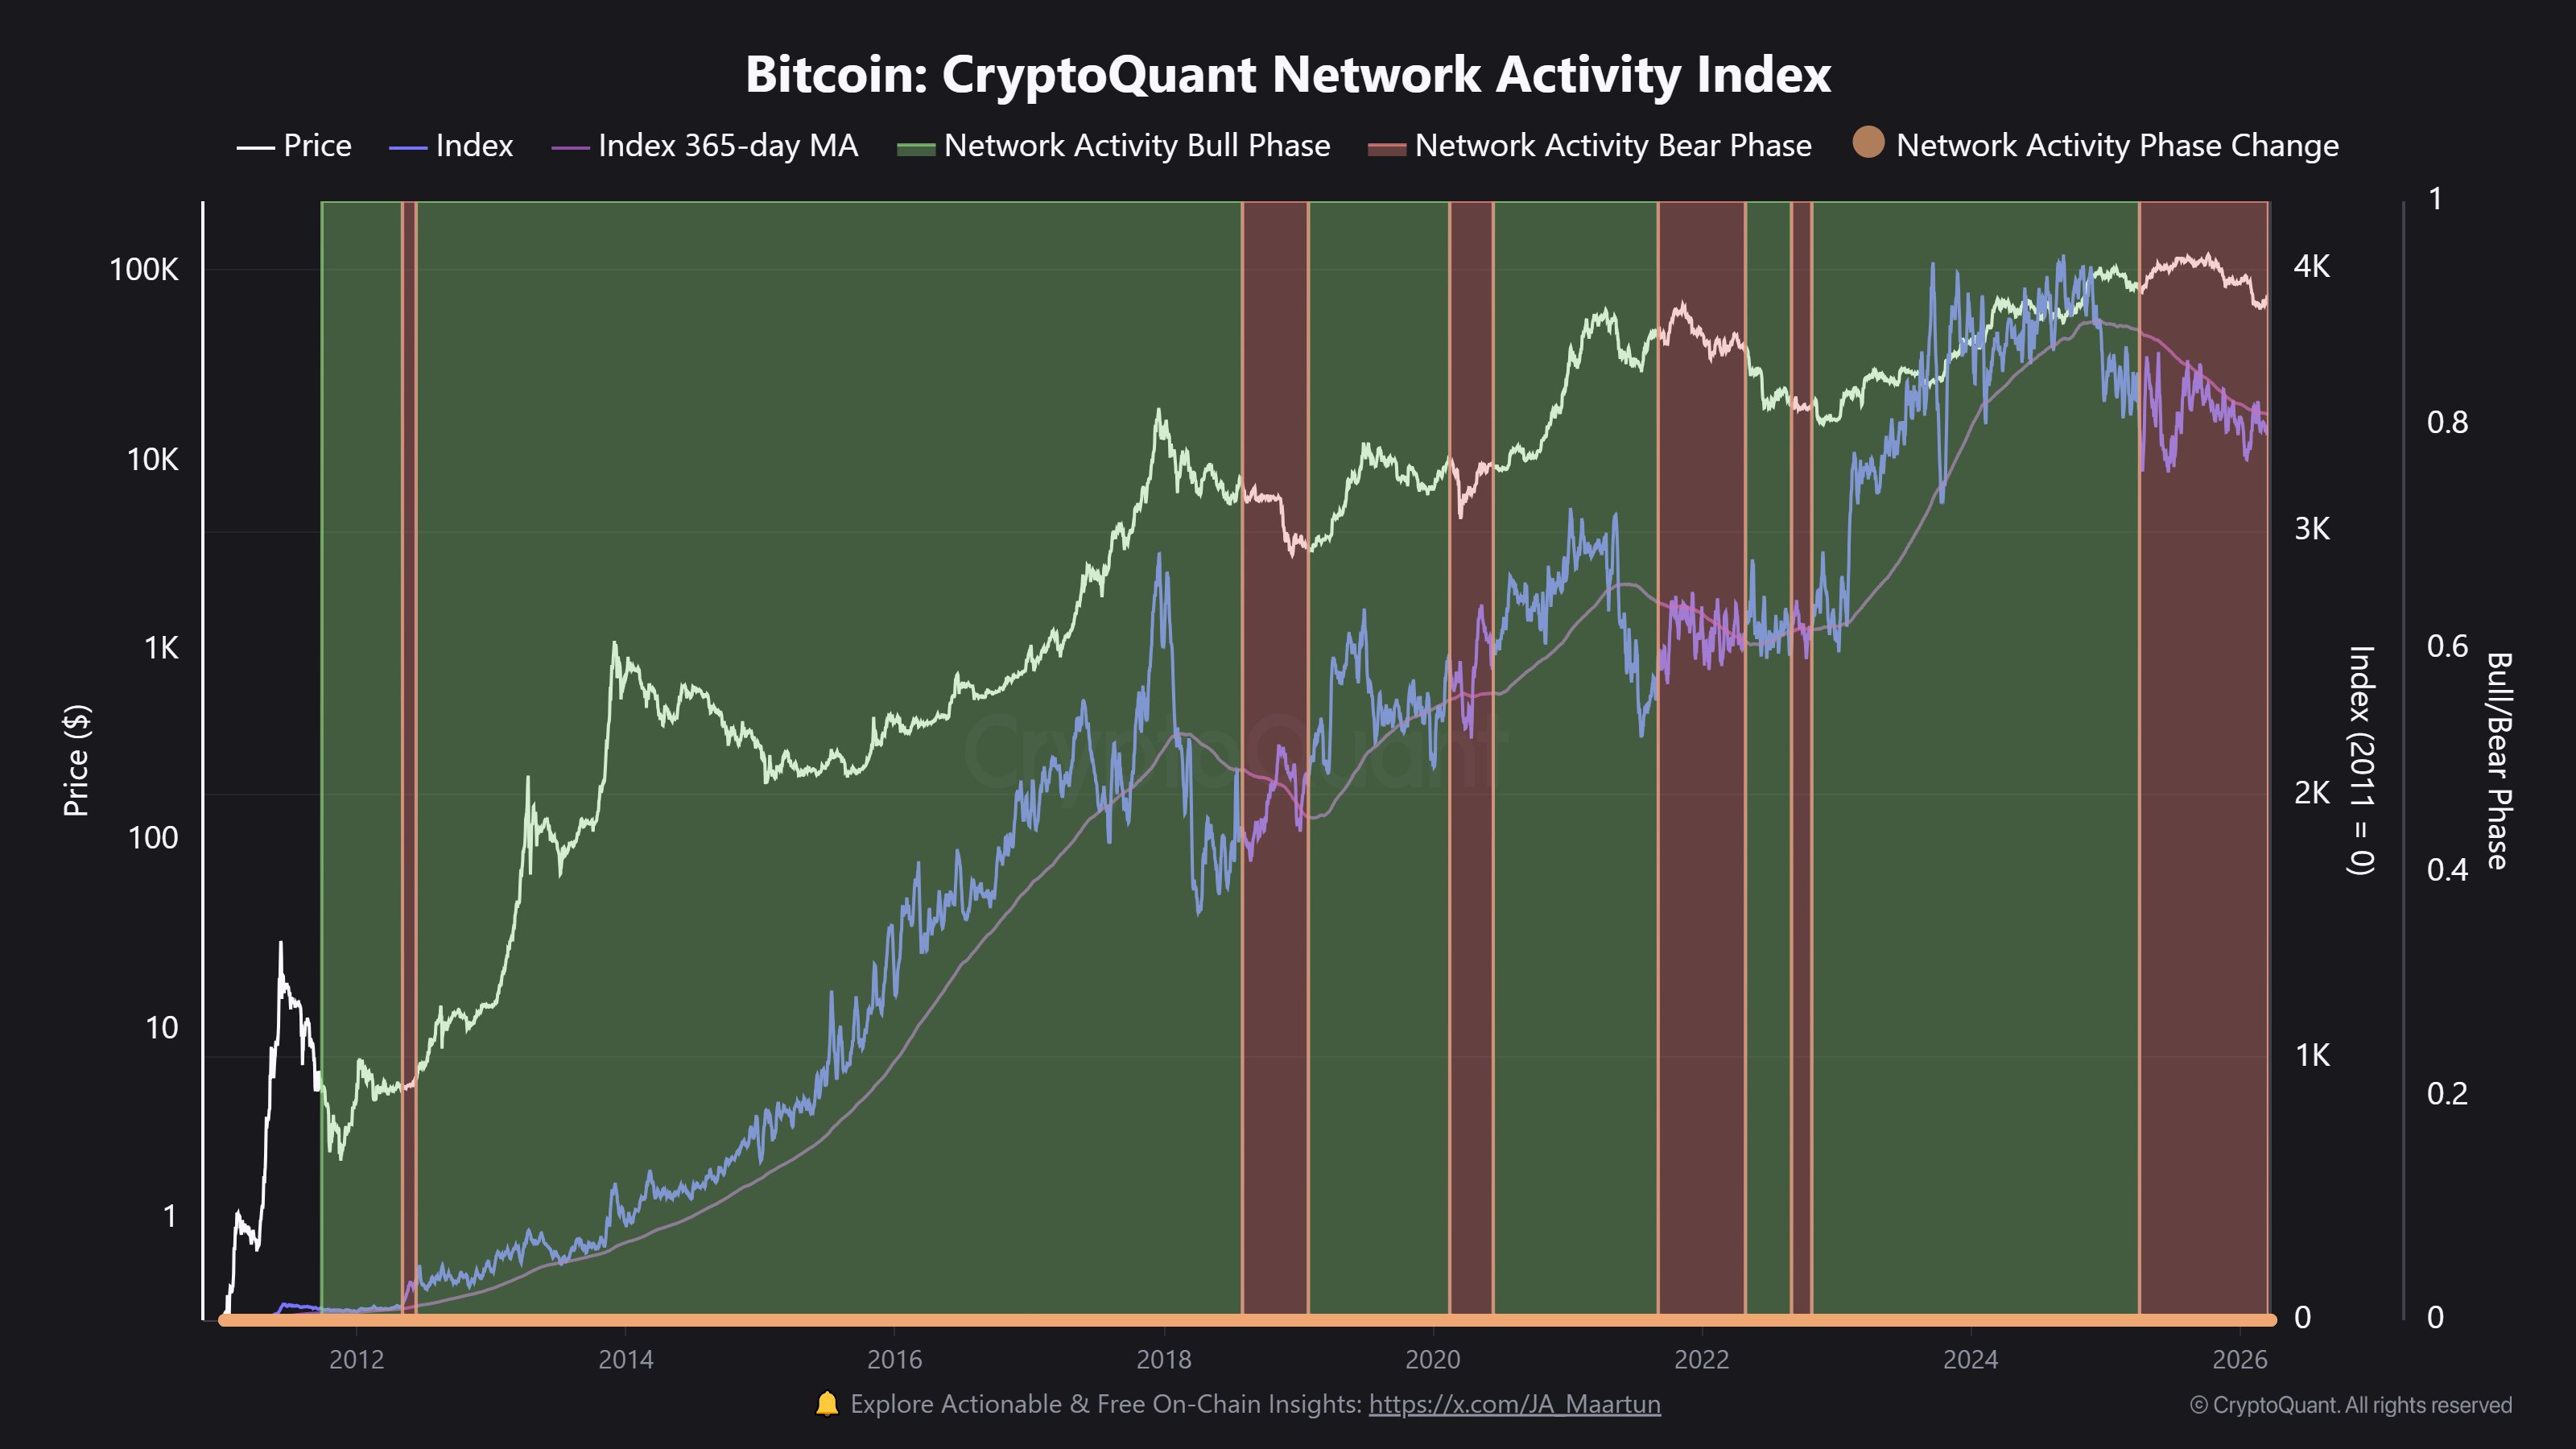
Looks like the value of the metric has steadily been going down in recent months | Source: @JA_Maartun on X

As displayed in the above graph, the Bitcoin Network Activity Index has been following a downward trajectory recently, a sign that transaction activity on the blockchain has been waning.

Alongside this decline, the indicator has been stuck in the region below its 365-day moving average (MA), something that tends to correspond to bearish phases.

Interestingly, the red signal in the indicator has actually maintained since before the shift of winds that the market saw in the last quarter of 2025. This means that even though BTC observed a rally to new all-time highs (ATHs) during the year, the network activity was still in a state of decline. From the chart, it’s visible that this pattern was also witnessed during 2021; the second half of that year’s bull run saw the metric flash a bearish signal.

Given that the Bitcoin Network Activity Index has continued to be in a red zone recently, it would appear that demand for using the network has remained weak. It now only remains to be seen how long it will take before the indicator observes a reversal.

In some other news, on-chain analytics firm Glassnode has shared the data of its new indicator, the Accumulation Trend Score by Wallet Cohort, in an X post. This metric tells us about the 30-day accumulation behavior of the various Bitcoin investor groups.

As the below chart shows, the Accumulation Trend Score has been at neutral or red values across the market recently.

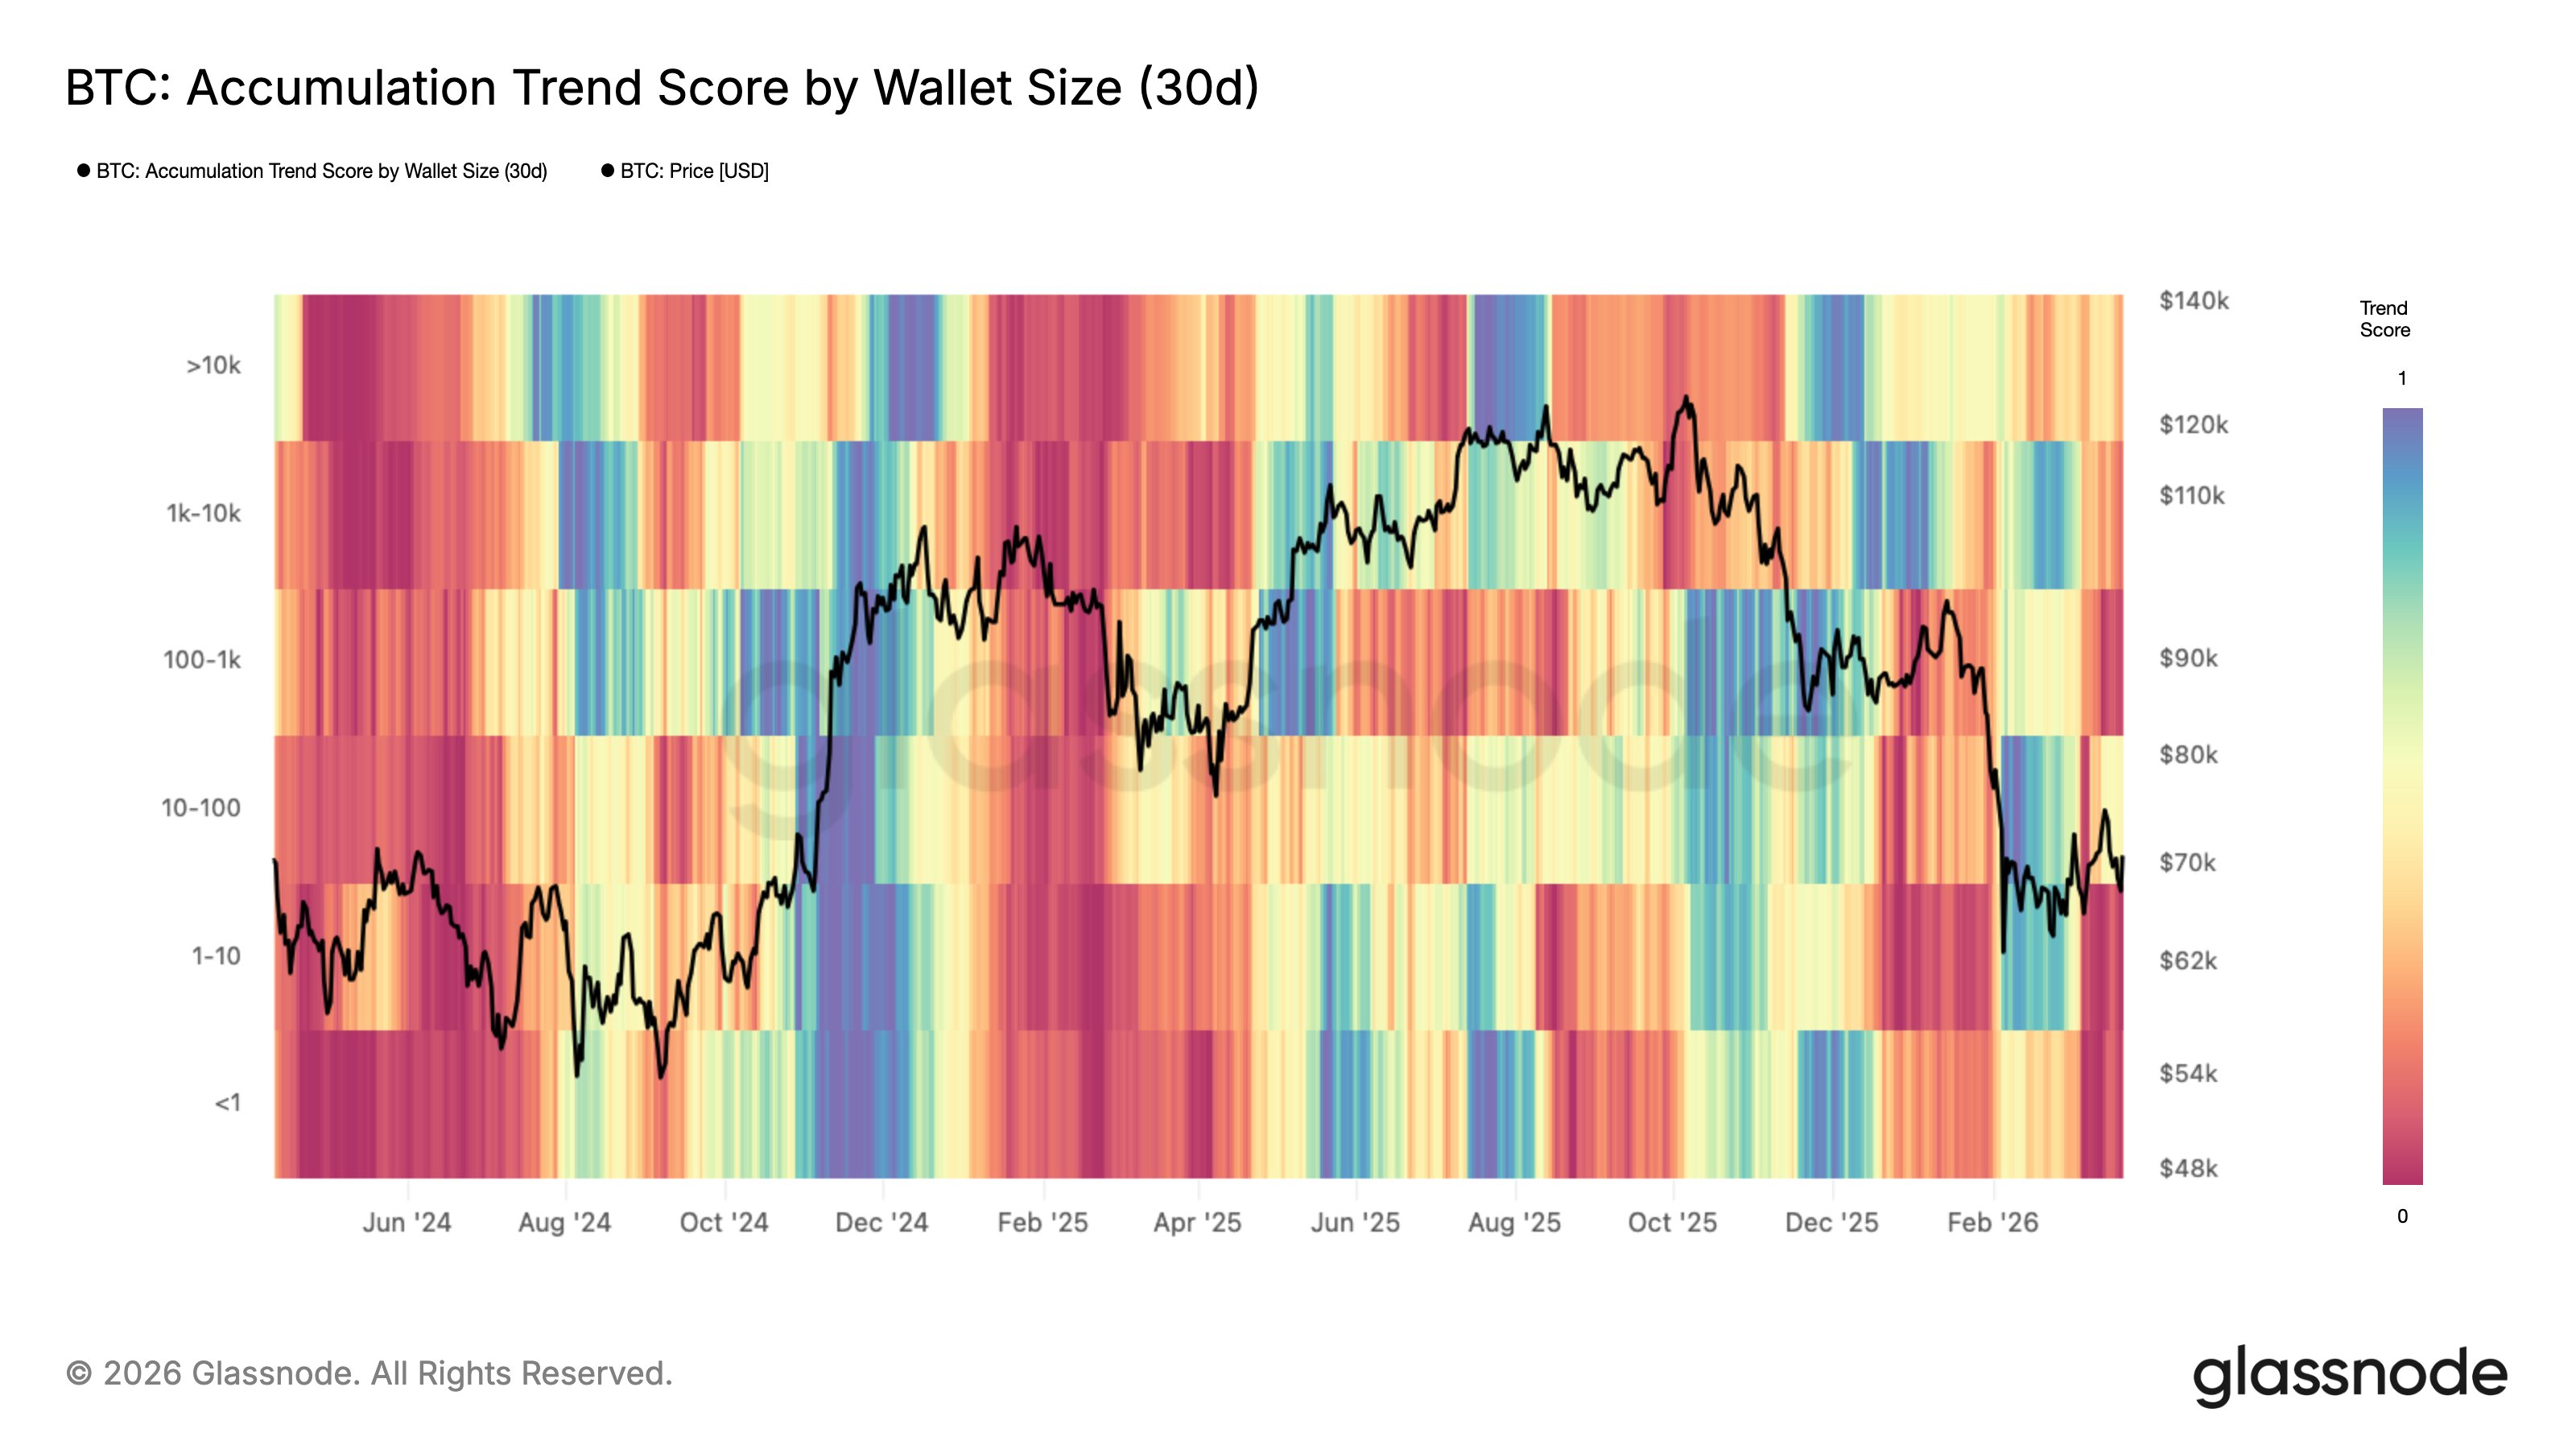
The value of the metric seems to have been red for most of the groups in recent days | Source: Glassnode on X

The orange-red levels for all Bitcoin groups indicate that investor behavior has leaned toward distribution recently. In contrast, some cohorts were participating in accumulation following the price crash in February.

BTC Price

At the time of writing, Bitcoin is floating around $70,900, up more than 2% over the last 24 hours.

The trend in the price of the coin over the last five days | Source: BTCUSDT on TradingView

Related Questions

QWhat is the current trend of CryptoQuant's Bitcoin Network Activity Index and what does it suggest?

ACryptoQuant's Bitcoin Network Activity Index has been in a steady downtrend and is stuck below its 365-day moving average, suggesting that demand for using the Bitcoin blockchain remains weak and that the market is in a bearish phase.

QWhich specific on-chain metrics are combined to form CryptoQuant's Network Activity Index?

AThe index combines several activity-related metrics, including active addresses (both receiving and sending), transactions (total and per block), UTXO count, and bytes per block.

QWhat does the Accumulation Trend Score by Wallet Cohort from Glassnode indicate about recent investor behavior?

AGlassnode's Accumulation Trend Score has been at neutral or red values across all Bitcoin investor groups recently, indicating that investor behavior has leaned toward distribution rather than accumulation.

QDespite the declining network activity, what was notable about Bitcoin's price performance in 2025?

ADespite the declining network activity, Bitcoin observed a rally to new all-time highs (ATHs) during 2025.

QWhat is the current price of Bitcoin mentioned in the article?

AAt the time of writing, Bitcoin is floating around $70,900, up more than 2% over the last 24 hours.

Related Reads

Bitcoin Monthly Chart Adjustment Structure Established, HYPE Entry Opportunity Emerges | Exclusive Analysis

Bitcoin Monthly Correction Structure Confirmed, HYPE Entry Opportunity Emerges | Guest Analysis Last week's analysis correctly identified that the $60,000 level for Bitcoin was an intermediate point, not the bottom of the current correction. This was validated on June 5th when the price broke below this key support, dropping to around $59,100. The monthly-level a-b-c three-wave corrective structure from the October 2025 high of $126,200 is now fully established, with the market currently in the c-wave decline phase. The cumulative adjustment time is less than 35 days, indicating the structure is far from complete. This week's focus will be tracking the rebound's strength and resistance performance. The two key resistance zones of $65,000 and $69,500~$70,500 will be crucial observation points for determining the subsequent trend. For HYPE, last week's top warning signal was also validated, with the price falling up to 27% from its $75.87 high. The token has now entered a support zone, presenting a potential short-term entry opportunity. From a strategic standpoint, the medium-term outlook remains bearish, awaiting optimal timing to add short positions upon a rebound. **Key Trading Views Summary:** * **BTC:** The analysis maintains a bearish medium-term bias. Strategy involves building short positions on rebounds towards $65,000 or the $69,500~$70,500 resistance area. A break below the $59,000-$60,000 support could trigger additional short entries. Short-term trading (30% capital) focuses on range-bound opportunities. * **HYPE:** Following a confirmed correction from the $75.87 high, the short-term strategy shifts to "buying on dips." Consider light long positions (under 30%仓位) if the price finds support and shows stabilization signals in the $55-$57 or deeper $47-$49 support zones, contingent on confirming technical signals. The key resistance to watch is the $62.5-$64.57 area. **Risk Management Reminder:** Always set an initial stop-loss immediately upon opening a position. Move the stop-loss to breakeven upon achieving 1% profit, and subsequently trail it to lock in gains. Market conditions change rapidly; this analysis is for informational purposes only and not investment advice.

marsbit13m ago

Bitcoin Monthly Chart Adjustment Structure Established, HYPE Entry Opportunity Emerges | Exclusive Analysis

marsbit13m ago

Valuation Surpasses 200 Billion, Kimi Reportedly Raises 13.6 Billion More, Speeds Up Hong Kong IPO

Beijing-based AI unicoth MoonDark (Kimi) is reportedly in talks for a new funding round aiming to raise up to $20 billion (approximately RMB 136 billion), targeting a post-money valuation of $300 billion (approximately RMB 2.035 trillion). If successful, this would mark its third round in six months and a six-fold increase from its $43 billion valuation in December last year. Last month, the company completed a $20 billion funding round led by Meituan Longzhu, reaching a valuation exceeding $200 billion. According to reports, MoonDark has raised over RMB 376 billion across six rounds, making it the most funded large language model startup in China. Founded in 2023 by CEO Yang Zhilin, the company's core product is the Kimi AI Assistant. In April, it launched and open-sourced its flagship model, Kimi K2.6, which has demonstrated performance comparable to top models like GPT-5.4 in certain benchmarks. Recently, it began beta testing for Kimi Work, a local AI agent for knowledge workers. Commercially, the company's Annual Recurring Revenue (ARR) reportedly surpassed $2 billion in April. Regarding its IPO plans, Bloomberg reported in March that MoonDark is preparing for a listing in Hong Kong, though the process remains in early stages. The funding and IPO pace for leading Chinese AI firms has accelerated notably in 2026, mirroring global trends where companies like OpenAI and Anthropic are also setting new fundraising and valuation records. Securing substantial capital is becoming a critical factor in the competitive landscape alongside model capabilities.

marsbit16m ago

Valuation Surpasses 200 Billion, Kimi Reportedly Raises 13.6 Billion More, Speeds Up Hong Kong IPO

marsbit16m ago

South Korea's KOSPI Plunges 8.37% at Opening, Triggers Circuit Breaker: The 'Two Stocks' That Powered the Bull Market Recoil in a Single Day

On June 8th, South Korea's KOSPI index plunged 8.37% within minutes of market open, triggering a circuit breaker and halting trading. The crash was driven by a massive sell-off in heavyweight stocks Samsung Electronics and SK Hynix, which each fell 10%. These two chip giants alone account for over half of the KOSPI's total market capitalization and had contributed roughly 70% of the index's gains year-to-date, pushing it to become the world's sixth-largest stock market. The sell-off was ignited by negative guidance from U.S. chipmaker Broadcom on June 3rd, which sparked a global semiconductor stock rout. This shockwave hit South Korean markets on June 5th, with foreign investors leading a sustained exodus. The sharp decline on June 8th was exacerbated by high levels of retail margin debt (over 38 trillion KRW), forced liquidations, leveraged ETFs tied to the top stocks, and automated program trading, creating a vicious cycle. The Korean won also weakened significantly, further fueling foreign capital outflow. South Korean authorities issued emergency statements to calm markets, echoing recent warnings from the central bank governor about the risks of debt-driven investing. While some institutions like Goldman Sachs maintain long-term bullish targets for the KOSPI, the crash exposed the extreme market concentration and fragility behind its historic rally.

marsbit18m ago

South Korea's KOSPI Plunges 8.37% at Opening, Triggers Circuit Breaker: The 'Two Stocks' That Powered the Bull Market Recoil in a Single Day

marsbit18m ago

The Compounding Crisis in an Era of High Valuations: Is the US Stock Market Facing a New 'Lost Decade'?

This article analyzes the long-term structural risks in US equity markets, challenging the assumption that "time in the market" always ensures positive returns. Drawing on 155 years of historical data, it identifies three prolonged periods—1929-1954, 1966-1982, and 2000-2013—where real buy-and-hold returns were near zero or negative. Collectively, these "lost decades" represent roughly 35% of market history since 1871 and cause not just delayed wealth accumulation but permanent damage to compound growth paths due to the mathematics of recovering from significant drawdowns. Crucially, the authors argue that current conditions mirror historical precursors to such phases. Multiple valuation indicators, including the CAPE ratio (near its 99th percentile), the Buffett Indicator, and Tobin's Q, signal extreme overvaluation, historically associated with lower future 10-year real returns (averaging 3.6%). The paper debunks the common objection to tactical management—fear of missing the "best days" in the market—by showing that the vast majority of these top-performing days occur during bear markets and crises, often adjacent to the worst days. Therefore, avoiding major drawdowns inherently means missing these volatile surges. A key framework proposed involves monitoring market breadth (advance/decline data), which tends to deteriorate before major indices peak, providing an early warning signal. Combined with high valuations, breadth analysis offers a more robust risk-assessment tool. The conclusion for investors and advisors is not a forecast of an inevitable downturn, but a call to move from complacency to preparedness. The empirical evidence suggests that the conditions preceding lost decades are identifiable. A disciplined, adaptive strategy focused on valuation and breadth signals, rather than precise timing, can help protect long-term compounding from permanent impairment.

marsbit36m ago

The Compounding Crisis in an Era of High Valuations: Is the US Stock Market Facing a New 'Lost Decade'?

marsbit36m ago

Trading

Spot
Futures

Hot Articles

What is $BITCOIN

DIGITAL GOLD ($BITCOIN): A Comprehensive Analysis Introduction to DIGITAL GOLD ($BITCOIN) DIGITAL GOLD ($BITCOIN) is a blockchain-based project operating on the Solana network, which aims to combine the characteristics of traditional precious metals with the innovation of decentralized technologies. While it shares a name with Bitcoin, often referred to as “digital gold” due to its perception as a store of value, DIGITAL GOLD is a separate token designed to create a unique ecosystem within the Web3 landscape. Its goal is to position itself as a viable alternative digital asset, although specifics regarding its applications and functionalities are still developing. What is DIGITAL GOLD ($BITCOIN)? DIGITAL GOLD ($BITCOIN) is a cryptocurrency token explicitly designed for use on the Solana blockchain. In contrast to Bitcoin, which provides a widely recognized value storage role, this token appears to focus on broader applications and characteristics. Notable aspects include: Blockchain Infrastructure: The token is built on the Solana blockchain, known for its capacity to handle high-speed and low-cost transactions. Supply Dynamics: DIGITAL GOLD has a maximum supply capped at 100 quadrillion tokens (100P $BITCOIN), although details regarding its circulating supply are currently undisclosed. Utility: While precise functionalities are not explicitly outlined, there are indications that the token could be utilized for various applications, potentially involving decentralized applications (dApps) or asset tokenization strategies. Who is the Creator of DIGITAL GOLD ($BITCOIN)? At present, the identity of the creators and development team behind DIGITAL GOLD ($BITCOIN) remains unknown. This situation is typical among many innovative projects within the blockchain space, particularly those aligning with decentralized finance and meme coin phenomena. While such anonymity may foster a community-driven culture, it intensifies concerns about governance and accountability. Who are the Investors of DIGITAL GOLD ($BITCOIN)? The available information indicates that DIGITAL GOLD ($BITCOIN) does not have any known institutional backers or prominent venture capital investments. The project seems to operate on a peer-to-peer model focused on community support and adoption rather than traditional funding routes. Its activity and liquidity are primarily situated on decentralized exchanges (DEXs), such as PumpSwap, rather than established centralized trading platforms, further highlighting its grassroots approach. How DIGITAL GOLD ($BITCOIN) Works The operational mechanics of DIGITAL GOLD ($BITCOIN) can be elaborated on based on its blockchain design and network attributes: Consensus Mechanism: By leveraging Solana’s unique proof-of-history (PoH) combined with a proof-of-stake (PoS) model, the project ensures efficient transaction validation contributing to the network's high performance. Tokenomics: While specific deflationary mechanisms have not been extensively detailed, the vast maximum token supply implies that it may cater to microtransactions or niche use cases that are still to be defined. Interoperability: There exists the potential for integration with Solana’s broader ecosystem, including various decentralized finance (DeFi) platforms. However, the details regarding specific integrations remain unspecified. Timeline of Key Events Here is a timeline that highlights significant milestones concerning DIGITAL GOLD ($BITCOIN): 2023: The initial deployment of the token occurs on the Solana blockchain, marked by its contract address. 2024: DIGITAL GOLD gains visibility as it becomes available for trading on decentralized exchanges like PumpSwap, allowing users to trade it against SOL. 2025: The project witnesses sporadic trading activity and potential interest in community-led engagements, although no noteworthy partnerships or technical advancements have been documented as of yet. Critical Analysis Strengths Scalability: The underlying Solana infrastructure supports high transaction volumes, which could enhance the utility of $BITCOIN in various transaction scenarios. Accessibility: The potential low trading price per token could attract retail investors, facilitating wider participation due to fractional ownership opportunities. Risks Lack of Transparency: The absence of publicly known backers, developers, or an audit process may yield skepticism regarding the project's sustainability and trustworthiness. Market Volatility: The trading activity is heavily reliant on speculative behavior, which can result in significant price volatility and uncertainty for investors. Conclusion DIGITAL GOLD ($BITCOIN) emerges as an intriguing yet ambiguous project within the rapidly evolving Solana ecosystem. While it attempts to leverage the “digital gold” narrative, its departure from Bitcoin's established role as a store of value underscores the need for a clearer differentiation of its intended utility and governance structure. Future acceptance and adoption will likely depend on addressing the current opacity and defining its operational and economic strategies more explicitly. Note: This report encompasses synthesised information available as of October 2023, and developments may have transpired beyond the research period.

363 Total ViewsPublished 2025.05.13Updated 2025.05.13

What is $BITCOIN

Discussions

Welcome to the HTX Community. Here, you can stay informed about the latest platform developments and gain access to professional market insights. Users' opinions on the price of BTC (BTC) are presented below.

活动图片