Bessente Eyes TGA Trillion for Bond Buys, Oil Prices and Bond Yields Both Drop, AI Hardware Continues to Plunge with NVIDIA's Seven-Day Losing Streak, Gold, Dollar, Bitcoin All Rise

华尔街日报Published on 2026-08-24Last updated on 2026-08-24

Abstract

Biden's Treasury Considers Using $1 Trillion TGA to Fund Debt Buys, Yields and Oil Fall. AI Hardware Selloff Persists as Nvidia Logs Longest Losing Streak Since 2022. Gold, Dollar, and Bitcoin Rise Amid Safe-Haven Flows. U.S. stocks showed significant divergence. The Nasdaq led losses, falling 0.76%, pressured by a continued selloff in AI hardware stocks. Nvidia fell for a seventh consecutive session, its longest losing streak since September 2022, with storage and optical communication sectors hit hard. In contrast, the Dow Jones Industrial Average rose 0.26%, supported by gains in defensive financial and consumer staples stocks like JPMorgan Chase and Walmart. Major tech platforms like Meta and Amazon also showed relative resilience. Across assets, bond yields and oil prices declined concurrently with gains in gold, the U.S. dollar, and Bitcoin, reflecting a tug-of-war between fiscal sustainability concerns and geopolitical safe-haven demand. The 10-year Treasury yield fell about 3 basis points to 4.70%. The market focus is on a "critical week" ahead, featuring Nvidia's earnings, Fed Chair Wash's Jackson Hole speech, and the July core PCE data, which may amplify volatility.

Meanwhile, funds flowed out of the AI hardware sector and into safe-haven assets such as gold and Bitcoin, with spot gold rising 1.05% to a near three-month high and Bitcoin once approaching $80,000 intraday.
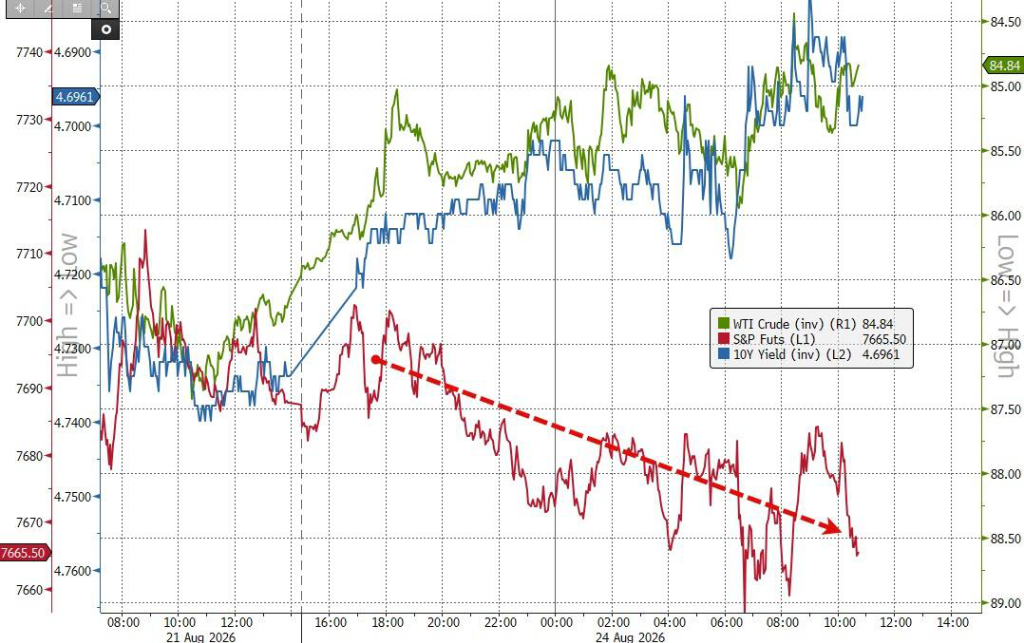
There was a clear divergence within U.S. stocks. The heavy slump in AI hardware stocks dragged down the Nasdaq to lead the decline, with NVIDIA falling for the seventh consecutive session, marking its longest losing streak since September 2022. Memory and optical communication were the hardest-hit areas.

The Dow Jones, however, managed a two-day rally against the trend, supported by defensive stocks in financials and consumer staples. Walmart rose 2.69% and JPMorgan Chase rose 1.37%. Among mega-cap tech stocks, Meta rose 1.66% and Amazon rose 1.33%, also showing resilience.

Cross-asset, the simultaneous decline in bond yields and oil prices coexisted with the rise of gold, the U.S. dollar, and Bitcoin, reflecting a tug-of-war between concerns over fiscal sustainability and geopolitical safe-haven demand. The U.S. Dollar Index edged up 0.20% to 98.93, still below the 99 mark.

This week is a "critical week" with NVIDIA's earnings report after the close on Wednesday, Fed Chair Wash's speech at Jackson Hole on Friday, and the release of July core PCE data, which may amplify market volatility.

AI Hardware Continues Plunge, NVIDIA's Seven-Day Losing Streak Longest Since 2022, Nasdaq Leads Decline

AI hardware stocks continued their plunge, dragging down U.S. stock trading on Monday. The Nasdaq closed down 0.76% at 25,980.19 points, leading the decline among the three major indices, while the Philadelphia Semiconductor Index fell nearly 4%.

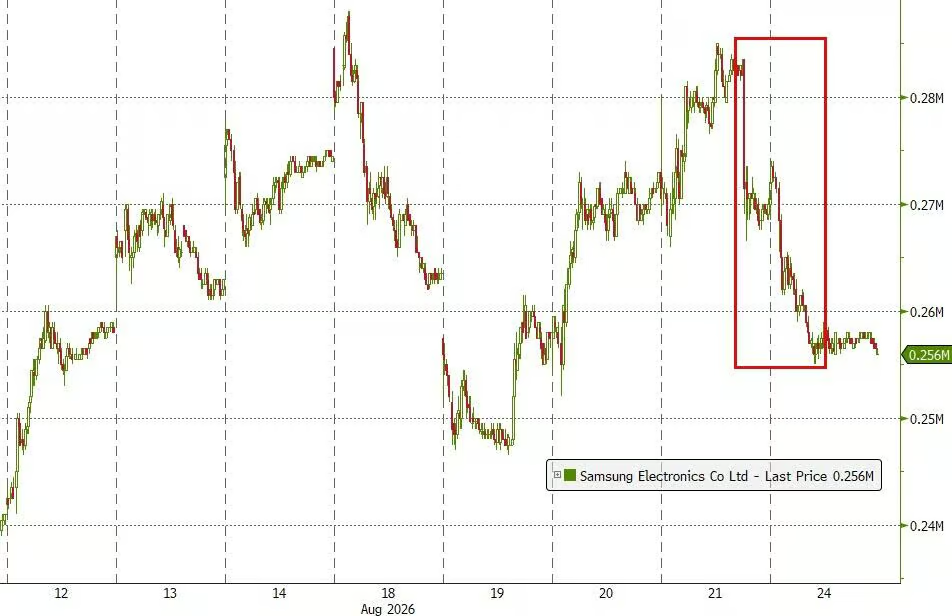
Samsung Electronics' weekend slump of over 8% due to a shareholder return plan falling short of expectations became the trigger for the continued plunge in memory chip stocks on Monday.
NVIDIA extended its risk-off sell-off ahead of earnings, closing down 2.91% at $208.48, marking its seventh consecutive day of decline and its longest losing streak since September 2022. The cumulative decline over this period reached about 7%, while its credit default swap spread also rose to a record high.

Memory and optical communication sectors were the hardest hit. SanDisk closed down 6.45%, Micron Technology fell 5.83%, Seagate Technology fell over 6%, and SK Hynix fell nearly 5%; Applied Optoelectronics plunged about 14% intraday after announcing its third ATM offering of $600 million this year, raising concerns about cash flow.

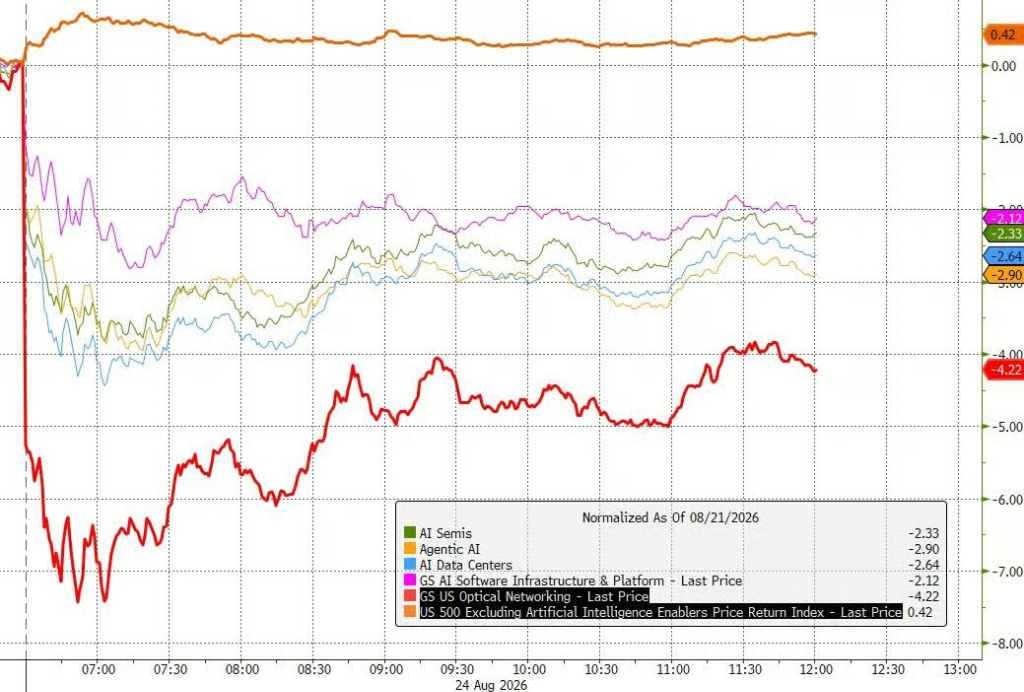
In the optical communication sector, Lumentum fell 4.22%, Coherent fell 4.85%, and Ciena fell 6.02%.
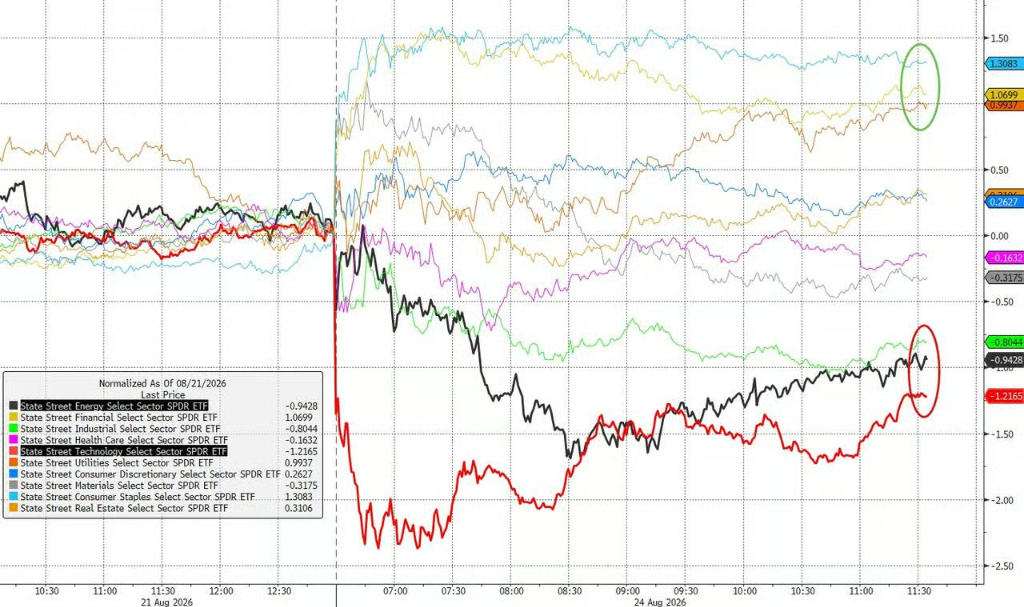
(Intraday gains/losses of eleven major sectors — Financials and Consumer Staples led gains, Technology and Energy led declines)

(All five AI sub-sectors — AI Semis, Agentic AI, AI Data Centers, AI Software, Optical Communication — declined, with Optical Communication leading the drop)

Broadcom's CDS hitting a new high intensified "phantom leverage" concerns. Broadcom closed down 2.63%. Its 5-year credit default swap price rose 28 basis points since August, surpassing the increases for Oracle and SpaceX. The yield on its bonds maturing in 2031 rose 14 basis points over the same period.

JPMorgan strategist Tarek Hamid warned that the off-balance-sheet credit support for the AI ecosystem, such as lease contracts, purchase commitments, and residual value guarantees, could ultimately reach "trillions of dollars."
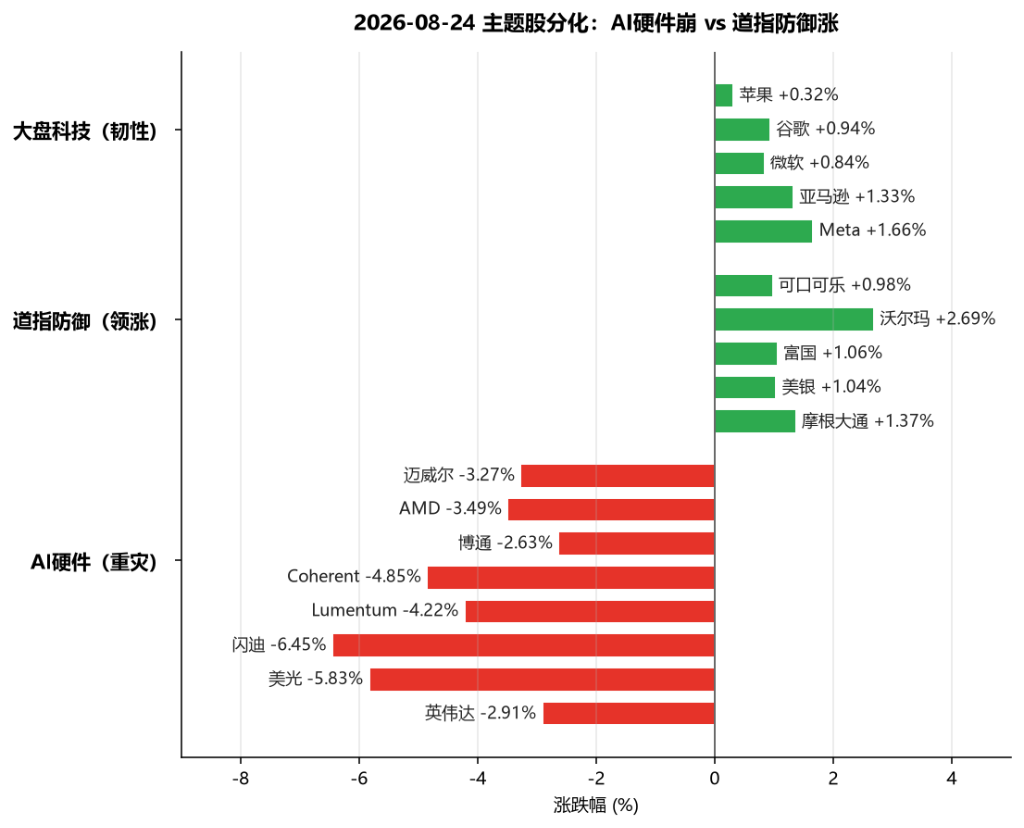
(Sharp contrast between the collective slump of AI hardware representative stocks (NVIDIA/Micron/SanDisk/Broadcom/AMD) and the resilience of Dow defensive stocks (JPMorgan/Walmart/Coca-Cola) and mega-cap tech (Meta/Amazon/Microsoft))

Adding pressure to the AI trade were cracks in fundamentals. On one hand, NVIDIA, due to soaring costs of memory chips like HBM, has notified hyperscale customers such as Microsoft, Google, and Oracle that AI server prices will increase by more than 15% starting next year.

On the other hand, the divergence between the Silicon Valley Data Center LLM token spending index and the S&P 500 excluding AI Enablers index indicates intensifying pressure from "unit cost collapse" facing AI software commercialization.

BTIG strategist Jonathan Krinsky highlighted near-term risks. The scenario where both Technology and Energy sectors fall more than 1% has occurred only 14 times in the past two years and only twice this year. The S&P 500 averaged a decline of 0.80% the next day with a 71.4% probability of decline. He suggested traders monitor whether a "day with over 80% of NYSE stocks declining" materializes to determine if it is a true de-risking move or a sector rotation.

Dow Gains Two Days Against Trend, Financials and Consumer Staples Lead, Mega-Cap Tech Relatively Resilient

Against the backdrop of declines in both the Nasdaq and the S&P 500, the Dow Jones Industrial Average rose 0.26% against the trend to close at 53,417.16 points, marking its second consecutive gain and refreshing a recent high.
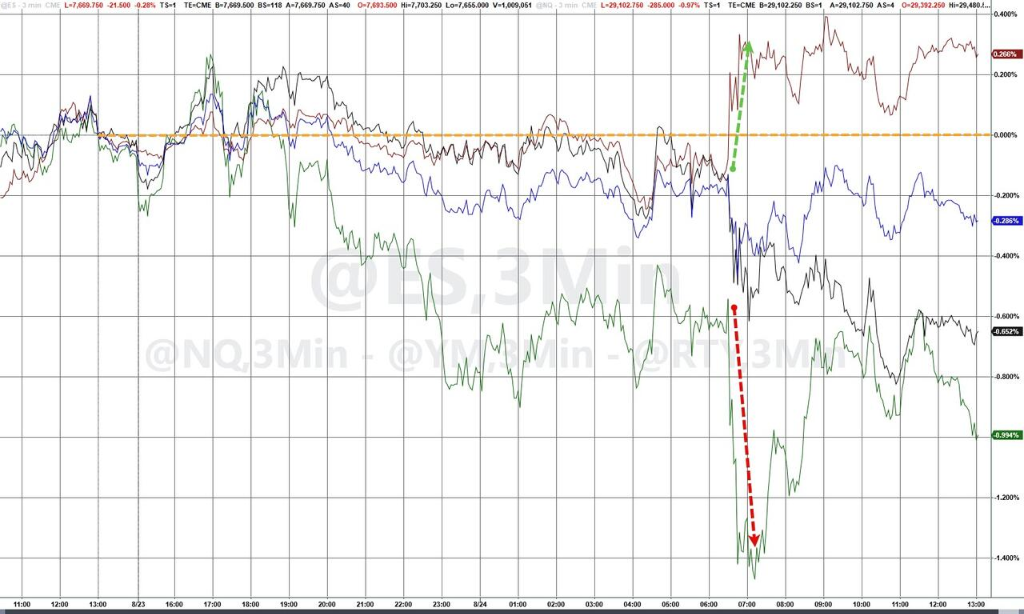
This was underpinned by a rotation of funds out of the AI hardware sector into defensive sectors like Financials and Consumer Staples, as well as into mega-cap tech leaders.

The Financials sector became the backbone of the Dow's gains. JPMorgan Chase closed up 1.37%, Bank of America rose 1.04%, and Wells Fargo rose 1.06%. The market anticipates Fed Chair Wash's Jackson Hole speech may signal a hawkish tilt, which could benefit banks' net interest margins.

The Consumer Staples sector also performed steadily, with Walmart closing up 2.69% to hit a recent high, and Coca-Cola up 0.98%. Barchart data shows its year-to-date gain of about 33% has outperformed the entire Mag 7 basket.

Mega-cap tech leaders performed starkly differently from AI hardware. Meta closed up 1.66%, Amazon rose 1.33%, Microsoft rose 0.84%, Google rose 0.94%, and Apple rose 0.32%. Funds flowing out of richly valued AI hardware sub-sectors like memory and optical communication moved into large tech platforms with stable cash flows and relatively reasonable valuations. Tesla bucked the trend, falling 3.83%, making it the weakest performer among the Mag 7.

The underlying logic of the sector rotation is internal divergence within the "AI trade." Concepts such as optical communication, memory chips, and HBM, which have been leading gains this year, are now facing the test of earnings delivery, while previously lagging financials, consumer staples, and cash-cow mega-cap tech are gaining relative appeal.

The intraday divergence among the eleven major sectors was clear — Financials gained about 1.07% and Consumer Staples rose 0.26% to lead gains, while the Technology sector fell 1.22% and the Energy sector fell over 1% to lead declines, highlighting a pronounced structural feature.

Bessente Eyes TGA Trillion for Bond Buys, Bond Yields and Oil Prices Both Drop

Bond yields and oil prices retreated simultaneously on Monday.

As mentioned by Wall Street News, U.S. Treasury Secretary Bessente said on Monday local time that the U.S. Treasury will conduct its next bond buyback operation on September 9 and hinted that subsequent operations will continue.

Earlier on Monday, U.S. media cited a Treasury official saying the U.S. Treasury is considering using funds from the Treasury General Account (TGA), which is close to $1 trillion in size, to fund its recently expanded Treasury bond buyback plan. However, the official did not disclose how much the Treasury would ultimately use or when it would begin. Related reports indicate the TGA's current size is approximately $950 billion.

The 10-year Treasury yield fell about 3 basis points intraday to 4.70%, the 30-year yield fell about 2 basis points to 5.25%, and the 2-year yield fell about 1 basis point to 4.22%, with the yield curve flattening notably.
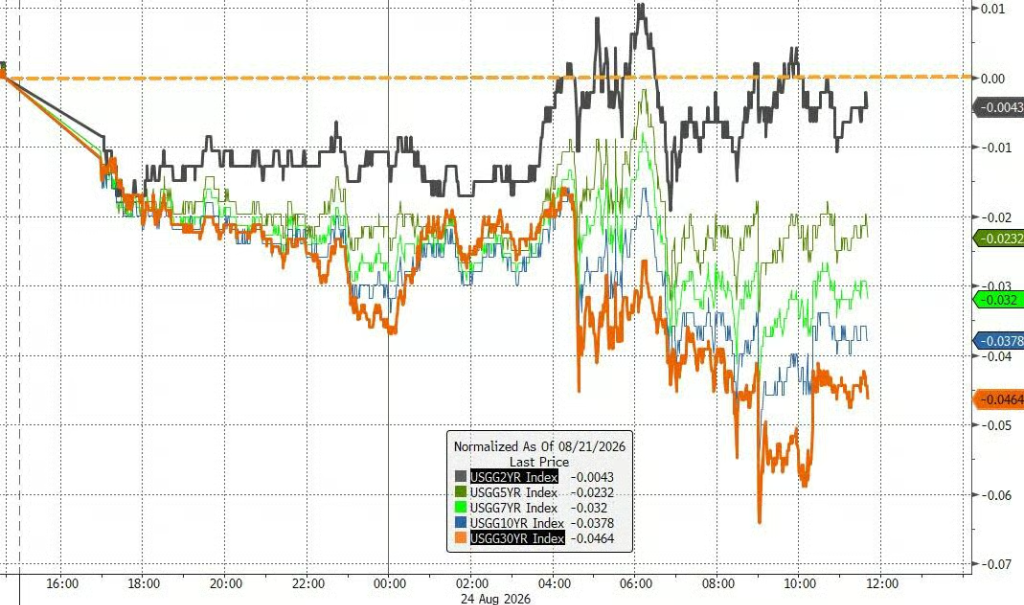
(2/5/7/10/30-year Treasury yields all declined intraday; 30-year fell -4.64bp most, 2-year fell -0.43bp least; curve clearly flattened)

However, the decline in bond yields provided limited relief to the AI sell-off. Morgan Stanley rates strategist Martin Tobias stated in a phone interview that the Treasury could raise $80 billion to $200 billion from the Fed's cash reserves to expand buybacks, which is precisely the "signal" Bessente wants to convey.

But Goldman Sachs strategists George Cole and William Marshall explicitly countered in an August 21 research report, "Treasury bond buybacks are unlikely to fundamentally reset interest rate levels," because the underlying causes of long-end volatility, such as U.S. economic resilience and the reassessment of the Fed's policy path, remain unresolved.

Societe Generale and Deutsche Bank similarly believe the yield curve will still steepen, which contradicts Bessente's goal of lowering long-end rates through bond purchases; Citi believes the 20-year Treasury may benefit the most from reduced auction sizes.

Related Questions

QAccording to the article, what is the main reason behind the significant drop in AI hardware stocks, specifically mentioning Nvidia's performance?

AThe main reasons behind the drop in AI hardware stocks and Nvidia's seven-day losing streak are: 1) Pre-earnings risk-off selling ahead of Nvidia's upcoming quarterly report. 2) A catalyst from Samsung Electronics' disappointing shareholder return plan, which triggered further declines in memory chip stocks. 3) Broader concerns within the AI ecosystem, including rising costs (e.g., HBM memory chip costs leading to server price hikes), pressure on AI software commercialization from 'unit cost collapse,' and worries about off-balance-sheet 'phantom leverage' commitments. 4) A sector rotation where funds are flowing out of high-valuation AI hardware into defensive and large-cap tech stocks.

QHow did the Dow Jones Industrial Average manage to rise while the Nasdaq and S&P 500 fell, and which sectors led this performance?

AThe Dow Jones Industrial Average rose due to a sector rotation where funds moved away from AI hardware stocks into more defensive sectors. The financial sector was the main driver, with stocks like JPMorgan Chase, Bank of America, and Wells Fargo gaining on expectations of a potentially hawkish signal from the Fed Chair, which could benefit bank net interest margins. The consumer staples sector also performed well, led by Walmart. Additionally, large-cap tech stocks like Meta, Amazon, and Microsoft showed relative resilience as funds flowed into companies with stable cash flows and relatively reasonable valuations.

QWhat action did US Treasury Secretary Beshent announce regarding bond repurchases, and what was the reported potential funding source for this plan?

AUS Treasury Secretary Beshent announced that the Treasury will conduct its next bond repurchase operation on September 9th and hinted at continuing such operations. According to media reports citing Treasury officials, the Treasury is considering using funds from the Treasury General Account (TGA), which currently holds around $950 billion, to fund the recently expanded bond buyback program. The potential scale of funds mentioned is close to $1 trillion, though no final details on the amount or timing were provided.

QWhat was the contrasting performance between 'safe-haven' assets like gold and Bitcoin compared to AI hardware stocks on the trading day described?

AThere was a stark contrast in performance. While AI hardware stocks crashed, funds flowed into traditional and digital safe-haven assets. Spot gold rose by 1.05%, hitting a nearly three-month high. Bitcoin surged intraday, approaching the $80,000 level. This movement occurred alongside a decline in bond yields and oil prices, reflecting a market environment characterized by a tug-of-war between concerns over fiscal sustainability and demand for geopolitical safe havens.

QWhat major market events does the article highlight for the 'critical week' ahead, and why might they increase volatility?

AThe article highlights three major events for the upcoming 'critical week' that could amplify market volatility: 1) Nvidia's earnings report after the market closes on Wednesday. 2) Federal Reserve Chair Wash's speech at the Jackson Hole symposium on Friday. 3) The release of the July core PCE inflation data. These events are crucial as they provide key insights into the health of the leading AI company (Nvidia), the future path of US monetary policy (Fed Chair's speech), and the persistence of inflation (PCE data), all of which are major drivers of current market sentiment and asset prices.

Related Reads

Is Bitcoin's Recent Surge a Blessing or a Trap?

Bitcoin recently surged from around $63,000 to almost $80,000. According to Glassnode, this rally is not solely due to low liquidity but driven by real capital inflows. Key factors include aggressive spot market buying, increased trading volumes, improved market depth, and significant institutional demand, as evidenced by high volumes and inflows into spot Bitcoin ETFs. Derivatives market data shows investors adopting more aggressive risk management, with strong perpetual futures buying. However, a substantial increase in futures open interest points to heightened speculative activity and leverage use. On-chain metrics support the bullish activity, with growth in active addresses and asset-adjusted transfer volume, indicating accelerated user and economic activity within the network. Investor profitability has also improved significantly, with both unrealized and realized profits rising well above historical averages. This is shifting investor behavior toward profit-taking rather than loss-selling. However, Glassnode cautions that the current market structure is not yet fully based on long-term capital accumulation. It notes that "hot capital," representing short-term, price-sensitive funds, is elevated, while macroeconomic-scale capital inflows remain relatively limited. The rally appears to be supported more by active short-term investors, tactical positioning, and growing speculative appetite than by sustained, long-term accumulation.

cryptonews.ru57m ago

Is Bitcoin's Recent Surge a Blessing or a Trap?

cryptonews.ru57m ago

Bitcoin Reaches $80,000: Three Arguments Against a Bull Market

Bitcoin reached $80,000 on August 24, 2026, a 38% rise from its July low of $57,800. While this surge is notable, analyst Rekt Capital presents three arguments against it signaling a true bull market reversal, suggesting it may instead be a rally within a broader bear market. First, if July 2026 was the bear market bottom, its formation time was 27% shorter than historical averages, a conclusion only valid if no new lower low forms by year-end. Second, Bitcoin broke down from a macro triangle pattern in July, but the subsequent ~30% drop was significantly smaller than the 48-62% declines seen after similar breakdowns in past cycles. Third, and crucially, the price has failed to break the long-term descending trendline from early 2025 highs, meaning Bitcoin is still making lower highs on macro timeframes, indicating underlying weakness. Rekt Capital notes the dynamic trendline resistance is near $79,000 this month, dropping to ~$76,300 next month. A monthly close below it could open the door for a correction. On weekly charts, resistance sits at $74.5k-$83.5k, with support at $62.5k-$68.5k. Adding another perspective, Crypto Rover highlights two key liquidation levels on Bitcoin's heatmap: a cluster of short positions at $80k-$90k (which could fuel a squeeze higher) and a concentration of long positions at $48k-$60k, acting as competing price "magnets." The article contrasts Rekt Capital's current cautious stance with his past calls in 2025, noting he correctly identified market direction but underestimated the scale of both the subsequent spring rally and the following autumn/winter decline. His current analysis again emphasizes macro weakness despite the recent price rise.

cryptonews.ru1h ago

Bitcoin Reaches $80,000: Three Arguments Against a Bull Market

cryptonews.ru1h ago

Trading

Spot
活动图片