Analyzing if ATOM’s price is ready for a 15% rally on the charts now

ambcryptoPublished on 2026-04-04Last updated on 2026-04-04

Abstract

ATOM, the native token of Cosmos, shows signs of potentially ending its prolonged bearish trend with a recent 5.25% price increase and a 13.22% surge in trading volume, indicating growing market interest. It has outperformed major cryptocurrencies like Bitcoin and Ethereum. A breakout from a falling wedge pattern suggests a possible 15% rally toward $1.98 if the price closes above $1.77, with further upside potential to $2.40. However, weak momentum is indicated by the low ADX value. The top 100 addresses increased holdings by 2.96%, and rising open interest and long leveraged positions reflect bullish sentiment among traders. A failure to hold above $1.77 could invalidate the bullish outlook.

ATOM, the native token of Cosmos, might be close to ending its prolonged bearish trend, one it has followed since 18 February 2025. In fact, thanks to a 5.25% price hike over the last 24 hours, ATOM broke out of a narrow range, opening the door for a massive move on the charts.

ATOM’s trading volume surged notably by 13.22% over the same period too. This suggested that market participants may be showing greater interest in ATOM’s prevailing market trend.

Data further revealed that following its most recent gains ATOM officially outperformed major cryptocurrencies like Bitcoin (BTC), Ethereum (ETH), XRP, and Solana (SOL) over the aforementioned period.

Is another potential 15% jump in the offing?

On the daily chart, the near-term bias for ATOM appeared bullish at press time. Especially after it broke out of a falling wedge pattern with a large green engulfing candle.

However, the price still needs to close a daily candle above the pattern to confirm the breakout. Otherwise, it may turn out to be a fakeout instead.

Source: TradingView

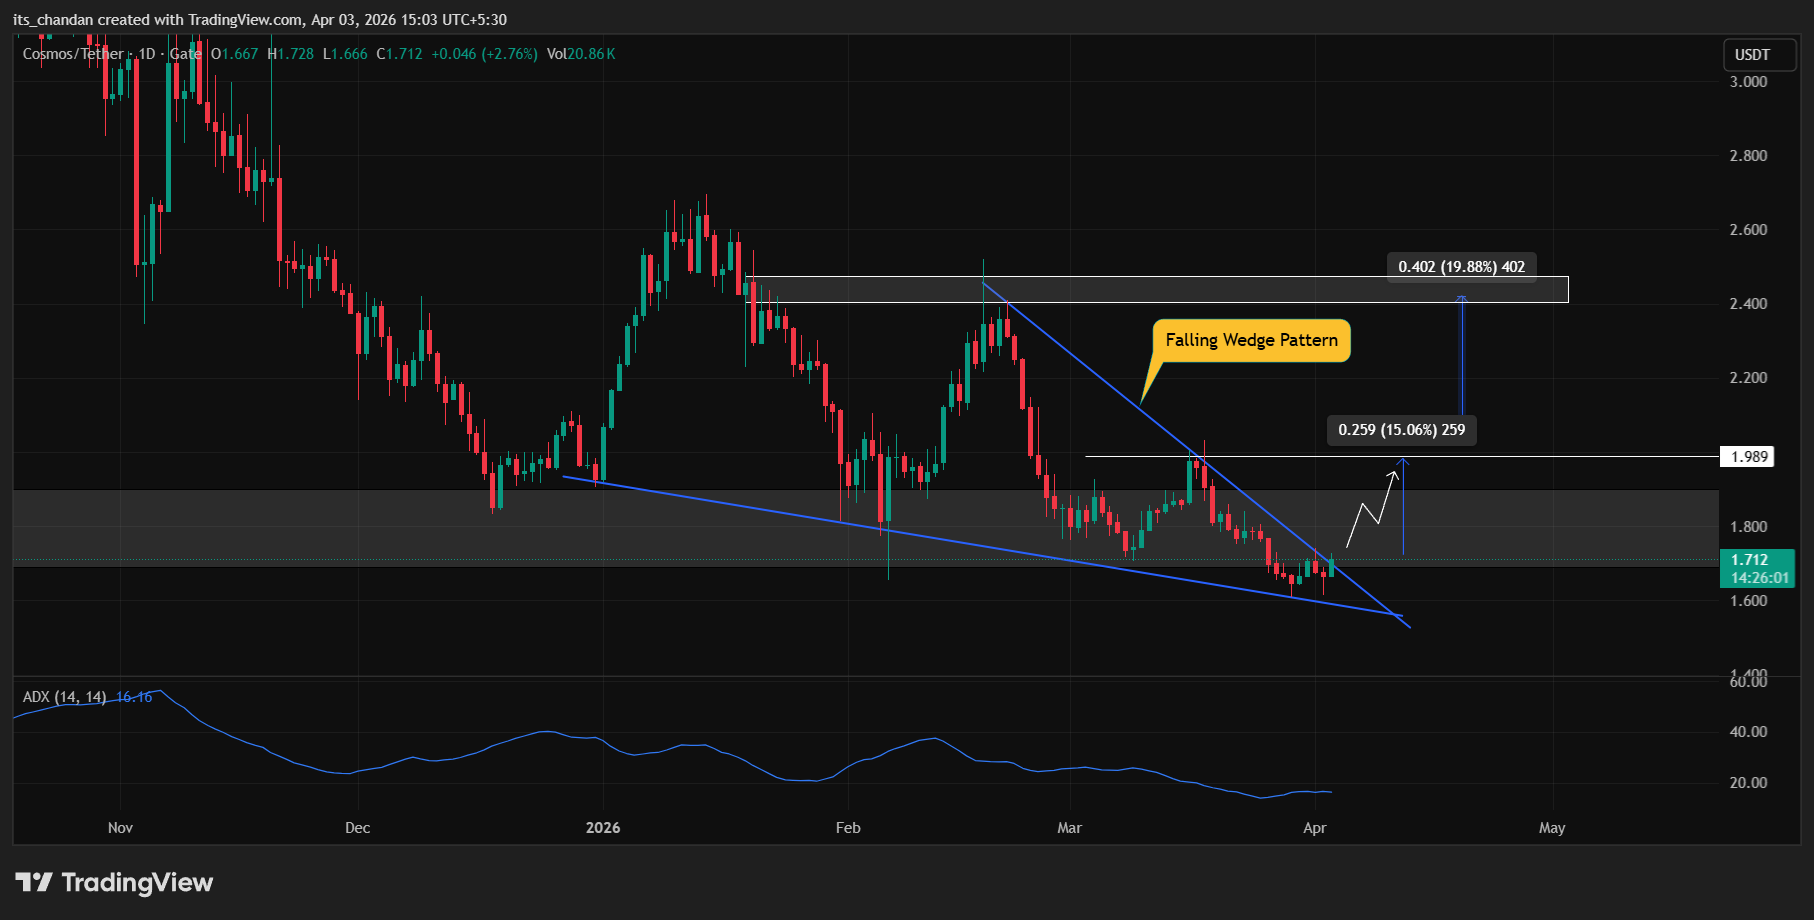
If ATOM closes its daily candle above the $1.77-level, it could see a price jump of over 15% and may reach the next resistance at $1.98. A breakout above this resistance could trigger another 20% rally, potentially pushing the price towards the $2.40-level.

However, this bullish thesis could be invalidated if ATOM’s price fails to close a daily candle above the $1.77-level.

At the time of writing, the technical indicator Average Directional Index (ADX) had fallen to 16.16, below the key threshold of 25. This hinted at weak momentum accompanying ATOM’s price.

Investors and traders’ sentiment turns bullish!

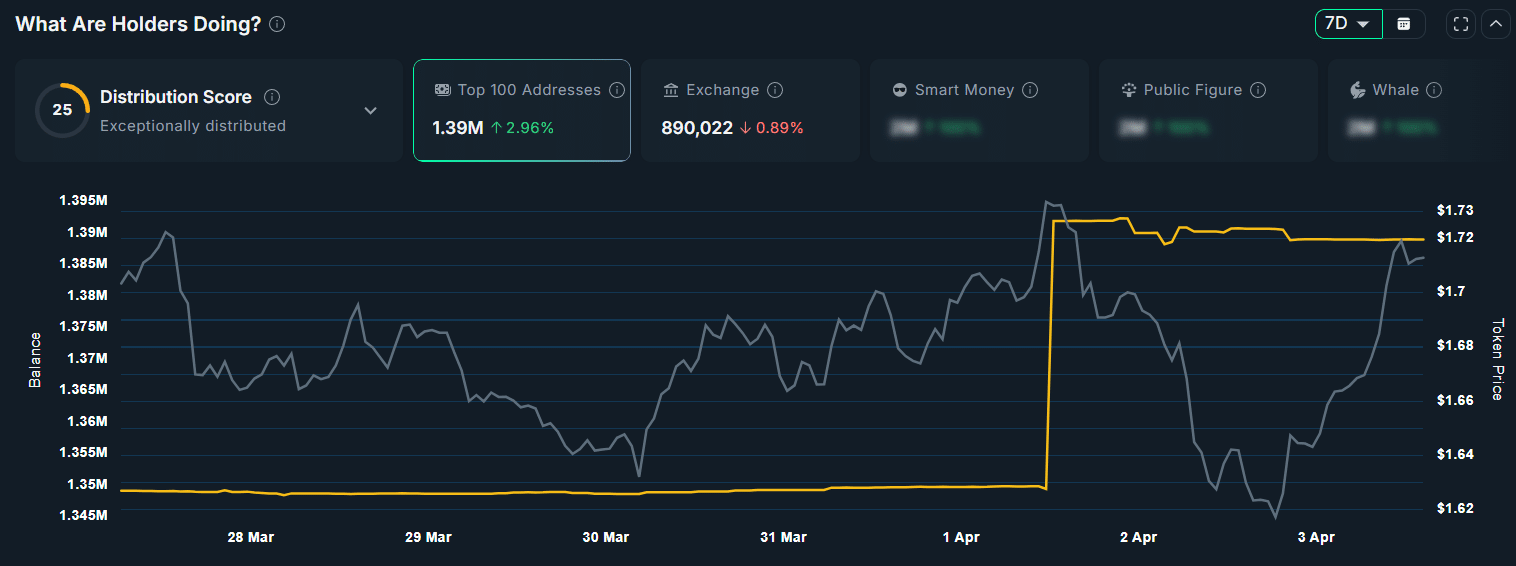
A look at analytics platform Nansen also revealed that the top 100 addresses may have already anticipated a move on ATOM’s price charts. Especially since they increased their holdings by 2.96% over the past few weeks alone.

Source: Nansen

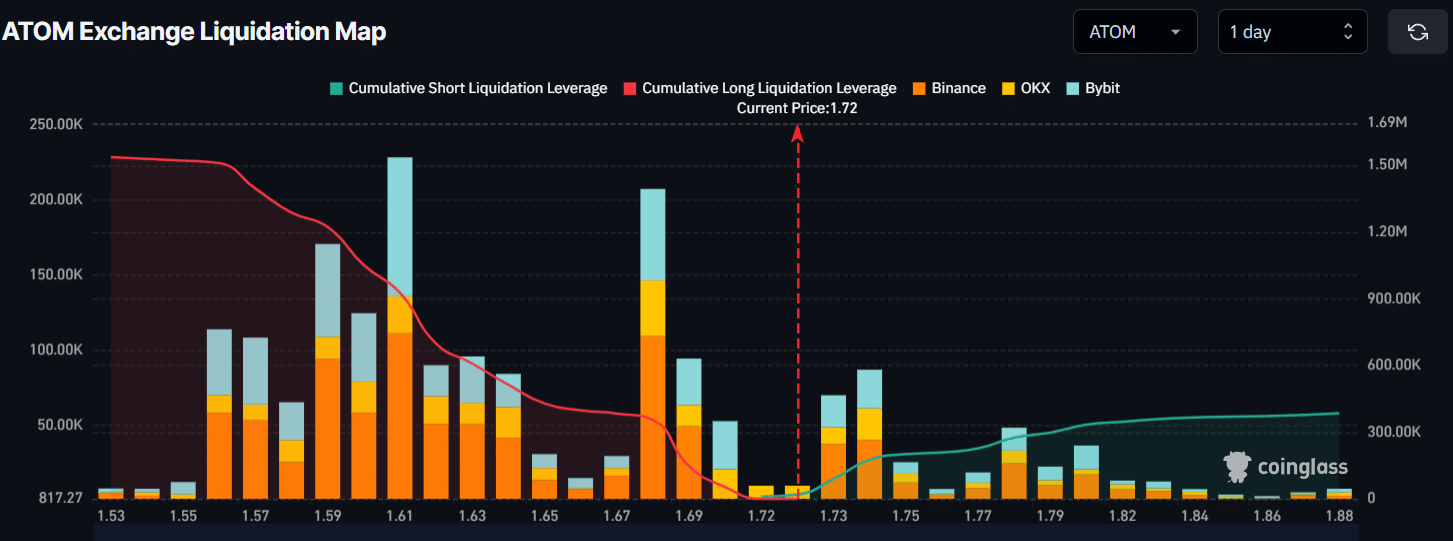
According to Coinglass, there has been significant interest among traders for ATOM too, with many now expecting the price to continue rising.

As far as ATOM’s exchange liquidation map is concerned, traders seemed to be highly active around the $1.61-level on the lower side (support) and $1.78 on the upper side (resistance). At these levels, they built $927.09K worth of long leveraged positions and $274.79K worth of short leveraged positions.

This suggested that bulls have been betting on further upside, while bears could just be exhausted.

Source: Coinglass

Finally, ATOM’s Open Interest (OI) increased by 3.57% to $124.82 million – A sign of rising trader participation and growing confidence in the altcoin’s momentum.


Final Summary

  • ATOM broke out of a bullish pattern, with the price action hinting at another 15% rally.
  • Top 100 addresses increased their holdings, with many traders now betting on long positions.

Related Questions

QWhat is the key price level that ATOM needs to close above to confirm a bullish breakout and potentially trigger a 15% rally?

AATOM needs to close a daily candle above the $1.77-level to confirm the breakout and potentially see a price jump of over 15%.

QAccording to the article, which major cryptocurrencies did ATOM outperform in terms of recent gains?

AATOM officially outperformed major cryptocurrencies like Bitcoin (BTC), Ethereum (ETH), XRP, and Solana (SOL) over the mentioned period.

QWhat does the ADX (Average Directional Index) value of 16.16 indicate about the strength of ATOM's price momentum?

AAn ADX value of 16.16, which is below the key threshold of 25, indicates that there is weak momentum accompanying ATOM's price movement.

QHow did the holdings of the top 100 addresses change, and what does this suggest about their expectations?

AThe top 100 addresses increased their ATOM holdings by 2.96% over the past few weeks, suggesting they anticipated a positive price move and were accumulating.

QWhat was the change in ATOM's Open Interest (OI), and what does this metric signify for trader sentiment?

AATOM's Open Interest increased by 3.57% to $124.82 million, which is a sign of rising trader participation and growing confidence in the altcoin's momentum.

Related Reads

AI "Transfer Station" Earning Millions Monthly? Five Questions Uncover the Truth of Token Arbitrage

The article "AI 'Transfer Station' Earns Millions Monthly? Five Questions Uncover the Truth of Token Arbitrage" explores the emerging business of API token transfer stations, which profit from global AI service price disparities and access barriers. These intermediaries purchase low-cost tokens from overseas AI providers (e.g., OpenAI, Claude) through grey-market methods—such as exploiting enterprise credits, bulk accounts, or subscription benefits—and resell them to Chinese users at a markup. Key drivers include the high cost of using top AI models (e.g., Claude Code costs ~$5 per million tokens), the performance gap between domestic and foreign models, and mismatches between subscription and API pricing. However, the practice carries significant risks: upstream token sources may be unstable or illegal; user data passing through intermediaries can be harvested or injected with hidden prompts; and models might be downgraded without disclosure. The market is evolving, with some operators now exporting cheaper Chinese models (e.g., Qwen3.5 at ~$0.11 per million tokens) to overseas users, leveraging price gaps. Yet, sustainability is low due to compliance crackdowns, instability, and reputational risks. Users are advised to employ detection methods (e.g., prompt adherence tests) and avoid sensitive data usage. The authors caution that while transfer stations offer short-term arbitrage, they lack long-term reliability and security compared to official APIs.

marsbit38m ago

AI "Transfer Station" Earning Millions Monthly? Five Questions Uncover the Truth of Token Arbitrage

marsbit38m ago

Trading

Spot
Futures

Hot Articles

Discussions

Welcome to the HTX Community. Here, you can stay informed about the latest platform developments and gain access to professional market insights. Users' opinions on the price of S (S) are presented below.

活动图片