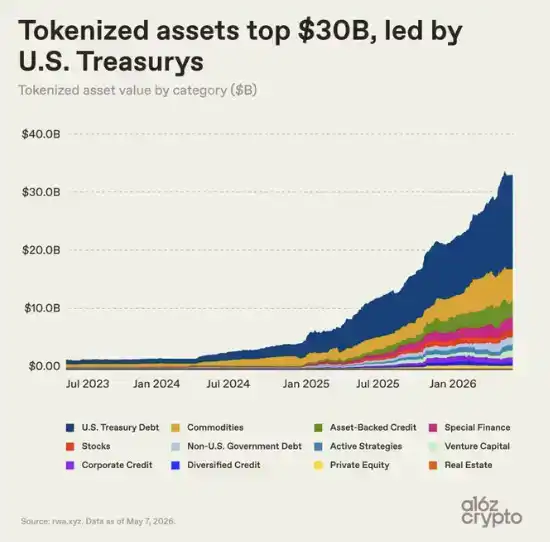
Editor's Note: RWA is moving from concept to real-world markets. According to statistics from a16z crypto, excluding stablecoins, the market size of tokenized assets has exceeded $30 billion and currently stands at approximately $34 billion. Compared to a market size of less than $3 billion in mid-2024, this market has grown tenfold in less than two years.
This round of growth has been primarily driven by U.S. Treasuries and gold. They have clear pricing, well-defined demand, and are easier to bring on-chain. For investors, tokenized Treasuries allow idle stablecoins to earn yield; for institutions, they mean more efficient settlement, collateral mobility, and access to digital financial markets.
But what's truly noteworthy in this article is not just that the RWA market has grown larger, but that it still has a long way to go before becoming a genuine "on-chain finance" system. Many of today's tokenized assets are essentially just digital receipts for off-chain assets, primarily used for holding and transferring, and have not yet become financial modules that can be freely combined, invoked, and reused within DeFi.
This means that the next phase of RWA is not just about tokenizing more assets, but about truly integrating these assets into the on-chain financial system. Whether it ultimately remains a digitized version of traditional finance or becomes part of the next generation of financial infrastructure is the more critical question moving forward.
The following is the original text:
The tokenized asset market—what some call "real world assets" (RWA)—surpassed $30 billion last month. Since then, the market size has remained above that level and is currently close to $34 billion. (This excludes stablecoins.) This market is roughly equivalent to the size of a regional bank or the endowment fund of a top-tier university; it is already large enough to have an impact but remains very small relative to the entire global financial system.
As recently as mid-2024, the tokenized asset market was less than $3 billion. Then, growth began to accelerate: The GENIUS Act brought a clearer regulatory framework for U.S. stablecoins; institutional-grade on-chain infrastructure matured; and a group of financial institutions almost simultaneously shifted from blockchain pilot projects to production-grade systems. (Although stablecoins are not included in this article's statistics, they have fueled overall market growth by making on-chain payments and settlement easier.)
Driven by these changes, the tokenized asset market grew tenfold in less than two years.
Tokenization Begins to Take Off
U.S. Treasuries have driven the bulk of recent market growth.
The appeal is straightforward: investors can hold a familiar, yield-bearing asset in a faster, more flexible, more digitally native form; while institutions benefit from more efficient settlement, collateral mobility, and integration with digital markets.
For crypto investors, tokenized U.S. Treasuries also offer a way to earn yield on idle stablecoins while gaining access to traditional money market yields. BlackRock, Franklin Templeton, and a growing number of asset managers are quickly responding to this demand, building a multi-billion dollar market around this logic.
Different categories of tokenized assets are expanding at vastly different speeds. This reflects both the complexity of bringing various asset classes on-chain and how quickly early products are finding market fit.
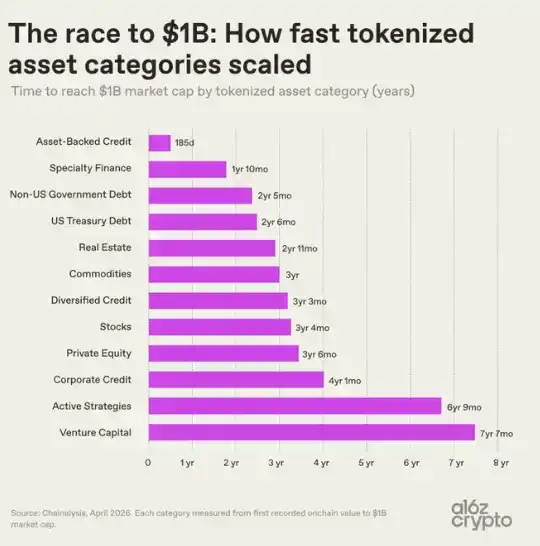
Asset-backed credit—including tokenized Home Equity Lines of Credit (HELOCs) and lending vault tokens—reached a $1 billion market capitalization in just 185 days after the first on-chain activity was recorded, the fastest among all tokenized asset categories, and by a significant margin.
Specialized finance products—such as tokenized reinsurance contracts and Bitcoin mining notes—are the second-fastest category, crossing the same threshold in less than two years.
On the other end, venture capital assets took over seven years to reach $1 billion, and active management strategies took nearly as long. This reflects the more complex structures, longer cycles, and higher operational and regulatory complexity of these assets.
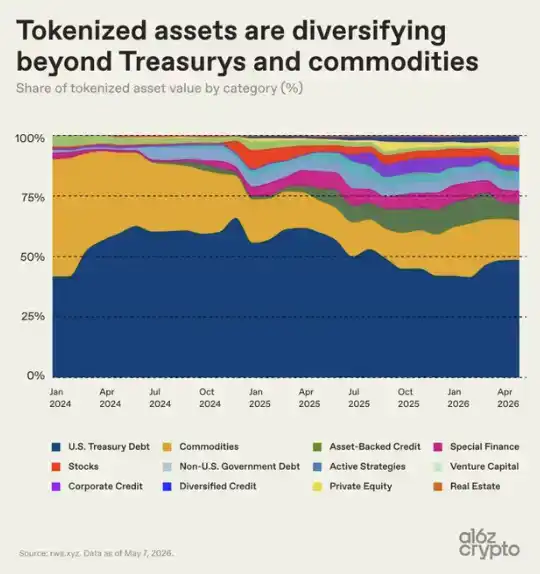
Government debt and commodities expanded relatively quickly, reaching $1 billion in about 2 to 3 years, and have since grown to become the most dominant categories. By early 2024, these two asset classes constituted nearly the entire tokenized asset market.
While other categories like asset-backed credit, specialized finance, equities, and active management strategies have steadily gained market share since 2024, the overall market remains highly concentrated. Today, tokenized U.S. Treasuries and commodities together account for about two-thirds of the market.
Deconstructing the Tokenized Asset Market Further
The concentration within the commodities category is even higher: gold accounts for virtually the entire market, with roughly $5 billion out of a total of $5.1 billion coming from gold. In contrast, products related to silver and others are almost negligible, with a total size of only $57.6 million, accounting for 0.01%.
Gold is naturally suited for tokenization: it has globally standardized properties, is easy to store, does not perish, and has long been traded via paper certificates. Crypto investors have also long felt an affinity for gold; long before tokenized gold products existed, Bitcoin was already called "digital gold." Products like Tether's XAUT and Paxos's PAXG have migrated a familiar ownership model onto blockchain infrastructure: certificates that represent ownership of gold in a vault have become tokens that can be held on-chain via wallets.
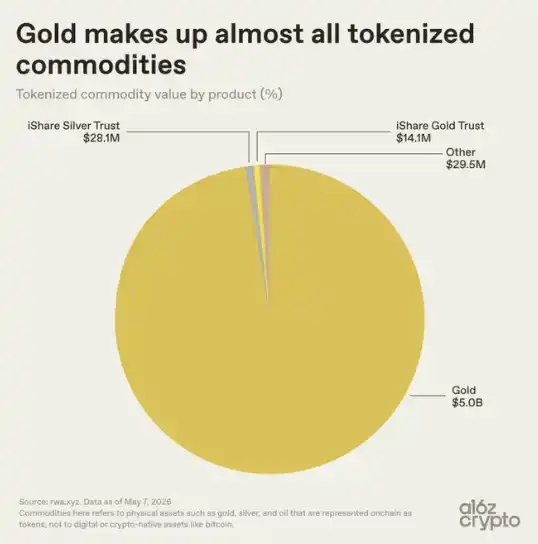
The market share of tokenized oil, agricultural products, and emerging categories like energy and computing power remains extremely low, all still in very early stages. For now, the tokenized commodities market is almost entirely a tokenized gold market.
As for the networks hosting the entire tokenized asset market, the landscape is more diverse. Ethereum still dominates, holding just over half of the market share, with a size of $15.7 billion. This aligns with its first-mover advantage in DeFi and institutional adoption.
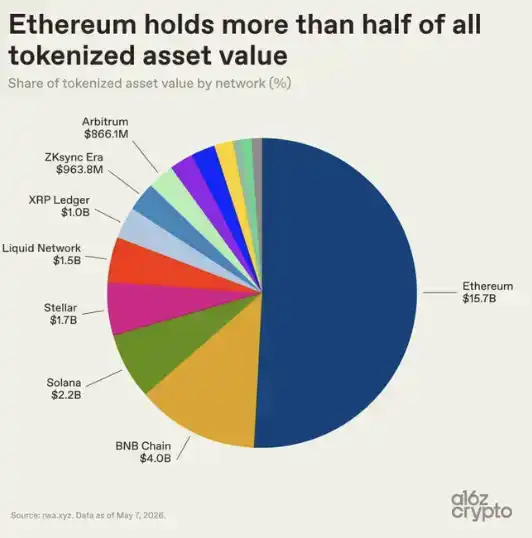
But the rest of the tokenized asset market has already become multi-chain: BNB Chain holds $4 billion, Solana $2.2 billion, Stellar $1.7 billion, and Liquid Network (a Bitcoin sidechain) $1.5 billion. XRP Ledger, ZKsync Era, and Arbitrum each approach $1 billion.
Tokenized assets have not converged on a single public chain but have dispersed across multiple blockchain ecosystems based on factors like cost, liquidity, compliance requirements, and go-to-market relationships.
However, the most enlightening data is not how large the tokenized asset market is, but how these assets are being used.
Most Tokenized Assets Are Not Truly "Composable"
Bonds are currently the largest category of tokenized assets, with a market capitalization of $15.2 billion. But only about 5% of their supply, roughly $800 million, is deployed in DeFi protocols.
Precious metals have similarly low utilization rates. Most of these assets are simply held on-chain, rather than being further expanded, restructured, or interoperated with other assets and protocols as composable financial building blocks.
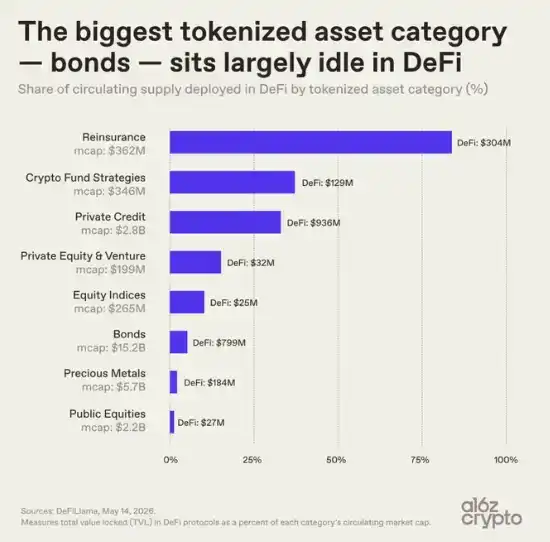
Smaller categories show different characteristics. Reinsurance tokens have a market capitalization of only $362 million, but 84% of their supply is deployed in DeFi; the figure for private credit is also 33%.
This data is not surprising: the categories with the highest DeFi utilization were designed for on-chain composability from the start, such as through protocols like Nexus Mutual and Maple Finance. In contrast, the largest tokenized asset categories—U.S. Treasuries and gold—were initially designed primarily to make familiar assets easier to hold and transfer on-chain, not to fundamentally change how they operate.
This difference points to a larger divide within the tokenized asset market: not all tokenized assets have an equal degree of "on-chain-ness."
Some assets can be freely transferred and used across various on-chain applications; others primarily use blockchain as a record-keeping infrastructure, with limited transferability and composability. (For example, RWA.xyz distinguishes between "distributed assets" and "representative assets.")
Much of what is called "tokenization" today is actually closer to digitization: just moving records onto a blockchain without truly unlocking composability. This is important because composability is one of the core value propositions of an on-chain financial system and what could make them more powerful.
Other attempts to measure "on-chain-ness" have reached similar conclusions. Pantera Capital's "Token Existence Index" scores tokenized assets based on how native they are on-chain, showing that over three-quarters of assets fall into the lowest tier. In practice, many tokenized assets function almost as digital receipts, representing claims on assets that are themselves still largely managed by off-chain ledgers and intermediaries.
This gap—between assets that are brought on-chain in a "form-fitting" way as digital records and those that are brought on-chain in a native way that leverages the unique properties of blockchain technology—is one of the clearest signals that the market is still in its early stages.
The infrastructure for composability exists, and the assets are there. But deeper integration is just beginning.
Where Tokenized Assets Are Headed
Looking ahead, institutions' predictions for the size of the tokenized asset market vary widely, but the direction is highly consistent: they all point to expansion.
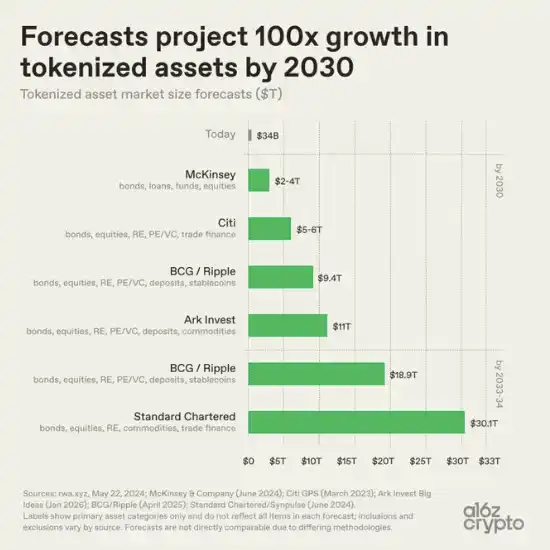
McKinsey's base case sees this market reaching $2 to $4 trillion by 2030. Ark Invest forecasts $11 trillion. BCG and Ripple project the market size to reach $9.4 trillion by 2030, rising to $18.9 trillion by 2033. Standard Chartered predicts this market will exceed $30 trillion by 2034.
Almost every major forecast implies roughly 100x growth from today's roughly $30 billion market size. Their divergence is mostly about scope.
The gap between $2 trillion and $30 trillion is less about differing judgments on adoption speed and more about differing definitions. Different institutions measure different things: which asset classes should be included, whether stablecoins and deposits are counted, how broadly tokenization should be defined, etc. McKinsey focuses primarily on bonds, loans, funds, and equities. Standard Chartered adds commodities and trade finance. BCG and Ripple include deposits and stablecoins alongside more traditional asset classes.
Despite methodological differences, the overall direction behind all predictions is consistent: asset tokenization is expected to expand far beyond today's market size.
Relative to the size of the global financial system, today's tokenized asset market is still just a tiny speck. The global bond market exceeds $140 trillion; tokenized bonds are about $15 billion, accounting for only about 0.01%. Above-ground gold is valued in the tens of trillions; tokenized gold is about $5 billion, constituting less than 0.02%. Global equity markets are valued well over $100 trillion; tokenized equities are about $1.5 billion, representing only about 0.001% of the underlying market.
But an emerging market has begun to take shape. The earliest successful categories are often the assets easiest to bring on-chain: U.S. Treasuries, gold, private credit, and other assets with clear pricing, pre-existing demand, and relatively simple ownership structures.
In most cases, tokenization has not reinvented these underlying assets. What it has changed is how these assets flow and settle, and it is only just beginning to connect them more directly to digital financial infrastructure. Much of today's tokenized asset market still resembles digitization more than true on-chain composability. Many assets exist on blockchain infrastructure but are not yet truly programmable financial building blocks.
The harder challenges ahead are bringing more complex parts of the financial system on-chain and integrating tokenized assets more deeply into a composable, internet-native financial infrastructure.
Acknowledgments: Thanks to Ryan Holloway for the helpful input, including the idea for the third chart.