Robinhood Layer 2 integration fuels 14% Uniswap price jump

ambcryptoPublished on 2026-07-03Last updated on 2026-07-03

Abstract

Uniswap has deployed its V2, V3, V4, and UniswapX protocols on the Robinhood Chain, a new Layer 2 network built by Robinhood Crypto, where Uniswap will serve as the automated market maker (AMM). The integration, aimed at programmatic and AI-driven ecosystems, sparked a 14.2% surge in the UNI token's price and an 81% increase in daily trading volume over 24 hours, buoyed by a broader 2.3% crypto market rally. Technical analysis reveals a contrasting long-term bearish trend. Despite the short-term bounce, the weekly chart shows UNI broke below the key $4 support level, which has now turned into resistance, with a recent swing low at $2.316 in early June. While the RSI has moved above 50, indicating momentum, the On-Balance Volume (OBV) has not recovered to June highs, suggesting a lack of sustained buying pressure. A Fibonacci retracement analysis places the current rally within a broader bearish structure. The liquidation heatmap shows a high concentration of leveraged short positions up to the $3.52 level, increasing the likelihood of a short-term price move towards $3.5. The analysis suggests traders could use a potential bounce to $3.5 or even $3.77 (the 78.6% retracement level) as a selling opportunity. The overall bearish bias remains intact unless UNI breaks above the $4.17 swing high. In summary, while the Robinhood news triggered a rally, it is viewed as a minor rebound within a dominant long-term downtrend.

Uniswap [UNI] announced that it has deployed v2, v3, v4, and UniswapX on the Robinhood Chain. This is a Layer 2 built by Robinhood Crypto, with Uniswap serving as the automated market maker [AMM].

The launch is geared toward programmatic, automated, and AI-driven ecosystems. This news has helped UNI token prices climb by 14.2% in the past 24 hours, and the daily trading volume has spiked by 81%.

The wider crypto market has made a 2.3% bounce in the past 24 hours, helping bolster short-term UNI sentiment. How much higher can this bounce go?

The pessimistic long-term view

Source: UNI/USDT on TradingView

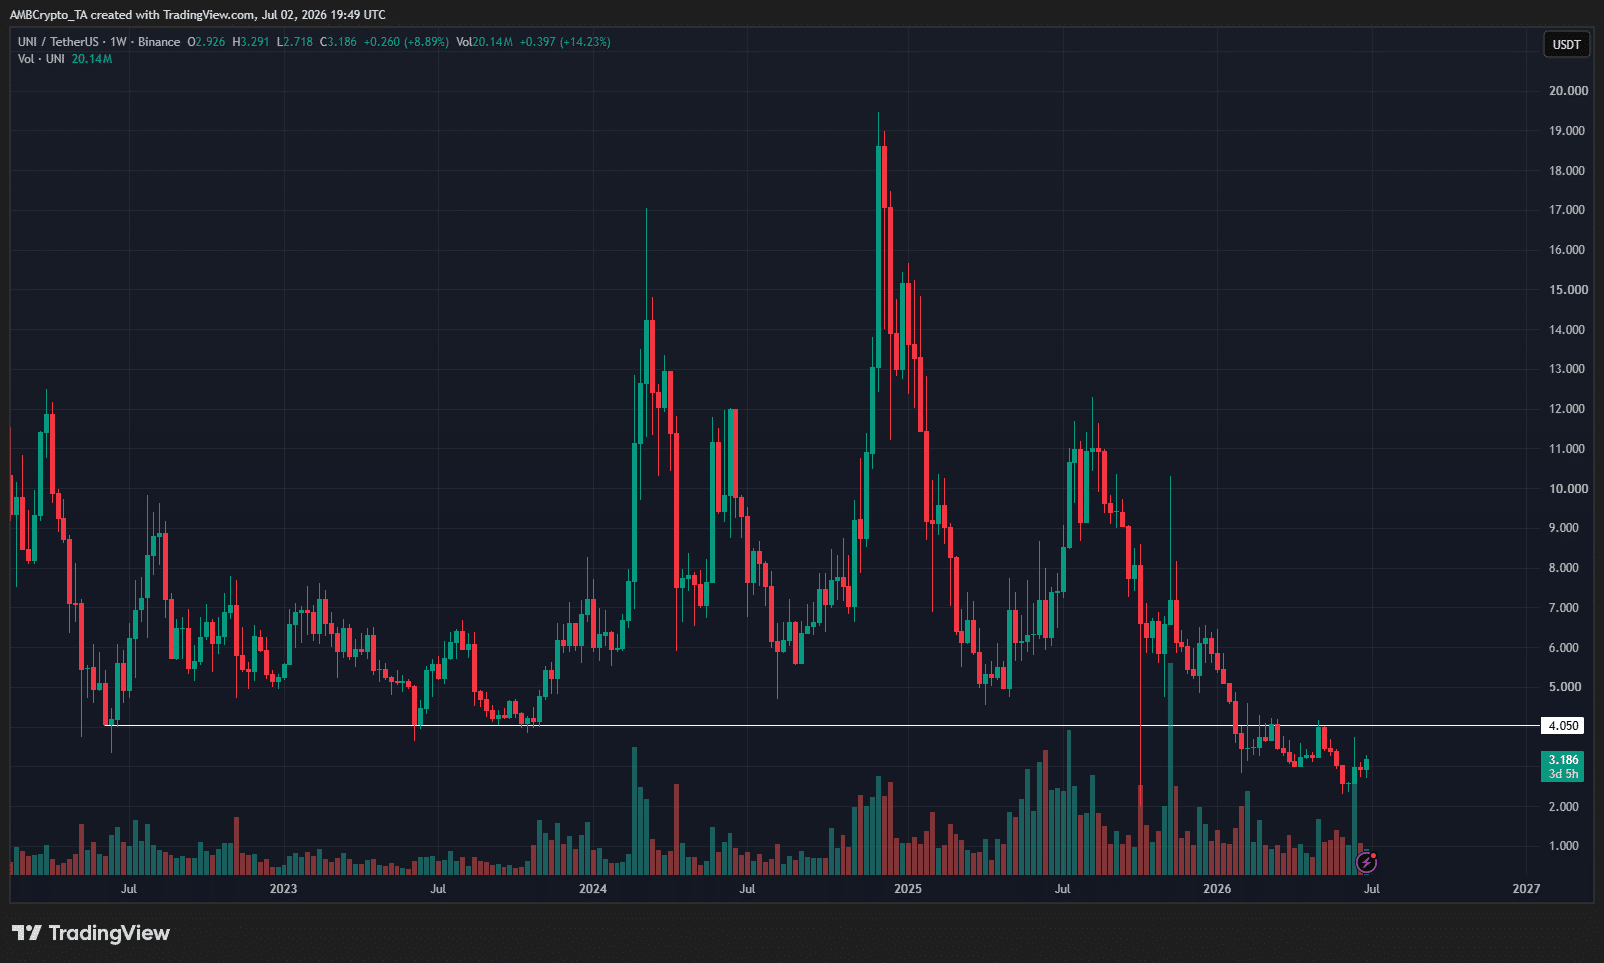
On the 1-week chart, the importance of $4 as a support was made abundantly clear. This level had been defended from June 2022 to January 2026.

Since then, the DEX’s governance token price slipped below this support and retested it twice as resistance. The latest Uniswap price move down to a swing low of $2.316, made in early June, highlighted the bearish long-term bias.

Source: UNI/USDT on TradingView

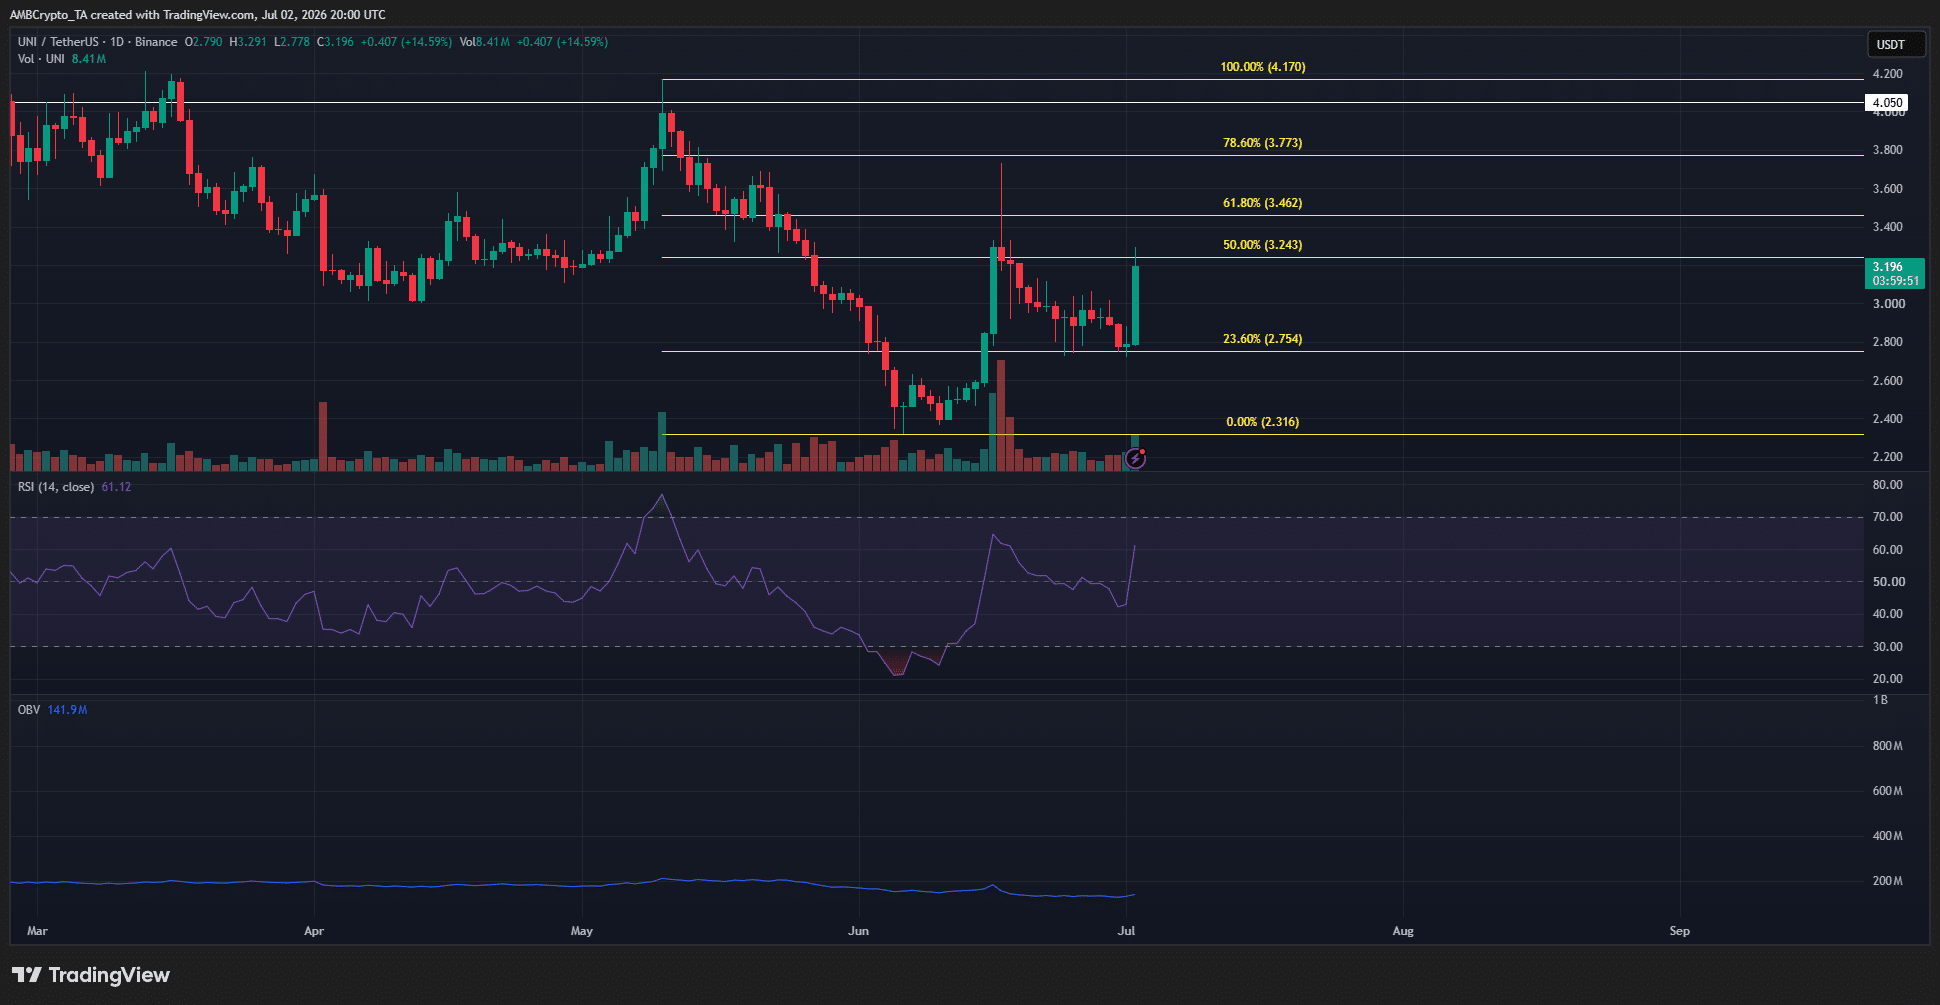
A set of Fibonacci retracement levels was plotted using this move downward. The current bounce was operating within the bearish swing structure. Though the RSI managed to cross over above neutral 50, the OBV was unable to approach the highs made in mid-June.

This indicated short-term upward momentum but a lack of sustained buying pressure amidst a longer-term bear trend.

Traders’ call to action- Sell the bounce

Source: CoinGlass

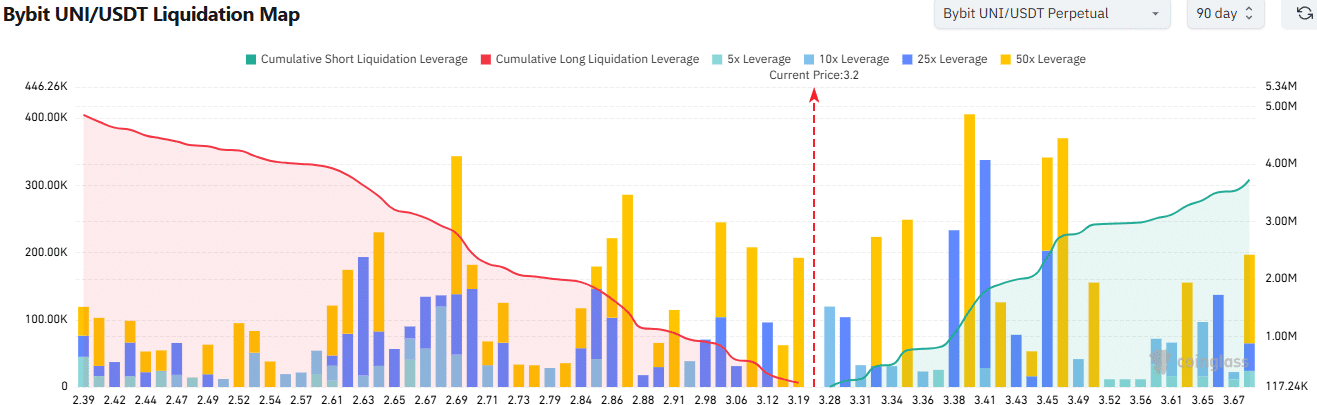
The liquidation map showed a larger cumulative short liquidation leverage piled up overhead, up to $3.52. With a few clusters of high-leverage short positions, the price move toward $3.5 appeared more likely in the short-term based on the chart above.

If Bitcoin [BTC] does not see a swift sell-off in the coming days, there is a chance of a UNI bounce toward $3.5.

Traders can use such a bounce to sell the token, although a move to the 78.6% retracement level at $3.77 can not be ruled out. Overall, swing traders can maintain their bearish bias till the $4.17 swing high is broken.


Final Summary

  • The Robinhood-Uniswap collaboration announcement, alongside a wave of respite across the wider crypto market, has made room for a UNI rally.
  • The long-term Uniswap price trend was severely bearish, and the current bounce was only a minor move within this downtrend.

Trending Cryptos

Related Questions

QWhat specific announcement was made regarding Uniswap and Robinhood, and what was its immediate impact on the UNI token?

AUniswap announced the deployment of its v2, v3, v4 protocols and UniswapX on the Robinhood Chain, a Layer 2 network built by Robinhood Crypto, where Uniswap serves as the automated market maker (AMM). Following this news, the price of the UNI token climbed by 14.2% and its daily trading volume spiked by 81% in the past 24 hours.

QWhat are the key technical analysis points presented to support the pessimistic long-term view on UNI?

AThe technical analysis points include: 1) The critical $4 support level from June 2022 to January 2026 was broken, and it has since acted as resistance. 2) The price made a recent swing low of $2.316, reinforcing a bearish long-term bias. 3) Fibonacci retracement levels suggest the current bounce is within a larger bearish swing. 4) The On-Balance Volume (OBV) indicator has not reached its mid-June highs, indicating a lack of sustained buying pressure despite short-term upward momentum.

QAccording to the liquidation map, what is a likely short-term price target for UNI, and why?

AA likely short-term price target for UNI is $3.5. The liquidation map shows a significant cumulative volume of high-leverage short liquidations clustered around the $3.52 level, making a move towards $3.5 more probable in the short term.

QWhat trading recommendation is given to traders in the article, and what is the condition for maintaining a bearish bias?

AThe article recommends traders to 'sell the bounce' if UNI moves higher, potentially using a bounce towards $3.5 or possibly $3.77 (the 78.6% Fibonacci retracement level) as selling opportunities. It advises that swing traders can maintain their bearish bias until the $4.17 swing high price level is broken.

QWhat two main factors are summarized as contributing to the UNI price rally?

AThe two main factors summarized as contributing to the UNI price rally are: 1) The announcement of the Robinhood and Uniswap collaboration. 2) A wave of positive momentum (a 2.3% bounce) across the wider cryptocurrency market, providing overall market support.

Related Reads

Buying Discounted ETH, Which One to Choose: Bitmine or SharpLink?

The article compares two major ETH treasury companies, SharpLink and Bitmine, for investors seeking indirect ETH exposure via stocks during a bear market. Both hold significant ETH at similar cost bases (~$3,609 and ~$3,400 respectively) and face comparable percentage losses (>50%). Key differences lie in scale, valuation, and financing. Bitmine holds 5.7M ETH (4.7% of supply) with a ~$76B market cap and trades at only a ~6% discount to its net asset value (NAV). It has superior liquidity, aggressive financing (raising $19.2B in 11 months), and inclusion in the Russell 1000 index. However, its structure includes perpetual preferred stock with dividend costs, and past investors paid significant premiums, adding an extra layer of valuation risk. SharpLink holds ~887k ETH, has a ~$10.2B market cap, and trades at a deeper ~21% discount to NAV. Its financing has been slower, relying on smaller offerings. It promotes an "institutional narrative" with ties to Ethereum co-founder Joe Lubin and RWA/tokenization plans, though these remain unimplemented. Its liquidity is lower, but its simpler capital structure means current investors aren't paying for past overvaluation. In summary: For tactical trading in a downturn, Bitmine offers better liquidity and tighter NAV pricing. For potential long-term upside if ETH recovers, SharpLink's deeper discount offers more theoretical repair room, though it faces execution risks. The choice depends on whether one prioritizes trading efficiency and scale (Bitmine) or a potentially larger discount and simpler structure (SharpLink).

链捕手36m ago

Buying Discounted ETH, Which One to Choose: Bitmine or SharpLink?

链捕手36m ago

Trading

Spot

Hot Articles

Discussions

Welcome to the HTX Community. Here, you can stay informed about the latest platform developments and gain access to professional market insights. Users' opinions on the price of LAYER (LAYER) are presented below.

活动图片