XRP flashed its first SuperTrend buy signal since mid-June, reviving optimism after several weeks of persistent downside pressure.
The latest signal followed an extended corrective phase and mirrored a setup that previously preceded a 14% price rally.
According to Ali Charts, the same indicator had identified the last two major declines of 19% and 16%, highlighting its recent reliability during key market turning points. However, technical indicators rarely guarantee identical outcomes across different market environments.
Instead, the latest signal suggested that selling pressure had eased while buyers regained short-term control.
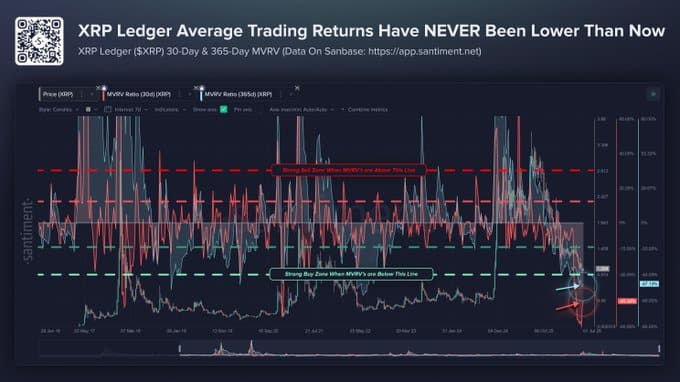
Holder losses reached historic extremes
Santiment’s on-chain data showed that XRP’s average returns had fallen to their weakest levels in the asset’s history.
The 30-day Market Value to Realized Value (MVRV) ratio dropped to -45%, while the 365-day MVRV ratio declined even further to -47%, leaving both short-term and long-term holders deeply underwater.
Historically, such extreme readings appeared after prolonged periods of capitulation rather than widespread optimism.
Instead of reflecting fresh buying demand, these figures suggested that most sellers had already absorbed significant losses before exiting the market.
Nevertheless, deeply negative MVRV values have often improved the long-term risk-reward profile because fewer investors remain willing to sell at depressed prices.
The metric therefore strengthened the case for a relief rally, although broader market conditions would still determine whether buyers could sustain any recovery.

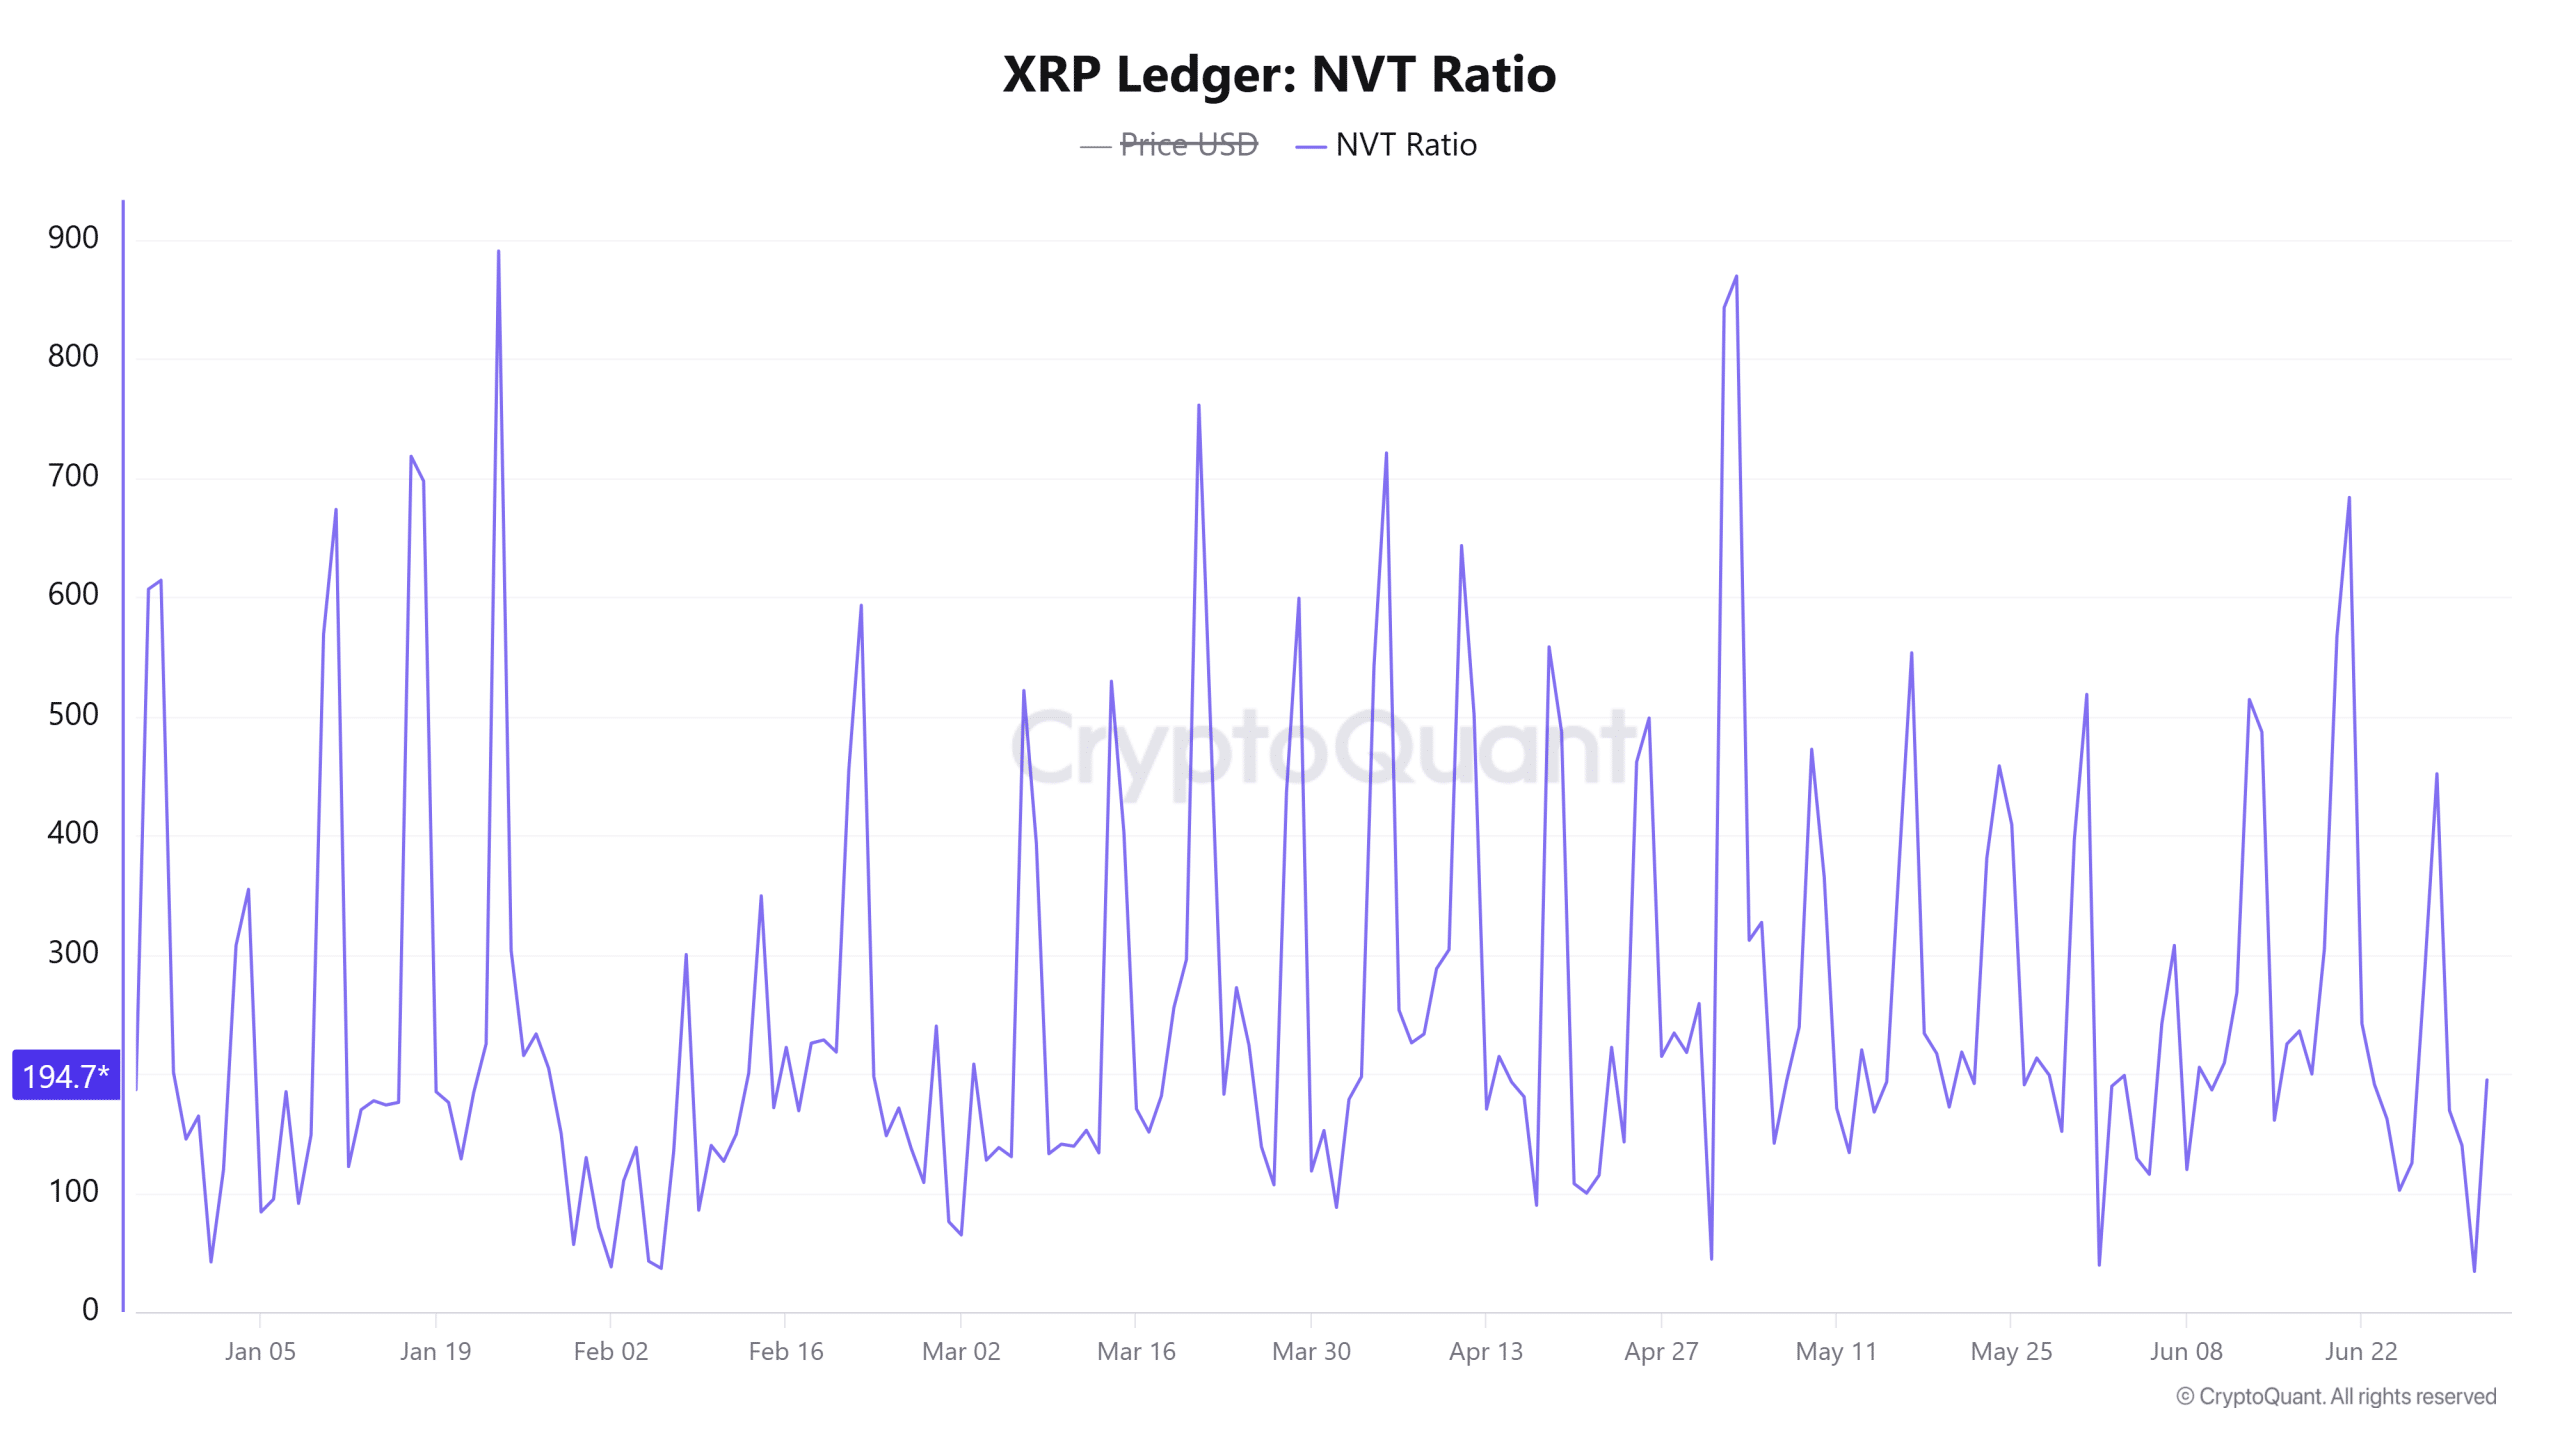
NVT spike raised questions about network strength
Ripple’s [XRP] Network Value to Transactions (NVT) Ratio climbed sharply to 194.71 after posting a remarkable 470.92% increase over the previous 24 hours.
The indicator compared the network’s market valuation against the value transferred across the blockchain.
Such a sharp increase usually reflect market value rising much faster than underlying transaction activity.
Rather than confirming stronger network usage, the latest reading suggested that valuation had begun outpacing utility.
This divergence often appears during periods when price recover faster than on-chain demand.
However, the metric alone did not invalidate XRP’s improving technical outlook because transaction activity frequently lagged behind price during the early stages of recoveries.
Even so, sustained upside would likely require stronger network participation to support higher valuations over time.

XRP defended support as MACD turned higher
At the time of press, XRP traded around $1.1014 after reclaiming the $1.0385 support zone, where buyers repeatedly prevented additional losses.
The daily chart also showed the MACD line crossing above the signal line while the histogram shifted back into positive territory.
That crossover indicated that bearish pressure had weakened after weeks of decline.
Price still remained below the major resistance at $1.2352, making that level the next important barrier for any sustained recovery.
A successful move above it would expose the $1.3653 resistance, while another rejection could return attention to the $1.0385 support.

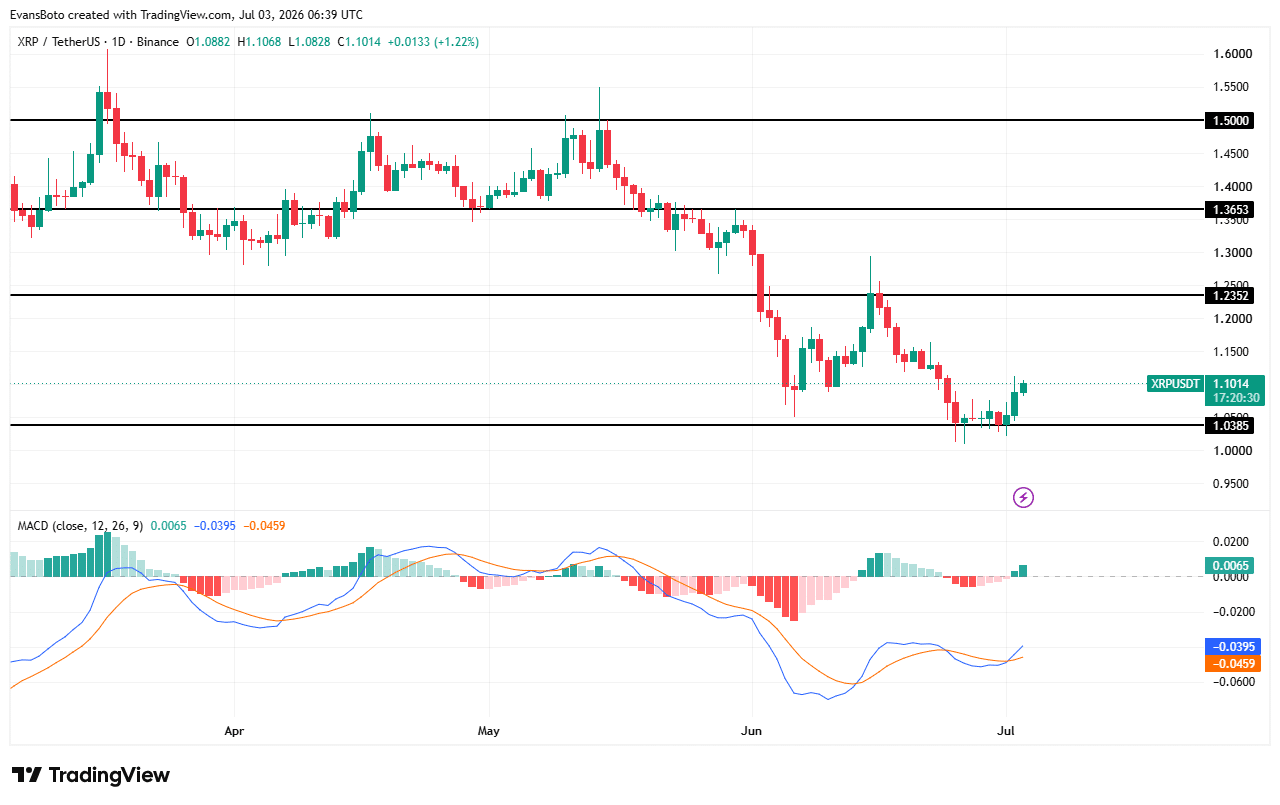
The chart therefore showed improving technical conditions, although XRP still needed confirmation through a decisive breakout above nearby resistance before establishing a broader bullish trend.
Final Summary
- XRP reclaimed key support while technical indicators pointed toward improving short-term market structure.
- Record-low MVRV favored recovery, but elevated NVT showed network activity still lagged price.