Bitcoin Dominance To Experience Major Crash? Pundit Shares What This Would Mean

bitcoinistPublished on 2026-02-24Last updated on 2026-02-24

Abstract

Technical analysis of the Bitcoin dominance (BTC.D) chart suggests a potential major crash, reminiscent of the 2017 setup, which could lead to significant liquidity rotation into altcoins. Analysts point to the tightening weekly Bollinger Bands, indicating a possible sharp decline from the current level near 59% down to the mid-30% range. Such a move has historically preceded strong altcoin rallies, with cryptocurrencies like Ethereum and XRP potentially benefiting. However, predictions of a BTC.D crash are not new, and Bitcoin's dominance has remained resilient despite previous expectations. A breakout above 60% could invalidate the bearish outlook and extend Bitcoin's market control into 2026.

Technical analysis of the BTC.D chart is pointing to a tip in balance that might lead to a crash in Bitcoin’s crypto market cap dominance.

Analysts on X are pointing to signals on the Bitcoin dominance chart that could precede a sharp downward move, one that could have a massive effect on how liquidity rotates into the altcoin market. The latest outlook came from crypto analyst Cryptoinsightuk, who highlighted the current state of the weekly Bollinger Bands indicator on the BTC.D chart as a reason why BTC’s dominance is about to experience a massive crash.

Weekly Bollinger Bands Flash 2017-Style Setup

According to CryptoInsightsuk, the current compression and positioning of the Bollinger bands resemble conditions seen in March 2017, a period that preceded a rapid decline in Bitcoin dominance and the start of a powerful altcoin rally season.

The weekly candlestick chart shows Bitcoin dominance pressing near the mid-to-upper Bollinger Band region around 59%, with the bands now tightening. In previous cycles, particularly in 2017, a similar band structure led to a high-velocity crash that pushed BTC’s dominance downwards for many weeks. This is visible in the grey zone labelled in the chart below as the “Previous ALT Season Start Point.”

Source: Chart from CryptoInsightsuk on X

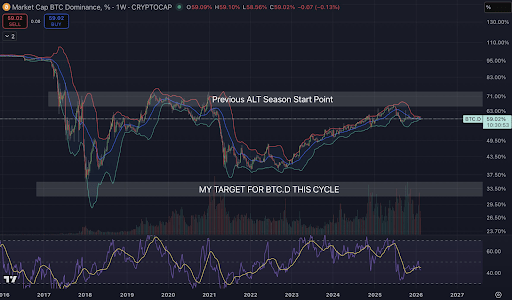
According to the analyst, this tightening of Bollinger Bands is expected to result in a downward move that pushes the BTC dominance to the mid-30%. This is highlighted in the chart below as a target range between 30% and 35%, with a mid-level of 33.5%.

Liquidity Rotation And The Altcoin Effect

Another crypto analyst known as Bird responded to the analysis with a note that charts are pointing to a violent move down in Bitcoin dominance. As noted by the analyst, violent downward moves in BTC.D have always coincided with aggressive liquidity rotation into altcoins. A quick drop in Bitcoin’s market share is due to more capital flowing into the altcoin market than into BTC.

In the analyst’s view, once dominance breaks convincingly, major cryptocurrencies such as Ethereum and XRP will start to gain meaningful market share. Bird specifically noted that XRP may be positioned for a strong move through March and beyond, citing reasons of ongoing infrastructure development tied to Ripple’s ecosystem.

That said, predictions of a crash in BTC dominance are not new. Market participants have been anticipating the start of a full-scale altcoin season for the past several months. However, Bitcoin’s dominance has held steady, even during periods of price crashes. This is because periods of outflows from Bitcoin have always led to corresponding outflows from other cryptocurrencies.

At the time of writing, Bitcoin is currently at 57.7%, down by 1.34% in the past 24 hours. A breakout above the prior alt-season start zone in the 60% range could invalidate the bearish thesis and extend Bitcoin’s control further into 2026.

BTC trading at $63,132 on the 1D chart | Source: BTCUSDT on Tradingview.com

Related Questions

QWhat technical indicator is being cited as a sign of a potential major crash in Bitcoin dominance?

AThe weekly Bollinger Bands indicator on the BTC.D chart, which is showing compression and a setup similar to that of March 2017.

QAccording to the analyst Cryptoinsightuk, what was the historical precedent for the current Bollinger Band setup?

AThe setup resembles the conditions seen in March 2017, a period that preceded a rapid decline in Bitcoin dominance and the start of a powerful altcoin rally season.

QWhat is the target range for the potential drop in Bitcoin dominance, as highlighted in the analysis?

AThe target range is between 30% and 35%, with a mid-level of 33.5%.

QWhat effect does a violent downward move in BTC.D have on the altcoin market, according to analyst Bird?

AIt coincides with aggressive liquidity rotation into altcoins, as a quick drop in Bitcoin's market share is due to more capital flowing into the altcoin market than into BTC.

QWhat could invalidate the bearish thesis for Bitcoin dominance and extend its control further?

AA breakout above the prior alt-season start zone in the 60% range could invalidate the bearish thesis and extend Bitcoin's control further into 2026.

Related Reads

Bitwise: The Institutional Wave Has Arrived, Why Is the Market Still Asleep?

The biggest alpha opportunities in financial markets come from behavioral biases like anchoring, where investors cling to initial impressions. This is why the crypto market is currently mispriced: traditional investors still anchor crypto to its early, counterculture image, while crypto natives suffer from "crying wolf" fatigue after years of promised institutional adoption. Yet, the institutional wave is already here. Wall Street is loudly announcing its move on-chain. SEC Chair Paul Atkins has initiated a commission-wide project to modernize securities regulation for blockchain. BlackRock’s Larry Fink declared we are at the beginning of asset tokenization, evidenced by the firm’s $2+ billion BUIDL tokenized treasury fund on Uniswap and an investment in UNI. Apollo is tokenizing a credit fund on six blockchains and acquiring a stake in Morpho. JPMorgan, Bank of America, Citi, and Wells Fargo are collaborating on a stablecoin. JPMorgan has issued a deposit token on Base, and Fidelity is hiring for a DeFi treasury role. The potential market is enormous: a $30 trillion ETF market, $110 trillion in equities, and $145 trillion in bonds. In contrast, the entire tokenized market is just $20 billion, suggesting potential for exponential growth. The chart of tokenized real-world assets (RWA) value shows a near-vertical growth trajectory, yet this reality is disconnected from market perception. The key challenge is determining how to capture this opportunity, as unanswered questions remain about whether value will accrue to public blockchains, new quasi-private networks, DeFi tokens, or traditional institutions. The certainty is that a massive gap exists between the market’s outdated perception of crypto and its current reality. This divergence represents a significant alpha opportunity—not in picking winners prematurely, but in gaining broad exposure to the entire sector while it remains mispriced. The largest gains occur when consensus is stale and reality has moved on. That time is now for crypto.

marsbit20m ago

Bitwise: The Institutional Wave Has Arrived, Why Is the Market Still Asleep?

marsbit20m ago

Trading

Spot
Futures

Hot Articles

What is $BITCOIN

DIGITAL GOLD ($BITCOIN): A Comprehensive Analysis Introduction to DIGITAL GOLD ($BITCOIN) DIGITAL GOLD ($BITCOIN) is a blockchain-based project operating on the Solana network, which aims to combine the characteristics of traditional precious metals with the innovation of decentralized technologies. While it shares a name with Bitcoin, often referred to as “digital gold” due to its perception as a store of value, DIGITAL GOLD is a separate token designed to create a unique ecosystem within the Web3 landscape. Its goal is to position itself as a viable alternative digital asset, although specifics regarding its applications and functionalities are still developing. What is DIGITAL GOLD ($BITCOIN)? DIGITAL GOLD ($BITCOIN) is a cryptocurrency token explicitly designed for use on the Solana blockchain. In contrast to Bitcoin, which provides a widely recognized value storage role, this token appears to focus on broader applications and characteristics. Notable aspects include: Blockchain Infrastructure: The token is built on the Solana blockchain, known for its capacity to handle high-speed and low-cost transactions. Supply Dynamics: DIGITAL GOLD has a maximum supply capped at 100 quadrillion tokens (100P $BITCOIN), although details regarding its circulating supply are currently undisclosed. Utility: While precise functionalities are not explicitly outlined, there are indications that the token could be utilized for various applications, potentially involving decentralized applications (dApps) or asset tokenization strategies. Who is the Creator of DIGITAL GOLD ($BITCOIN)? At present, the identity of the creators and development team behind DIGITAL GOLD ($BITCOIN) remains unknown. This situation is typical among many innovative projects within the blockchain space, particularly those aligning with decentralized finance and meme coin phenomena. While such anonymity may foster a community-driven culture, it intensifies concerns about governance and accountability. Who are the Investors of DIGITAL GOLD ($BITCOIN)? The available information indicates that DIGITAL GOLD ($BITCOIN) does not have any known institutional backers or prominent venture capital investments. The project seems to operate on a peer-to-peer model focused on community support and adoption rather than traditional funding routes. Its activity and liquidity are primarily situated on decentralized exchanges (DEXs), such as PumpSwap, rather than established centralized trading platforms, further highlighting its grassroots approach. How DIGITAL GOLD ($BITCOIN) Works The operational mechanics of DIGITAL GOLD ($BITCOIN) can be elaborated on based on its blockchain design and network attributes: Consensus Mechanism: By leveraging Solana’s unique proof-of-history (PoH) combined with a proof-of-stake (PoS) model, the project ensures efficient transaction validation contributing to the network's high performance. Tokenomics: While specific deflationary mechanisms have not been extensively detailed, the vast maximum token supply implies that it may cater to microtransactions or niche use cases that are still to be defined. Interoperability: There exists the potential for integration with Solana’s broader ecosystem, including various decentralized finance (DeFi) platforms. However, the details regarding specific integrations remain unspecified. Timeline of Key Events Here is a timeline that highlights significant milestones concerning DIGITAL GOLD ($BITCOIN): 2023: The initial deployment of the token occurs on the Solana blockchain, marked by its contract address. 2024: DIGITAL GOLD gains visibility as it becomes available for trading on decentralized exchanges like PumpSwap, allowing users to trade it against SOL. 2025: The project witnesses sporadic trading activity and potential interest in community-led engagements, although no noteworthy partnerships or technical advancements have been documented as of yet. Critical Analysis Strengths Scalability: The underlying Solana infrastructure supports high transaction volumes, which could enhance the utility of $BITCOIN in various transaction scenarios. Accessibility: The potential low trading price per token could attract retail investors, facilitating wider participation due to fractional ownership opportunities. Risks Lack of Transparency: The absence of publicly known backers, developers, or an audit process may yield skepticism regarding the project's sustainability and trustworthiness. Market Volatility: The trading activity is heavily reliant on speculative behavior, which can result in significant price volatility and uncertainty for investors. Conclusion DIGITAL GOLD ($BITCOIN) emerges as an intriguing yet ambiguous project within the rapidly evolving Solana ecosystem. While it attempts to leverage the “digital gold” narrative, its departure from Bitcoin's established role as a store of value underscores the need for a clearer differentiation of its intended utility and governance structure. Future acceptance and adoption will likely depend on addressing the current opacity and defining its operational and economic strategies more explicitly. Note: This report encompasses synthesised information available as of October 2023, and developments may have transpired beyond the research period.

363 Total ViewsPublished 2025.05.13Updated 2025.05.13

Discussions

Welcome to the HTX Community. Here, you can stay informed about the latest platform developments and gain access to professional market insights. Users' opinions on the price of BTC (BTC) are presented below.

活动图片