Original Author: Garrett
Original Compilation: Saoirse, Foresight News
Recently, some analysts have been comparing the current price trend of Bitcoin with that of 2022.
Admittedly, the short-term price movements may appear somewhat similar. However, from a long-term perspective, this comparison is entirely absurd.
Whether in terms of long-term price patterns, macroeconomic context, investor composition, or supply/demand and holding structures, the underlying logic of the two periods is fundamentally different.
In the analysis and trading of financial markets, the biggest mistake is to focus solely on short-term, superficial statistical similarities while ignoring long-term, macro, and fundamental driving factors.
Completely Opposite Macroeconomic Backgrounds
In March 2022, the United States was mired in high inflation and an interest rate hiking cycle, driven by factors including:
- Excess liquidity during the COVID-19 pandemic;
- The ripple effects of the Ukraine crisis, which further significantly pushed up inflation.
At that time, risk-free interest rates were continuously rising, liquidity was being systematically withdrawn, and financial conditions were constantly tightening.
In such an environment, the primary goal of capital was risk aversion. The Bitcoin trend we observed was essentially a distribution pattern at high levels during a tightening cycle.
The current macroeconomic environment is precisely the opposite:
- The situation of the Ukraine conflict is continuing to ease (partly due to U.S. efforts to reduce inflation and lower interest rates);
- Both the Consumer Price Index (CPI) and U.S. risk-free interest rates are showing a downward trend;
- More importantly, the AI technology revolution has significantly increased the likelihood of the economy entering a long-term deflationary cycle. Therefore, from a larger cycle perspective, interest rates have entered a rate-cutting phase;
- Central banks are reinjecting liquidity into the financial system;
- This means that capital currently exhibits "risk-on" characteristics.
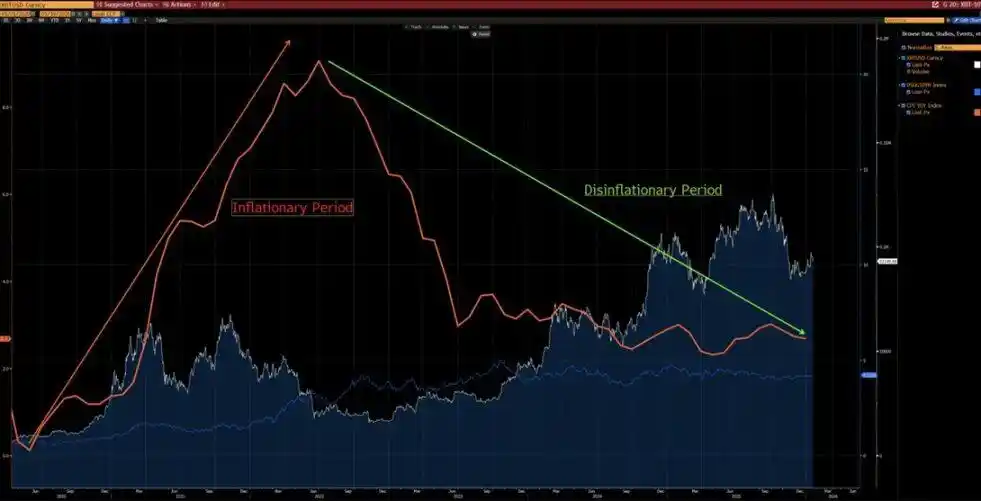
As can be seen from the chart below, since 2020, Bitcoin has shown a clear negative correlation with the year-on-year change in CPI—Bitcoin tends to fall during rising inflation cycles and rise during slowing inflation cycles.
Against the backdrop of the AI-driven technology revolution, long-term deflation is highly probable—a view also shared by Elon Musk, further corroborating our argument.
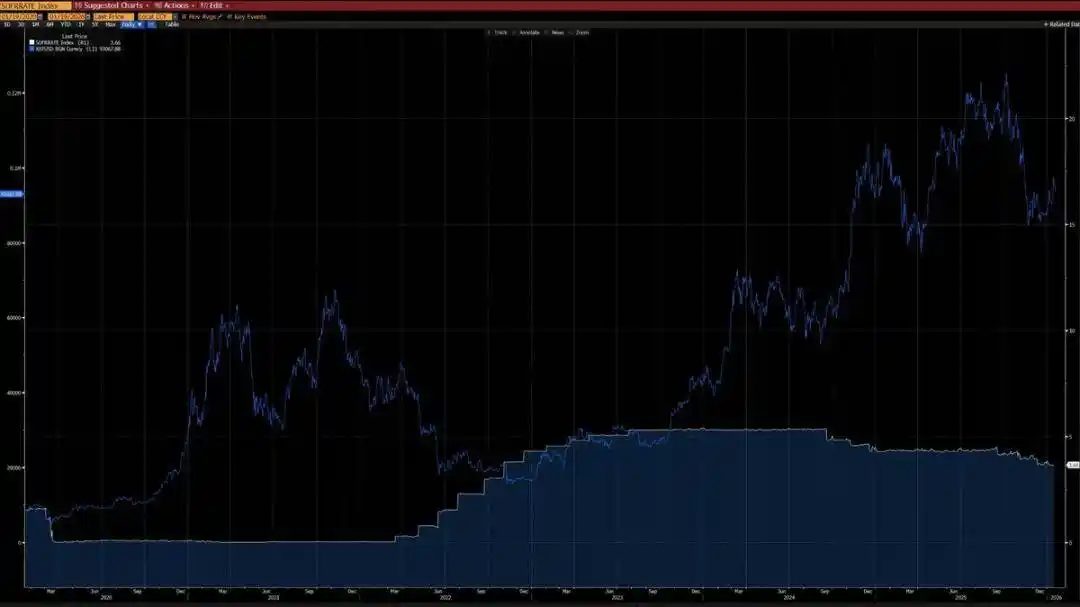
Another chart below also reveals that since 2020, Bitcoin has had an extremely strong correlation with the U.S. Liquidity Index (with the exception of data deviations in 2024 due to ETF inflows). Currently, the U.S. Liquidity Index has broken through both the short-term (white line) and long-term (red line) downtrend lines—a new uptrend is emerging.
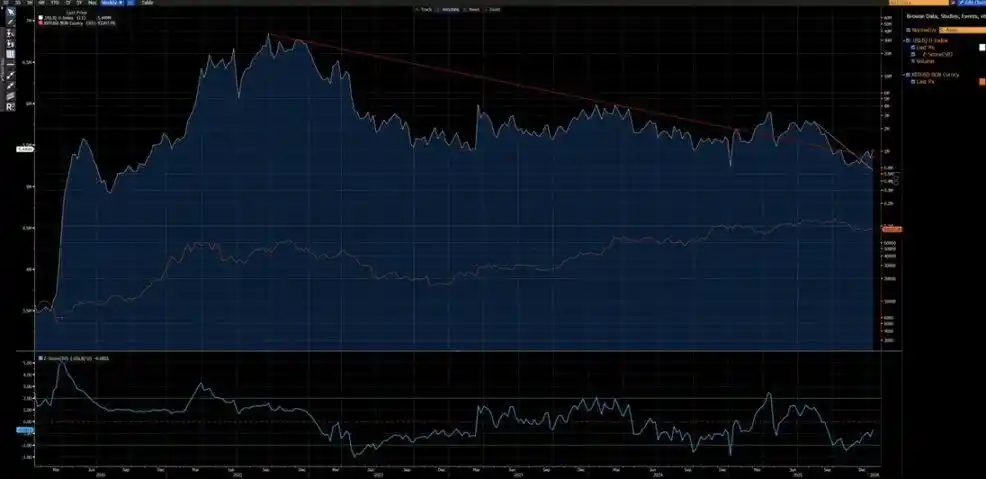
Distinctly Different Technical Structures
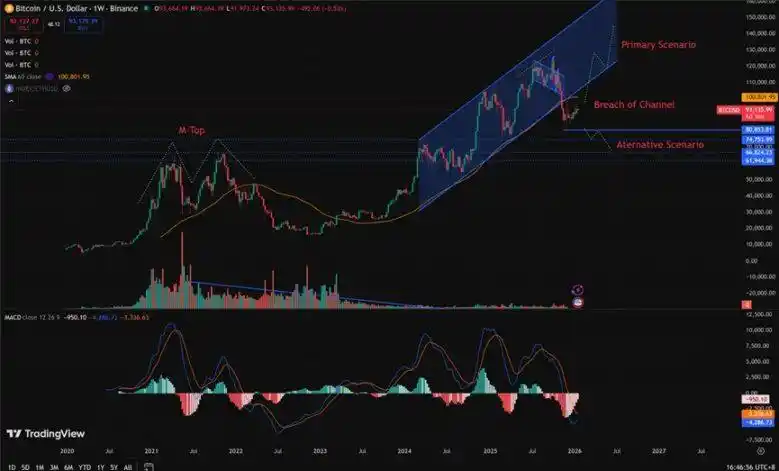
- 2021-2022: A weekly "M-top" structure, a pattern typically associated with long-cycle market tops, which tends to suppress price movements for an extended period.
- 2025 (affecting early 2026 trends): A weekly break below the rising channel. From a probabilistic perspective, this is more likely a "bear trap" before a rebound back into the channel.
Of course, we cannot completely rule out the possibility that the current trend evolves into a continuation of the 2022-style bear market. However, it must be noted that the $80,850-$62,000 range has previously experienced large-scale consolidation and筹码 exchange.
This prior process of筹码 accumulation provides a far superior risk-reward ratio for bullish positions—upside potential significantly outweighs downside risk.
What Conditions Are Needed to Repeat a 2022-Style Bear Market?
To repeat a bear market like 2022, the following hard conditions must be met:
- A new round of inflation shock, or a major geopolitical crisis on a scale equivalent to 2022;
- Central banks restarting interest rate hikes, or resuming balance sheet quantitative tightening (QT) policies;
- A decisive and sustained break below the $80,850 level for Bitcoin's price.
Until all these conditions are met, declaring a structural bear market is premature and constitutes a speculative judgment rather than a conclusion based on rational analysis.
Markedly Different Investor Structures
- 2020-2022: The market was dominated by retail investors, with limited institutional participation, especially from long-term allocation institutions.
- Since 2023: The launch of Bitcoin ETFs introduced "structural long-term holders," effectively locking up part of the Bitcoin supply, significantly reducing trading activity, and markedly lowering volatility.
2023 marked a structural inflection point for Bitcoin as an asset, both from a macroeconomic and quantitative analysis standpoint.
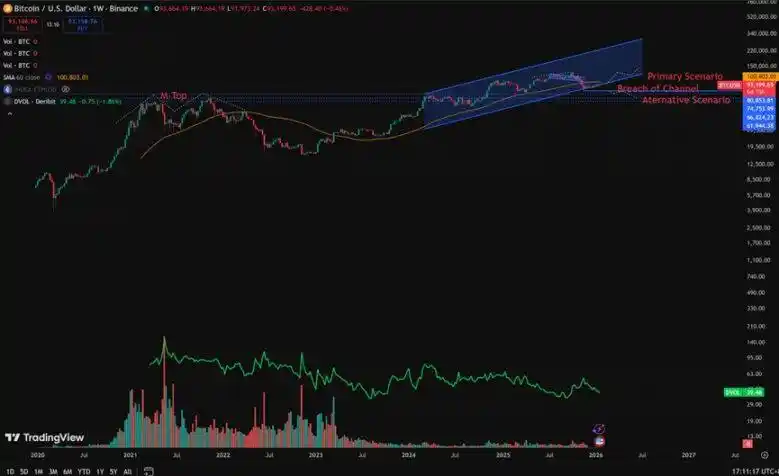
Bitcoin's volatility range has also undergone a fundamental shift:
- Historical volatility: 80%-150%
- Current volatility: 30%-60%
This change signifies a fundamental shift in Bitcoin's asset attributes.
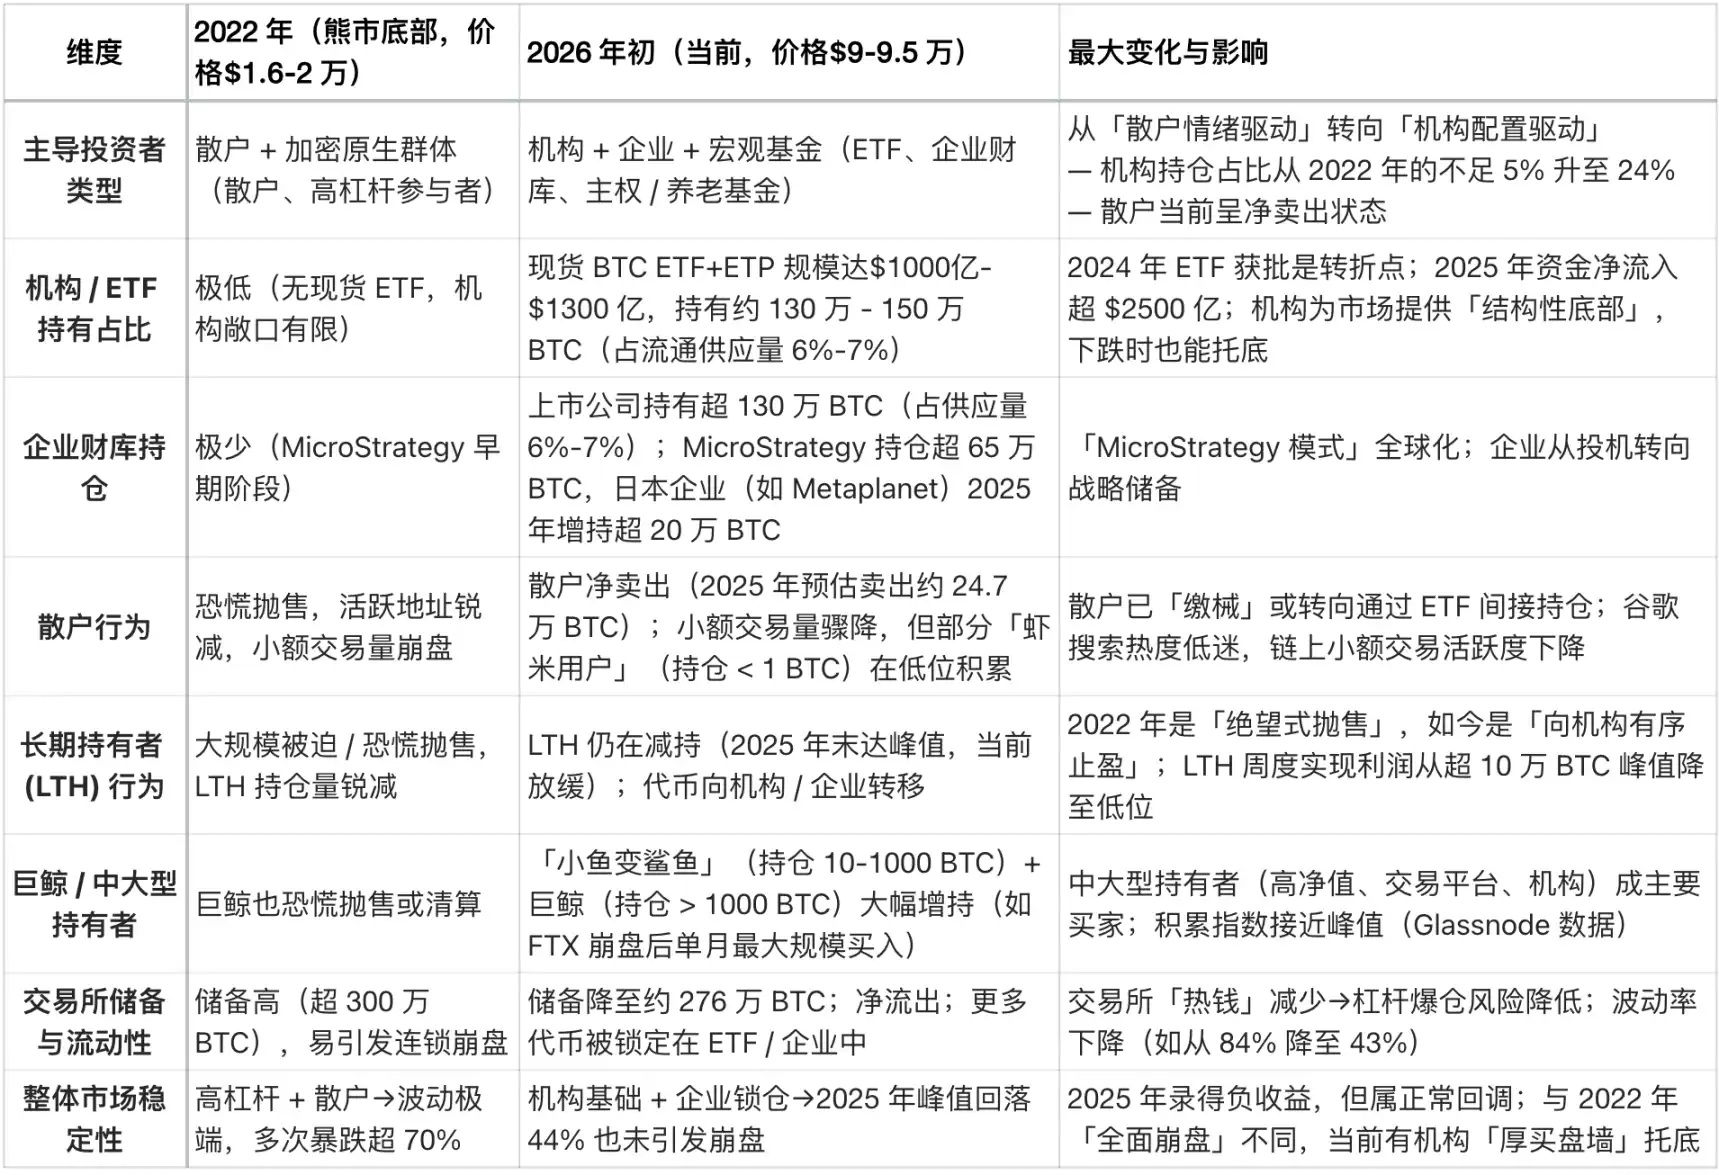
Core Structural Differences (Current vs. 2022)
The biggest difference in Bitcoin's investor structure between early 2026 and 2022 is the shift from a "retail-dominated, high-leverage speculation" market to an "institution-dominated, structural long-term holding" market.
In 2022, Bitcoin experienced a typical "crypto-native bear market," triggered by retail panic selling and cascading leverage liquidations.
Today, Bitcoin has entered a much more mature "institutional era," characterized by:
- Stable underlying demand
- Part of the supply being locked long-term
- Volatility reaching institutional-grade levels
Below is a core comparison by Grok based on on-chain data (e.g., Glassnode, Chainalysis) and institutional reports (e.g., Grayscale Investments, Bitwise, State Street) from mid-January 2026 (when Bitcoin was in the $90,000 - $95,000 range):