Since the approval of spot ETFs for BTC and ETH, daily ETF fund inflows and outflows have become a core metric for many traders to set their positions.
The logic is simple: net inflows indicate institutional buying and bullish sentiment; net outflows indicate institutional selling and bearish sentiment.
But the problem is, the ETF data we see every day is the result of the previous day.
By the time the data is released, the price has often already reflected it.
So, is there any way to predict in advance whether today's ETF will see net inflows or net outflows?
Yes, the answer is the ETF premium rate.
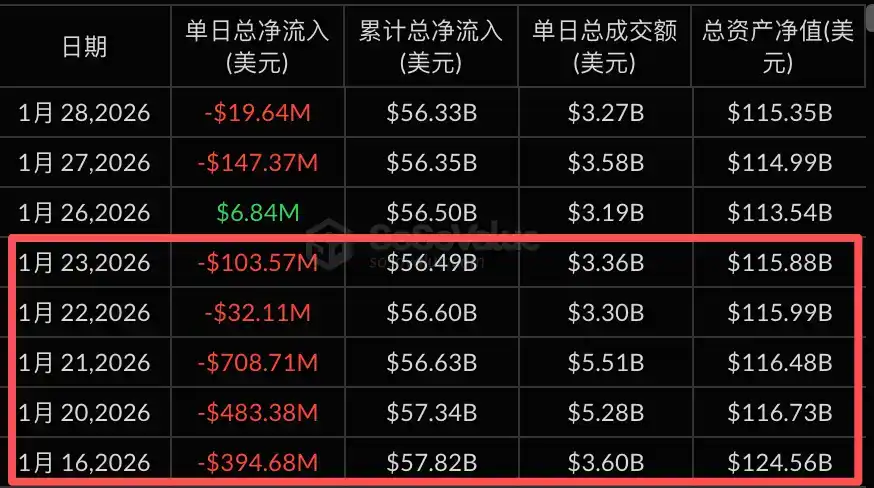
It's not hard to verify this pattern; reviewing the soon-to-end January 2026 is the best sample.
As of January 28th, there were 18 trading days in the U.S. stock market.
Statistics show that the premium index on Coinbase stayed in positive territory for only two days, while the other 16 days were all in negative premium territory.
Corresponding ETF fund flows show that 11 of these 16 days ultimately recorded net outflows.
Especially from January 16th to 23rd, the negative premium rate continuously fell below -0.15%, corresponding to a weekly net outflow of over $1.3 billion from the ETF market, with BTC's price dropping from a high of $97,000 to around $88,000.
Let's take a longer-term view.
From July 1, 2025, to January 28, 2026, a total of 146 trading days.
· Negative premium rate occurred for 48 days, corresponding to net outflows for 39 days, accuracy rate 81%.
· Positive premium rate occurred for 98 days, corresponding to net inflows for 82 days, accuracy rate 84%.
This is the value of the premium rate: it allows you to see where the money is flowing earlier than most.
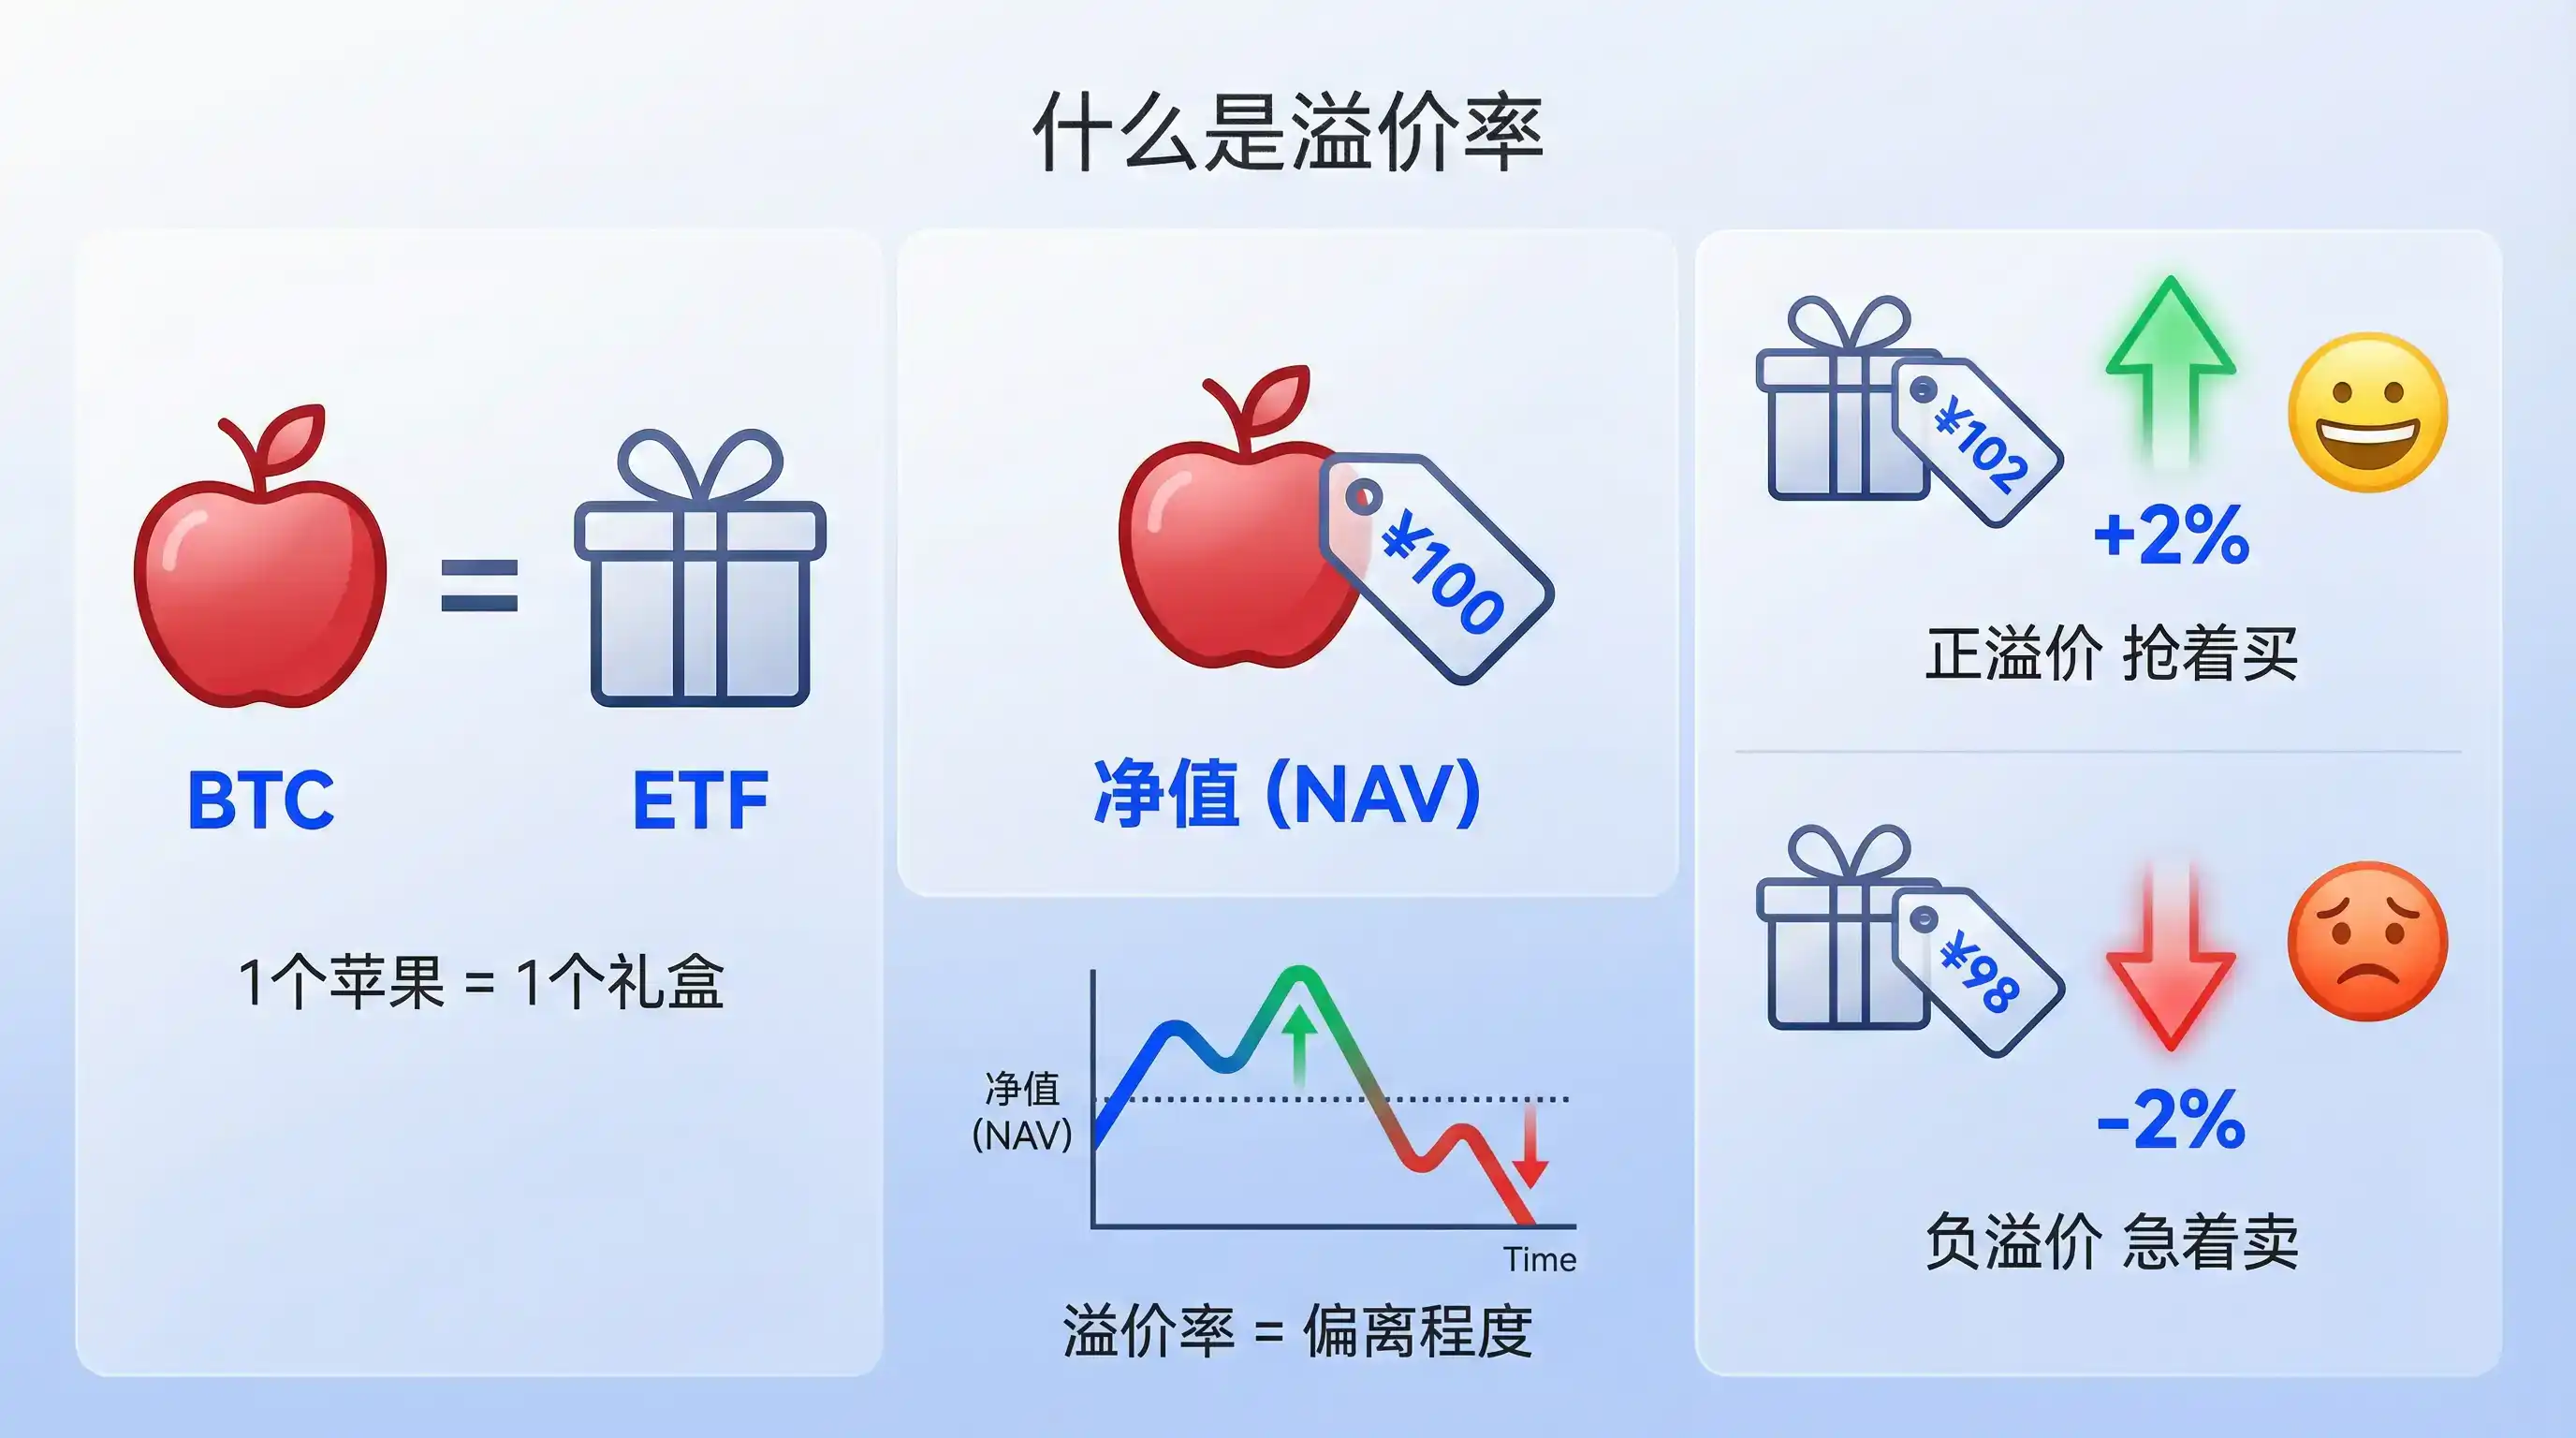
What is the Premium Rate
We've been talking about the premium rate, but what exactly is it?
Here's an analogy.
BTC is like loose apples in a grocery market, while a BTC spot ETF is like a packaged apple gift box in a supermarket, each containing one apple.
An apple sells for $100 in the grocery market; this is the Net Asset Value (NAV).
How much the apple gift box sells for in the supermarket depends on supply and demand.
If many people buy it, the box gets bid up to $102; this is a positive premium rate, a premium of +2%.
If many people sell it, the box drops to $98; this is a negative premium rate, a discount of -2%.
The premium rate reflects the degree to which the ETF market price deviates from the true price of BTC.
A positive premium indicates optimistic market sentiment; everyone is rushing to buy.
A negative premium indicates pessimistic market sentiment; everyone is eager to sell.
The Relationship Between Premium Rate Polarity and ETF Inflows/Outflows
The premium rate is not just a market sentiment indicator; it also becomes a key factor driving fund flows.
The key player in this is the AP, or Authorized Participant, which you can think of as a privileged arbitrageur.
The core logic for APs is risk-free arbitrage: they can create and redeem ETF shares in the primary market, and also buy and sell them in the secondary market.
As long as there is a price difference, they will arbitrage it.
When a positive premium rate occurs, the gift box is more expensive than the apple. APs will go to the primary market to buy BTC, package it into ETF shares, and then sell them in the secondary market to profit from the difference. In this process, BTC is bought, resulting in a net inflow of funds.
Conversely, when a negative premium rate occurs, the gift box is cheaper than the apple. APs will buy ETFs in the secondary market, unbundle them to redeem the underlying BTC, and then sell the BTC to profit from the difference. In this process, BTC is sold, resulting in a net outflow of funds.
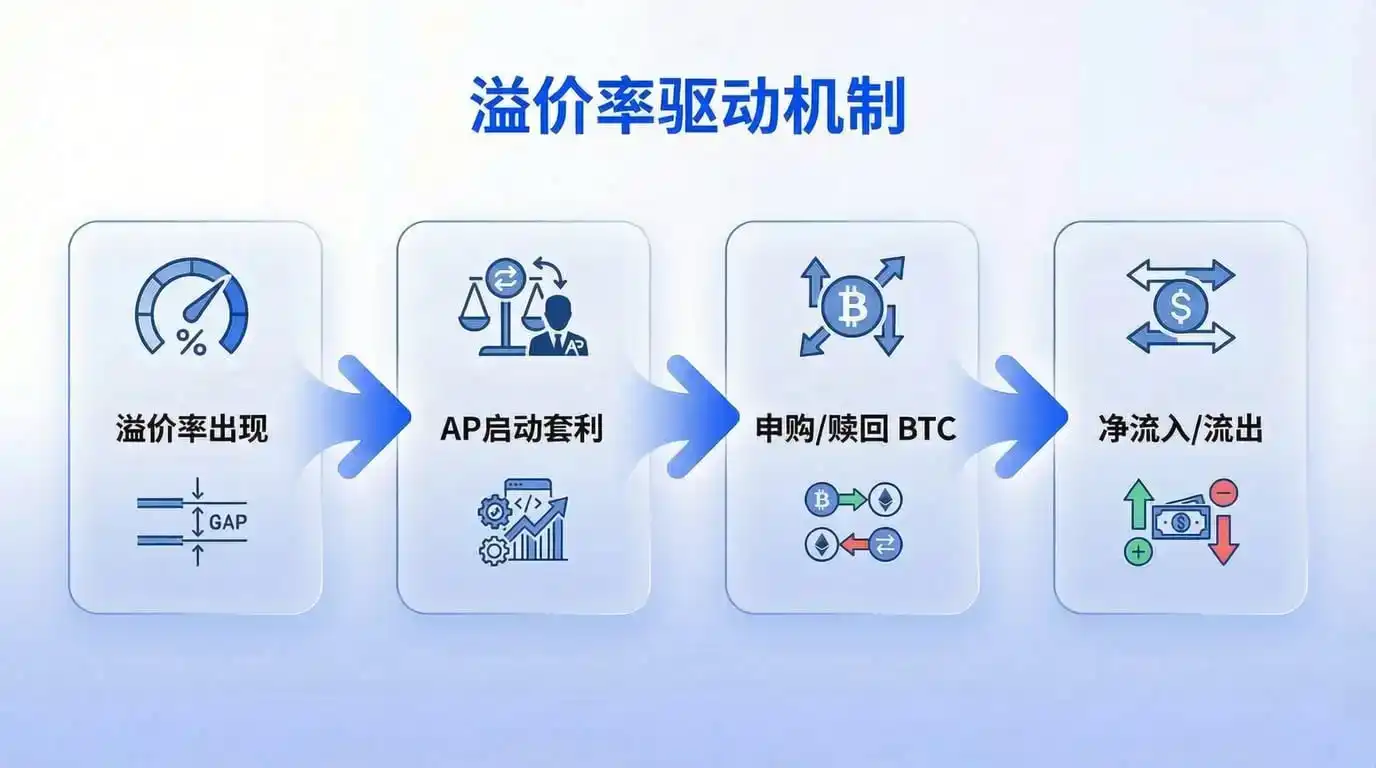
So the logical chain is this:
Premium rate appears → APs initiate arbitrage → Creation or redemption occurs → Net inflow or outflow is formed.
And the ETF fund data we see every day is published the next day after settlement.
The premium rate is real-time; the fund data is lagging.
This is why the premium rate can give you a step ahead of the market.
How to Apply the Premium Rate
Now that we understand the principle behind the premium rate and ETF net inflows/outflows, how should we apply it to our individual trading plans?
First, the premium rate is not an indicator to be used in isolation.
It can tell us the direction of funds but not the magnitude or persistence.
Here, I suggest considering it in conjunction with the following dimensions.
1. The Persistence of the Premium Rate is More Important Than a Single Day's Value
A single day of negative premium rate might just be short-term volatility.
But if negative premium rates appear for multiple consecutive days, it likely corresponds to continuous net outflows and is worth being alert about.
Look back at the five consecutive trading days of negative premium rates from January 16th to 23rd this year, which corresponded to five days of net outflows, with BTC falling nearly 10%.
2. Pay Attention to Extreme Values of the Premium Rate
Generally, fluctuations within ±0.5% are normal.
Once it breaks through ±1%, it indicates a clear deviation in market sentiment, AP arbitrage motivation strengthens, and fund flows will accelerate.
3. Judge in Conjunction with Price Levels
Sustained negative premium rates at high prices might be an early signal of capital flight.
Sustained positive premium rates at low prices might be a sign of bottom-fishing capital entering the market.
The premium rate itself does not constitute a buy or sell signal, but it can help you verify the current trend or detect turning points in the trend early.
Final Notes
Finally, a few points to note.
No indicator is a holy grail; the effectiveness of the premium rate is based on the premise of normal AP arbitrage mechanisms.
In extreme market conditions, such as the 10.11 crash, where market liquidity dries up, the arbitrage mechanism may fail, and the correlation between the premium rate and fund flows may decrease.
Furthermore, the premium rate is just one window into observing ETF fund movements.
For mature investors, the premium rate is just one piece of the puzzle.
It is recommended to conduct multi-dimensional cross-verification with the following indicators:
1. Changes in ETF Holdings: Rising holdings indicate institutions are accumulating; falling holdings indicate they are reducing positions. More direct than the premium rate, but data updates are delayed.
2. Futures Basis and Funding Rate: A positive basis and continuously high funding rates indicate overheated long sentiment and possible excessive optimism. Conversely, it indicates bearish dominance.
3. Put/Call Ratio in the Options Market: Puts are put options (bearish), Calls are call options (bullish). A rising ratio indicates rising market risk-off sentiment; a falling ratio indicates dominant optimism.
4. On-chain Large Transfers and Exchange Net Inflows: Large BTC transfers to exchanges often signal impending selling pressure. Large withdrawals from exchanges indicate accumulation.
For example:
When you observe: the premium rate is continuously negative, ETF holdings are decreasing, and exchange net inflows are rising.
Three signals point in the same direction: funds are withdrawing, selling pressure is accumulating.
At this time, you should at least increase vigilance and control your position size, rather than buying the dip.
A single indicator cannot show the full picture; multi-dimensional cross-verification is needed to improve the accuracy of judgment.
In this market, the more dimensions you observe, the smaller the information gap, but the time gap will always exist.
Whoever sees the direction of funds first gains an extra ounce of initiative.