Ethereum price relatively muted, bulls still aim key upside break

newsbtcPublished on 2022-12-26Last updated on 2022-12-26

Abstract

Ethereum is consolidating below the $1,230 resistance against the US Dollar. ETH could start a steady increase if it clears the $1,230 and $1,250 resistance levels.

Ethereum is consolidating below the $1,230 resistance against the US Dollar. ETH could start a steady increase if it clears the $1,230 and $1,250 resistance levels.
“”

  • Ethereum is slowly moving higher from the $1,190 support zone.
  • The price is now trading above $1,210 and the 100 hourly simple moving average.
  • There was a break above a key bearish trend line with resistance near $1,215 on the hourly chart of ETH/USD (data feed via Kraken).
  • The pair could gain bullish momentum if there is a clear move above $1,230 and $1,250.

“”

Ethereum Price Eyes Upside Break

“”
Ethereum price remained well bid above the $1,180 and $1,190 levels. ETH formed a base above the $1,190 level and started an upward move.

“”
There was a clear move above the $1,200 resistance zone and the 100 hourly simple moving average. Ether price climbed above the 50% Fib retracement level of the downward move from the $1,237 swing high to $1,193 swing low.
“”

Besides, there was a break above a key bearish trend line with resistance near $1,215 on the hourly chart of ETH/USD. The pair is now consolidating near the 61.8% Fib retracement level of the downward move from the $1,237 swing high to $1,193 swing low.

“”
An immediate resistance is near the $1,230 level. The next major resistance is near the $1,250 level. A clear upside break above the $1,250 resistance could start a steady increase. In the stated case, the price may perhaps rise towards the $1,300 resistance.

Ethereum Price

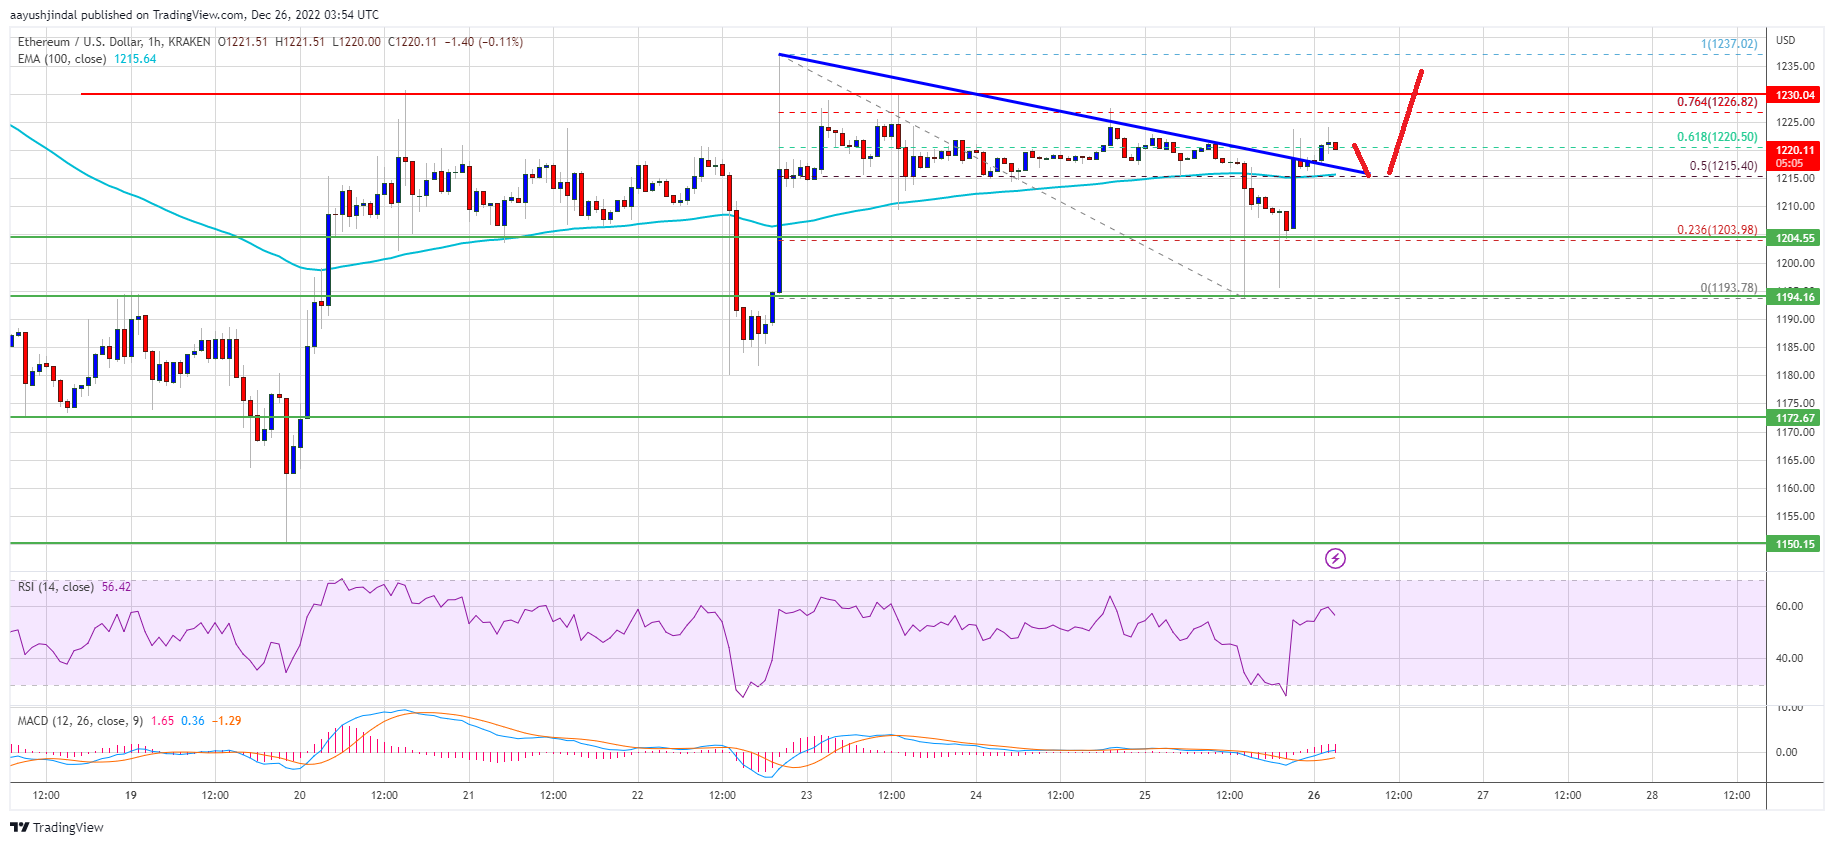
Source: ETHUSD on TradingView.com
“”

The next major resistance could be $1,350. If there is an upside break above the $1,350 resistance, the price might rise towards $1,400. Any more gains might send the price towards the $1,500 resistance zone.

“”

ETH Still In a Range?
“”

If ethereum fails to climb above the $1,230 resistance, it could start another drop. An initial support on the downside is near the $1,215 level and the 100 hourly simple moving average.
“”

The next major support is near the $1,200 level. The first major support is near the $1,190 level. A downside break below $1,190 might spark a move towards the $1,150 support. Any more losses could lead the price towards the $1,100 zone.

“”
Technical Indicators
“”

Hourly MACDThe MACD for ETH/USD is now gaining momentum in the bullish zone.
Hourly RSIThe RSI for ETH/USD is now above the 50 level.
Major Support Level – $1,190
Major Resistance Level – $1,230

Related Reads

Bitcoin Trading Strategy Breakdown: Celebrity Predictions and Classic Models All Fail, Only These Four Indicators Remain

Analysis of Bitcoin Trading Strategies: Why Celebrity Forecasts and Classic Models Fail, Leaving Only These Four Reliable Indicators This analysis examines the failure of common Bitcoin prediction methods and identifies four reliable indicators for constructing a trading strategy. The author reviewed all major BTC prediction approaches from 2017-2025, categorizing them into three groups: celebrity price targets (consistently over-optimistic), analytical models like Stock-to-Flow (broken post-2022), and on-chain signals. The key finding is that more data often creates confusion, not clarity. The strategy discards unreliable elements: celebrity predictions (incentivized to be extreme), pure models (invalidated by post-ETF market changes), and the Fear & Greed Index used alone (too many false signals). Four reliable indicators were selected: 1. **MVRV Z-Score:** Accurately identifies cycle bottoms when entering its green zone (e.g., 2018, 2020, 2022). Note: Its ability to call tops is now ineffective post-2024. 2. **SOPR (28-day MA):** Consistently signals bottoms when below 1.0, indicating holders are selling at a loss. 3. **ETF Net Flow:** A crucial post-2024 metric showing institutional momentum (e.g., sustained inflows = buying). 4. **Macro Liquidity (Fed policy & M2):** Sets the overall directional bias (e.g., bullish during easing cycles). The core strategy involves waiting for a multi-signal共振 (resonance). For example, a bottom signal requires MVRV in the green zone + SOPR < 1.0. A top signal requires overheated on-chain data + sustained ETF outflows. Macro policy sets the overall direction. The Fear & Greed Index is only used as a weighted confirmatory signal, never alone. Action is only taken when three or more indicators align. The author automated this into a monitoring system that sends Telegram alerts only when signals trigger. As of the article's date (April 15, 2026), the system showed a strong bottom signal: extreme fear (F&G=12), MVRV in the buy zone, and SOPR < 1.0. The only contrary signal was weak ETF flows. Historically, such triple on-chain共振 has preceded 100%+ returns. The conclusion emphasizes building a personal framework over relying on external predictions, allowing for iterative improvement and customization based on individual risk tolerance.

marsbit1h ago

Bitcoin Trading Strategy Breakdown: Celebrity Predictions and Classic Models All Fail, Only These Four Indicators Remain

marsbit1h ago

Trading

Spot
Futures
活动图片