Chainlink (LINK) Price Up 24%; On-Chain Data Indicates Bullish Sentiment Ahead

CoingapePubblicato 2022-03-22Pubblicato ultima volta 2022-03-24

Introduzione

Santiment reports in a tweet on Monday that the active address to price divergence chart shows points of bullish price movements.

Chainlink (LINK) is up nearly 24% in a week, with the current price trading at $15.65. According to data from on-chain analytics firm Santiment, the increase in active addresses activity is the reason behind this rally in the LINK price. Since February 24, the start of the Russia-Ukraine war, every rise in the active addresses had pushed the price to shoot higher.
Active Address Price Divergence Data Indicates Bullish Sentiment
Santiment reports in a tweet on Monday that the active address to price divergence chart shows points of bullish price movements. Typically, the LINK price has rallied after the active address to price divergence moves in the green zone, as depicted in the chart. The Santiment data also reveals the retracement levels where the price movements have generally reversed.

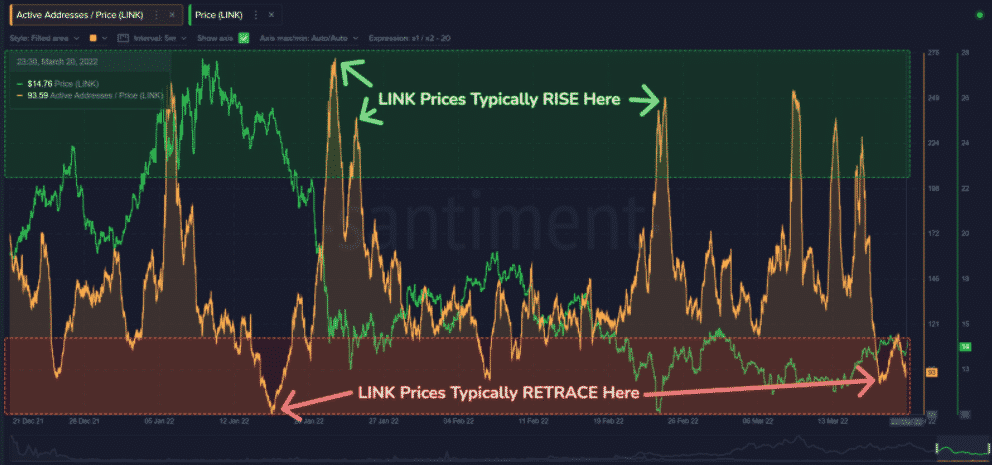
Source: Santiment “#Chainlink is +24% since bottoming out on #war news back on February 24th. Upticks have been driven by spikes in $LINK address activity, where pushes in active address/price divergence into the green zone have worked as excellent #bullish validators.“
In January, the Chainlink active address to price dipped massively, bottoming out near the level of 68, which resulted in the LINK price plummeting rapidly.
Also, in March, the Chainlink active address to price has moved in the green zone, forming numerous spikes, resulting in the LINK price moving higher. Thus, the current data validates bullish sentiment, pushing the price to move higher from here.
LINK Price Movement Expectations
As per the current Santiment active address price divergence data, the price is expected to move higher in the next couple of days. At the time of press, the LINK price has rallied nearly 7% in the last 24 hours, with the price trading near $15.65.

Letture associate

Both Suffer Massive Losses Exceeding $90 Billion, Which Is in Greater Peril: Strategy or Bitmine?

Facing massive paper losses exceeding $90 billion each amidst a sharp market downturn, "Digital Asset Treasury" (DAT) giants Strategy and Bitmine find themselves in a precarious position, but with different underlying risks. Strategy, heavily invested in Bitcoin (BTC), faces significant financial strain. Its strategy relies heavily on debt, including convertible notes and preferred stock (STRC) requiring substantial dividend payments. With its cash reserves dwindling and BTC offering no staking yield for cash flow, Strategy's high leverage makes it vulnerable. A continued price decline could force asset sales to meet obligations, potentially creating a negative feedback loop. Its market value has already fallen sharply. In contrast, Bitmine, an Ethereum (ETH) holder, appears on firmer financial ground. It primarily funds its purchases through equity offerings (like ATM programs), avoiding debt pressure. It also generates income by staking a large portion of its ETH holdings. While not immune to market drops and shareholder dilution concerns, Bitmine maintains more flexibility, recently announcing a new preferred share offering to raise further capital. The core divergence lies in their financing: Bitmine uses equity (investor money), while Strategy uses debt (borrowed money). Consequently, Bitmine currently faces less immediate liquidity pressure than Strategy, which must navigate the dual challenge of servicing debt/dividends and a declining core asset (BTC) price.

marsbit5 min fa

Both Suffer Massive Losses Exceeding $90 Billion, Which Is in Greater Peril: Strategy or Bitmine?

marsbit5 min fa

Where the AI Bubble Really Is: Which Layer of Players Are Naked

AI Bubble: Where It Really Is and Who's Swimming Naked This analysis dissects the AI industry not as a single entity but as a five-layer pyramid, arguing that bubbles are concentrated in specific tiers, not uniformly distributed. **Key Distinction from the 2000 Dot-com Bubble:** Unlike 2000, where companies had stock prices before revenue, today's leading AI players have massive, contract-backed revenue driving their valuations. Core infrastructure demand is real, with every GPU running at full capacity for paying customers. **The Five-Layer Pyramid & Bubble Assessment:** * **L0 (Fab/Manufacturing) & Top L4 (Leading AI Apps): NO BUBBLE.** Companies like TSMC, NVIDIA, major cloud providers (Microsoft, Google, Meta, Amazon), and top AI labs have real revenues and orders. Supply is tightly constrained by TSMC's disciplined capacity control and physical limits like power/land for data centers, preventing a supply glut. * **L1 (Memory): BATTLEGROUND.** Sky-high HBM margins could signal a new structural cycle or a classic "boom before bust." The oligopoly of three major players may enforce supply discipline, making this a high-stakes bet. * **L2 (Interconnect/Optical Modules): BUBBLE TERRITORY.** Companies like Lumentum and AAOI have seen stock surges (4-10x) far outpacing revenue growth. This hardware segment has lower physical barriers to expansion than fabs, allowing speculation. It mirrors the 2000 bubble's epicenter—optics. * **L3 (Infrastructure/"GPU Landlords"): VULNERABLE.** GPU leasing companies profit from the current compute shortage but own no long-term moat. Their business model relies on a temporary bottleneck that will ease as big tech expands and new tech (e.g., potential space-based data centers) emerges. * **L4 Long Tail (VC-backed Startups): STRONG BUBBLE SIGNALS.** VC funding concentration in AI is twice that of the 1999 peak. Many startups with little revenue use the valuation logic of successful giants to justify their own, creating high risk of a "valuation crunch" when funding dries up. **Critical Risks to Monitor:** 1. **GPU Depreciation & Accounting:** Companies extending the assumed useful life of GPUs artificially boost profits. The true economic life depends on future generational leaps from NVIDIA. 2. **"GPU Credit" & Off-Balance-Sheet Leverage:** Emerging structures where shell companies borrow to buy GPUs and lease them out (with chipmakers sometimes investing) move debt off major balance sheets. This echoes the "vendor financing" of 2000 and the securitization risks of 2008, though currently small-scale. 3. **TSMC Abandoning Caution:** If the primary supply bottleneck (TSMC's conservative capacity planning) breaks, runaway supply could trigger a bust. 4. **Algorithmic Efficiency Breakthrough:** A major leap in software efficiency could drastically reduce the need for raw compute hardware, undermining the investment thesis. **Conclusion:** The AI boom is expensive and has frothy areas, but its core is underpinned by real demand and physical supply constraints. The bubble risk is layered: most present in optical components, GPU leasing, and the long-tail startup ecosystem, while the foundational chip manufacturing and leading application layers remain relatively solid—for now.

marsbit17 min fa

Where the AI Bubble Really Is: Which Layer of Players Are Naked

marsbit17 min fa

Standing in the Light: A Comprehensive Guide to the Optical Module and CPO Supply Chain

"Standing in the Light: Understanding the Optical Module and CPO Industry Chain" This article analyzes the critical role of optical communication technology, specifically optical modules and Co-Packaged Optics (CPO), as the "nervous system" for modern AI data centers. With exponential growth in AI computational demands (e.g., NVIDIA's Vera Rubin architecture), traditional electrical interconnects using copper cables face severe bottlenecks in bandwidth, power consumption, and signal integrity over distance. The core function of an optical module is to act as a "translator," converting electrical signals from chips into optical signals for transmission over fiber (and vice-versa). Key internal components include lasers, modulators, photodetectors, drivers, and DSP chips. The industry is currently transitioning from 800G to 1.6T modules. However, the future lies in CPO. This next-generation technology integrates the optical engine directly with the switch ASIC/XPU on the same package substrate, drastically reducing power consumption (by ~3.5x according to NVIDIA), overcoming bandwidth density limits, and minimizing signal attenuation compared to traditional pluggable modules. Key challenges for CPO include advanced packaging capacity (dominated by TSMC), thermal management, repairability, and standardization. The article details the broader technology landscape, including Near-Packaged Optics (NPO, a pragmatic intermediate step), Linear-drive Pluggable Optics (LPO), Optical I/O (OIO for chip-level integration), and Optical Circuit Switches (OCS). A comprehensive CPO industry chain is mapped, highlighting shifting power dynamics: * **Architecture Definers:** NVIDIA, Broadcom, and Marvell now hold greater influence. * **Advanced Packaging & Manufacturing:** TSMC is central; Fabrinet is a key EMS player. * **Lasers ("The Heart"):** A strategic bottleneck. EML lasers are led by Lumentum and Coherent (both receiving major NVIDIA investments). CW lasers, favored for CPO/silicon photonics, see strong Chinese players like Source Photonics and Sicoya. * **Silicon Photonics Chips:** The mainstream path for CPO engines, with key players like Broadcom, Intel, Marvell, and China's Accelink. * **Fiber Connectivity Components:** A major new, high-growth market created by CPO, including Fiber Array Units (FAU), Polarization-Maintaining Fiber (PMF), and MPO connectors. Companies like Tianfu Communication and US Conec are leaders. * **Fiber & Cable:** Experiencing a super-cycle (e.g., Corning, Yangtze Optical Fiber). * **PCB/Substrates:** Requiring advanced materials (e.g., Shengyi Tech). * **DSP & SerDes:** Functions are integrated into switch ASICs in the CPO era (e.g., Broadcom, Astera Labs). * **Optical Module Makers:** Transitioning from standalone module suppliers to providers of optical engines and NPO/LPO solutions while riding the current pluggable boom (e.g., Zhongji Innolight, Eoptolink). The investment timeline is segmented: Short-term (2026-2027) features the "last feast" for pluggable modules and CPO's initial rollout. Medium-term (2027-2029) will see CPO expand and NPO peak. Long-term (2029-2032+) involves CPO/OIO penetration into intra-rack scaling. In conclusion, optical interconnects are fundamental to AI infrastructure. The competitive landscape sees US firms leading in architecture and high-end chips, TSMC in advanced packaging, and Chinese firms holding strong positions in modules, connectivity components, CW lasers, and fiber/cable. The future belongs to companies that can navigate the technological shift from "selling shovels" (modules) to "building highways" (CPO/OIO infrastructure).

marsbit27 min fa

Standing in the Light: A Comprehensive Guide to the Optical Module and CPO Supply Chain

marsbit27 min fa

Trading

Spot
Futures

Articoli Popolari

Come comprare LINK

Benvenuto in HTX.com! Abbiamo reso l'acquisto di ChainLink (LINK) semplice e conveniente. Segui la nostra guida passo passo per intraprendere il tuo viaggio nel mondo delle criptovalute.Step 1: Crea il tuo Account HTXUsa la tua email o numero di telefono per registrarti il tuo account gratuito su HTX. Vivi un'esperienza facile e sblocca tutte le funzionalità,Crea il mio accountStep 2: Vai in Acquista crypto e seleziona il tuo metodo di pagamentoCarta di credito/debito: utilizza la tua Visa o Mastercard per acquistare immediatamente ChainLinkLINK.Bilancio: Usa i fondi dal bilancio del tuo account HTX per fare trading senza problemi.Terze parti: abbiamo aggiunto metodi di pagamento molto utilizzati come Google Pay e Apple Pay per maggiore comodità.P2P: Fai trading direttamente con altri utenti HTX.Over-the-Counter (OTC): Offriamo servizi su misura e tassi di cambio competitivi per i trader.Step 3: Conserva ChainLink (LINK)Dopo aver acquistato ChainLink (LINK), conserva nel tuo account HTX. In alternativa, puoi inviare tramite trasferimento blockchain o scambiare per altre criptovalute.Step 4: Scambia ChainLink (LINK)Scambia facilmente ChainLink (LINK) nel mercato spot di HTX. Accedi al tuo account, seleziona la tua coppia di trading, esegui le tue operazioni e monitora in tempo reale. Offriamo un'esperienza user-friendly sia per chi ha appena iniziato che per i trader più esperti.

835 Totale visualizzazioniPubblicato il 2024.12.13Aggiornato il 2026.06.02

Come comprare LINK

Discussioni

Benvenuto nella Community HTX. Qui puoi rimanere informato sugli ultimi sviluppi della piattaforma e accedere ad approfondimenti esperti sul mercato. Le opinioni degli utenti sul prezzo di LINK LINK sono presentate come di seguito.

活动图片