$70,000 and a Record Short Squeeze: The Start of a New Bitcoin Bull Cycle or a Bull Trap?

cryptonews.ruPublished on 2026-08-20Last updated on 2026-08-20

Abstract

Bitcoin surged past $70,000 on August 20, marking a 9% gain in 24 hours. Analysts note this triggered a historic short squeeze, forcing bearish traders to cover positions. The breakout above the key $66,000 resistance level is seen by many, including Crypto Candy and Michaël van de Poppe, as a shift to a bullish market structure, with targets set at $70,700, $75,000, and $73,600, provided support holds above $65,000. Daan Crypto Trades highlights a bullish engulfing weekly candle, suggesting a potential major trend reversal if the week closes above the 200-day EMA and a key bull market support band. However, trader Roman urges caution, pointing to low trading volume and a potential bearish divergence on weekly charts, which could indicate a retest of recent lows before a sustained uptrend. An AI-driven historical analysis draws parallels to a similar short squeeze in summer 2021, warning that such sharp rallies after consolidation can be temporary, often followed by a retest of previous support levels rather than an immediate, sustained bull market. The overall sentiment is cautiously optimistic but acknowledges the possibility of further volatility.

Bitcoin surpassed the $70,000 mark on August 20, with the asset's growth exceeding 9% over 24 hours. According to crypto YouTuber Crypto Rover, this event can be called the largest short squeeze in market history—traders who bet on a decline were forced to close their positions amid a sharp price increase.
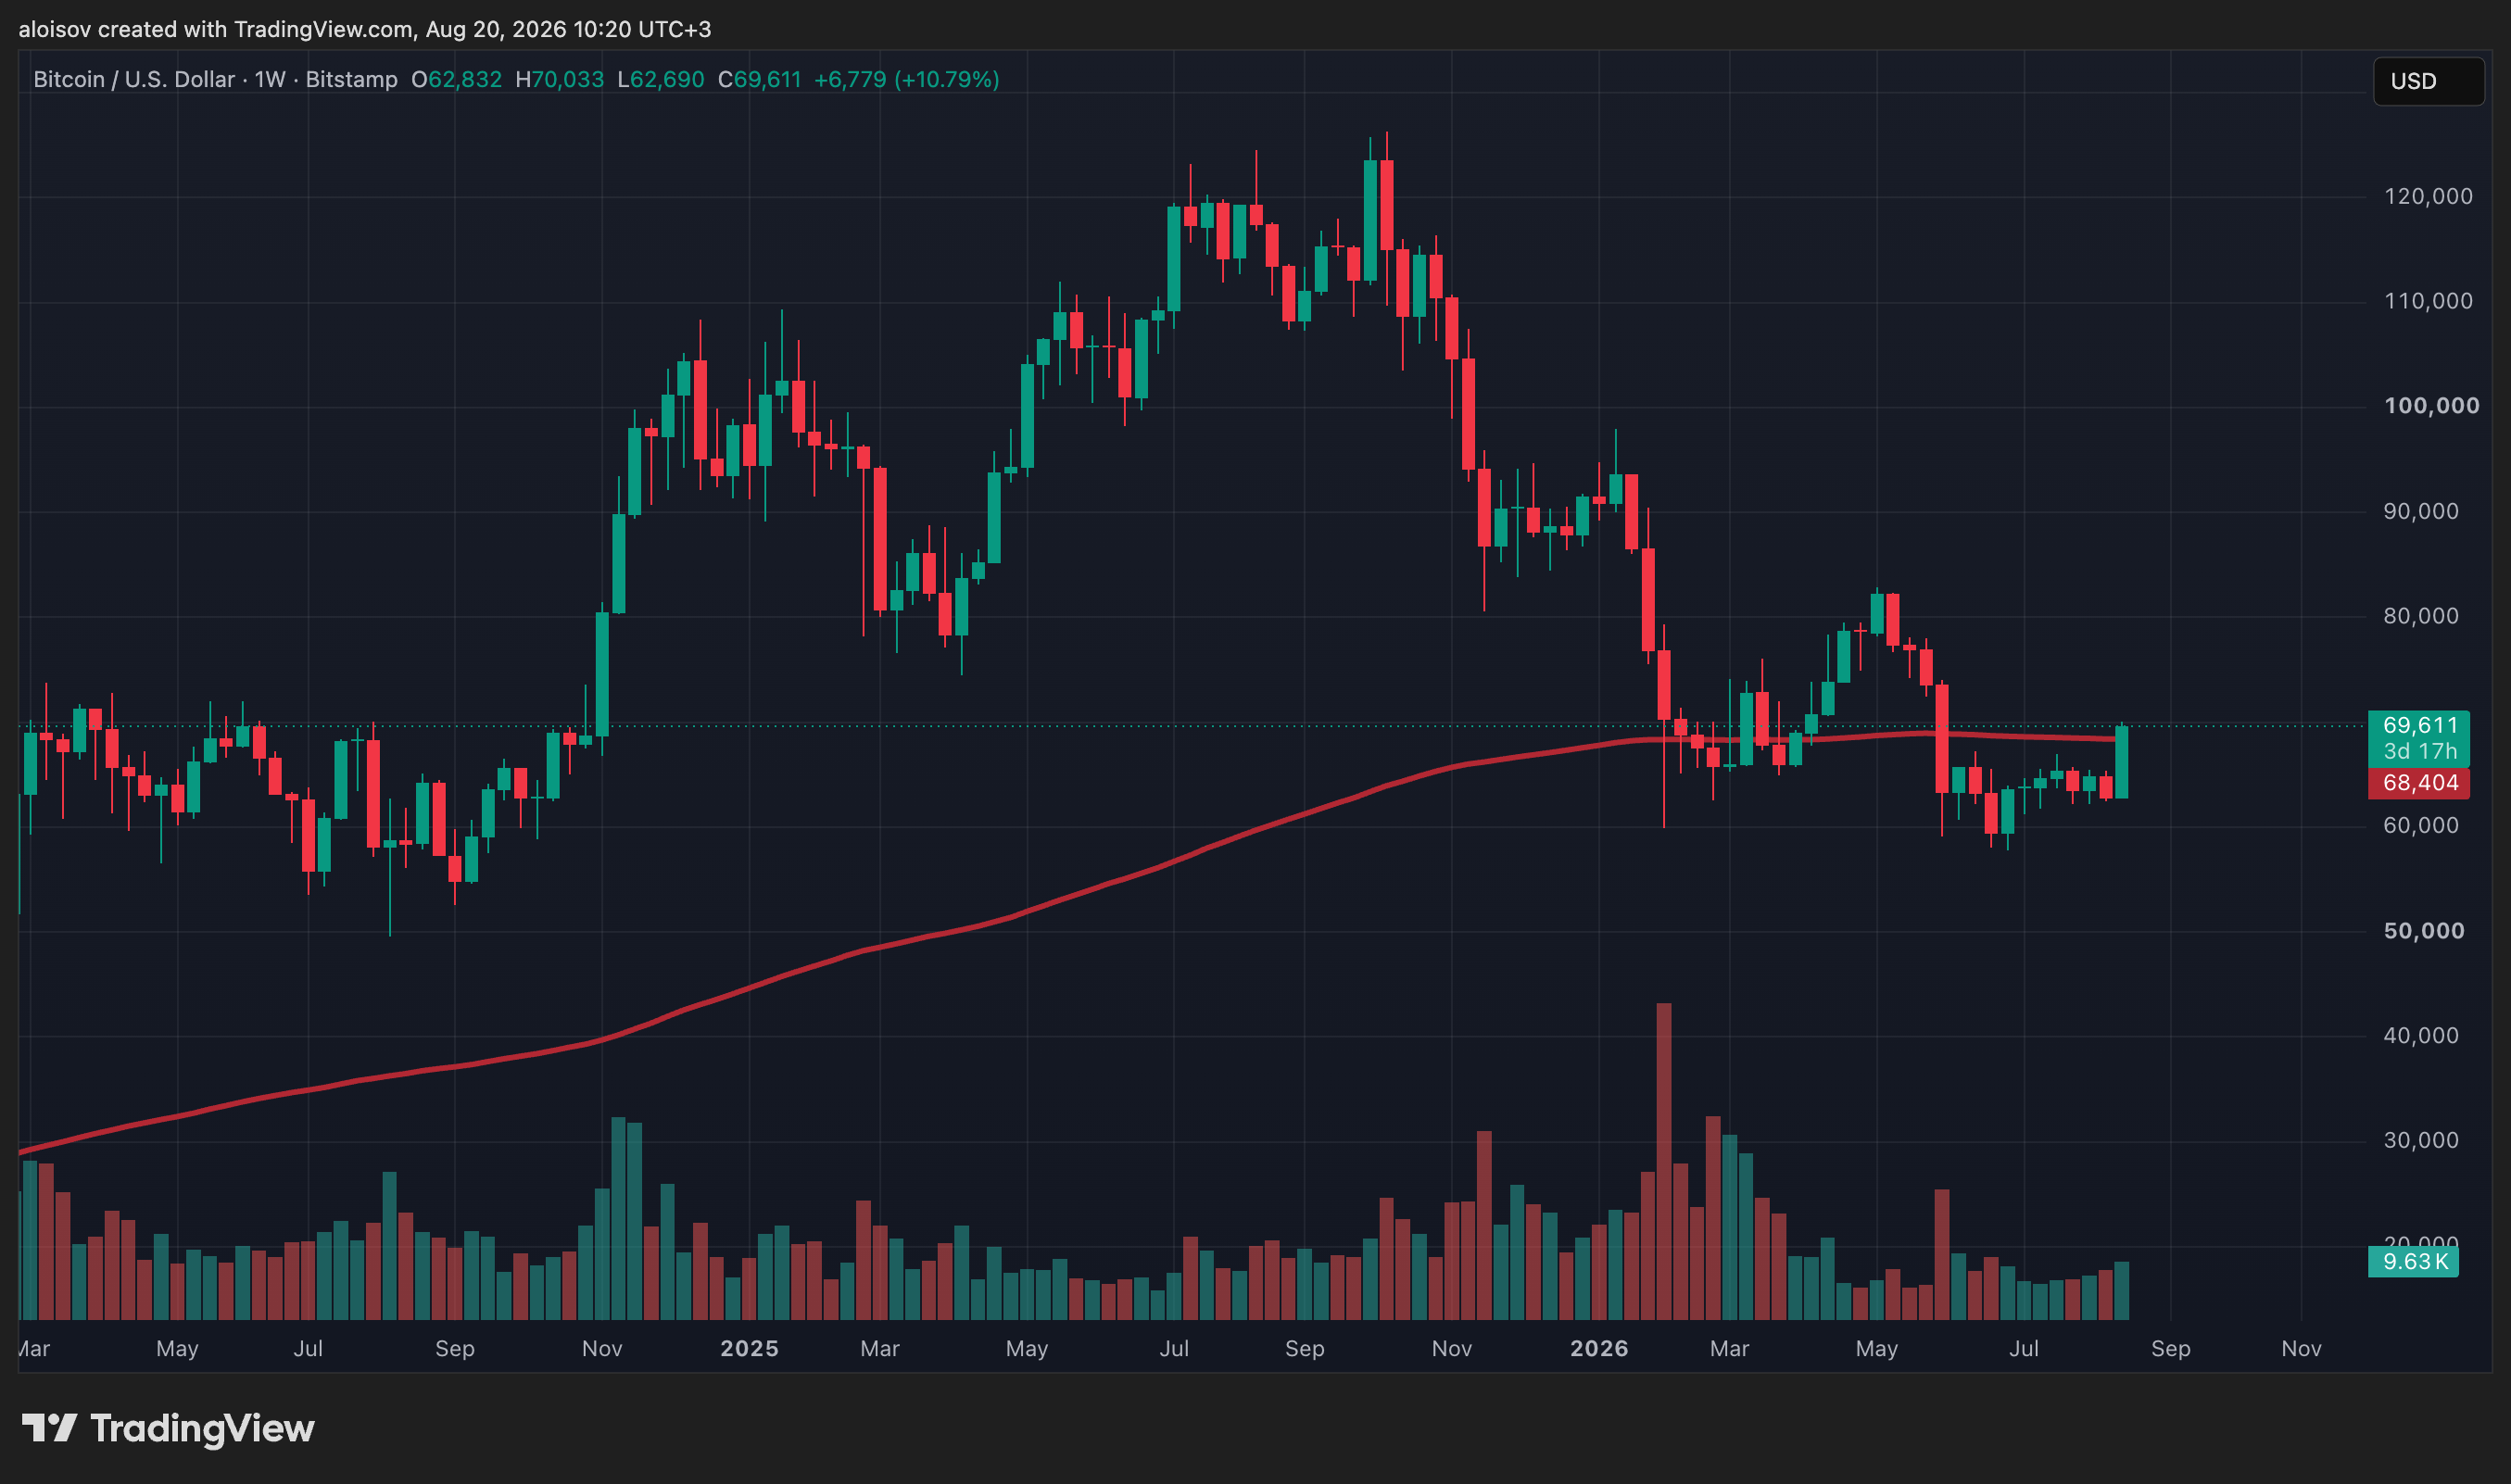
1-week chart of $BTC/USD and 200EMA. Source: Bitstamp

Breakout of Key Resistance

Analyst and trader Crypto Candy notes that after a prolonged consolidation, Bitcoin overcame all bearish barriers and closed above the previously marked resistance level of $66,000. According to her, the asset remained in a bearish zone as long as it stayed below this mark, but now the situation has changed: market sentiment has turned bullish. A short-term correction is not ruled out, but the overall scenario suggests a move first to $70,700, and then to $75,000. This forecast remains valid as long as the price stays above $65,000.
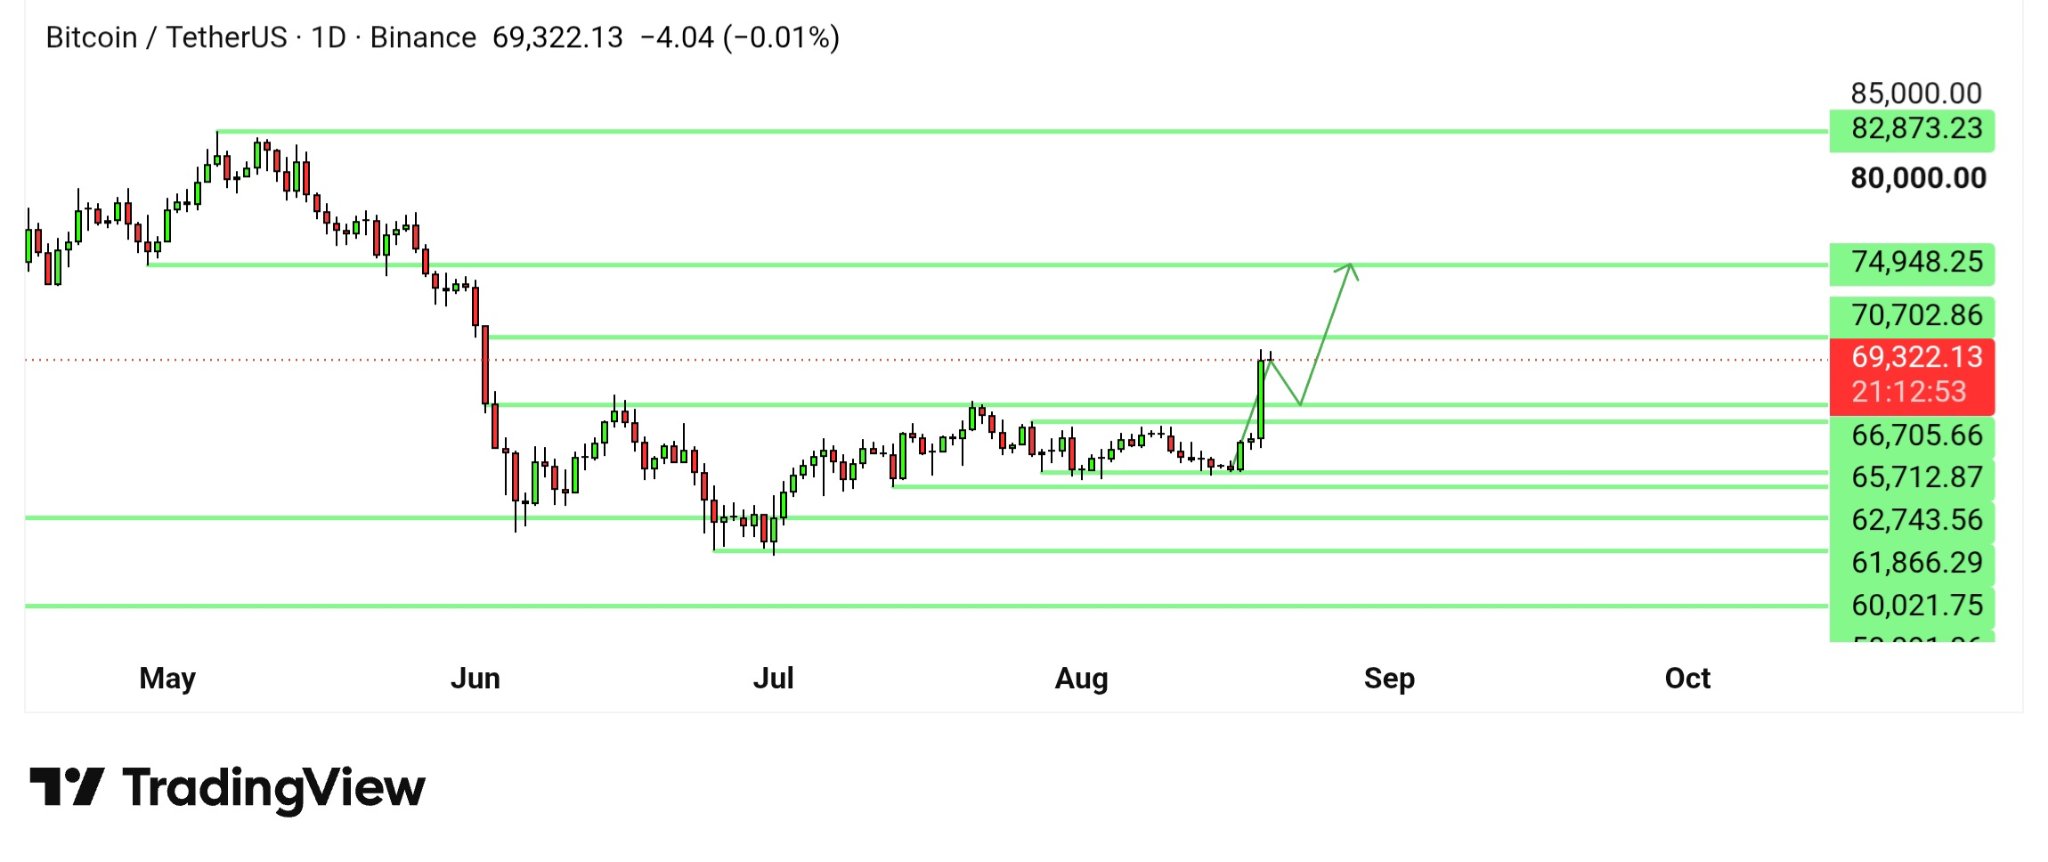
1-day chart of $BTC/USD. Analysis: Crypto Candy

A similar view is held by crypto trader, analyst, and entrepreneur Michaël van de Poppe. He points out that the higher the market rises, the more likely it is that the bottom of the bear cycle has already been formed. Bitcoin has exited the range and transitioned into an uptrend, therefore, in his opinion, attention should be paid to pullbacks on lower timeframes as points for opening long positions, and he names the $73,600 level as the next target on higher timeframes.
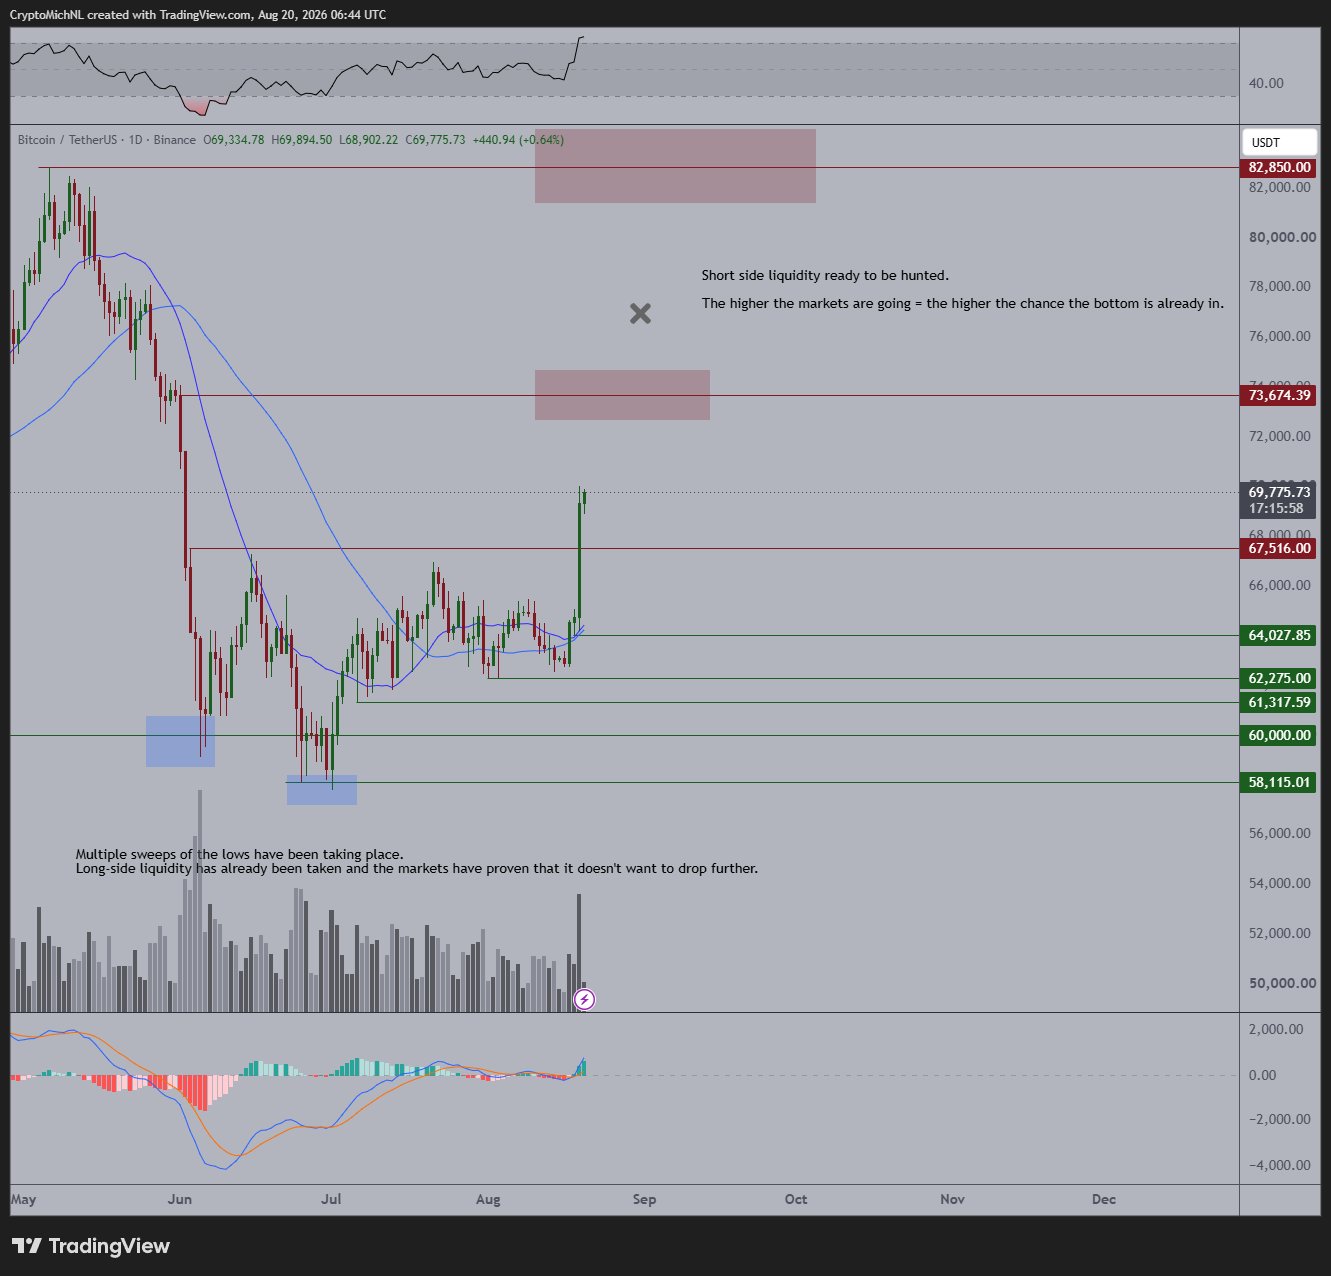
1-day chart of $BTC/USD. Analysis: Michaël van de Poppe

Confirmation of Reversal on Weekly Chart

Trader Daan Crypto Trades draws attention to the formation of a bullish engulfing weekly candlestick for Bitcoin. He names the 200-day exponential moving average on the weekly chart and the bull market support band, located just above the current price, as the next significant levels. In his opinion, a weekly close above these levels will confirm a full-fledged trend reversal on the higher timeframe.
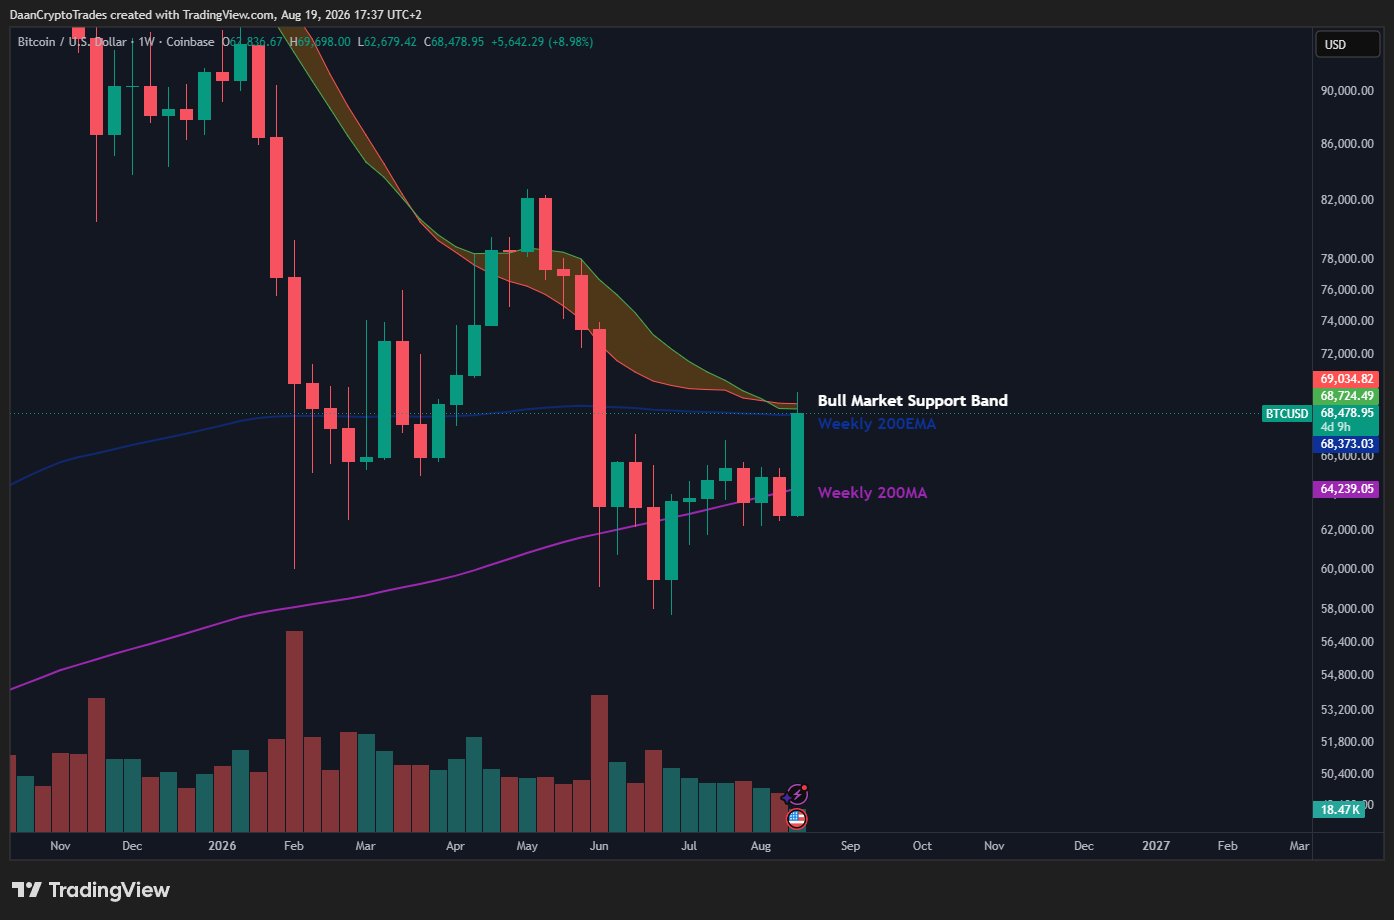
1-week chart of $BTC/USD. Analysis: Daan Crypto Trades

A more cautious position is taken by trader Roman. He admits he would like to see confirmation of a formed bottom for Bitcoin but draws attention to an important detail: the price increase on the weekly chart is accompanied by low trading volume and the potential formation of a bearish divergence. According to him, this does not rule out the possibility that the cycle minimum has already been passed, but it allows for a scenario where the market will renew the local minimum once more before finally turning upward.
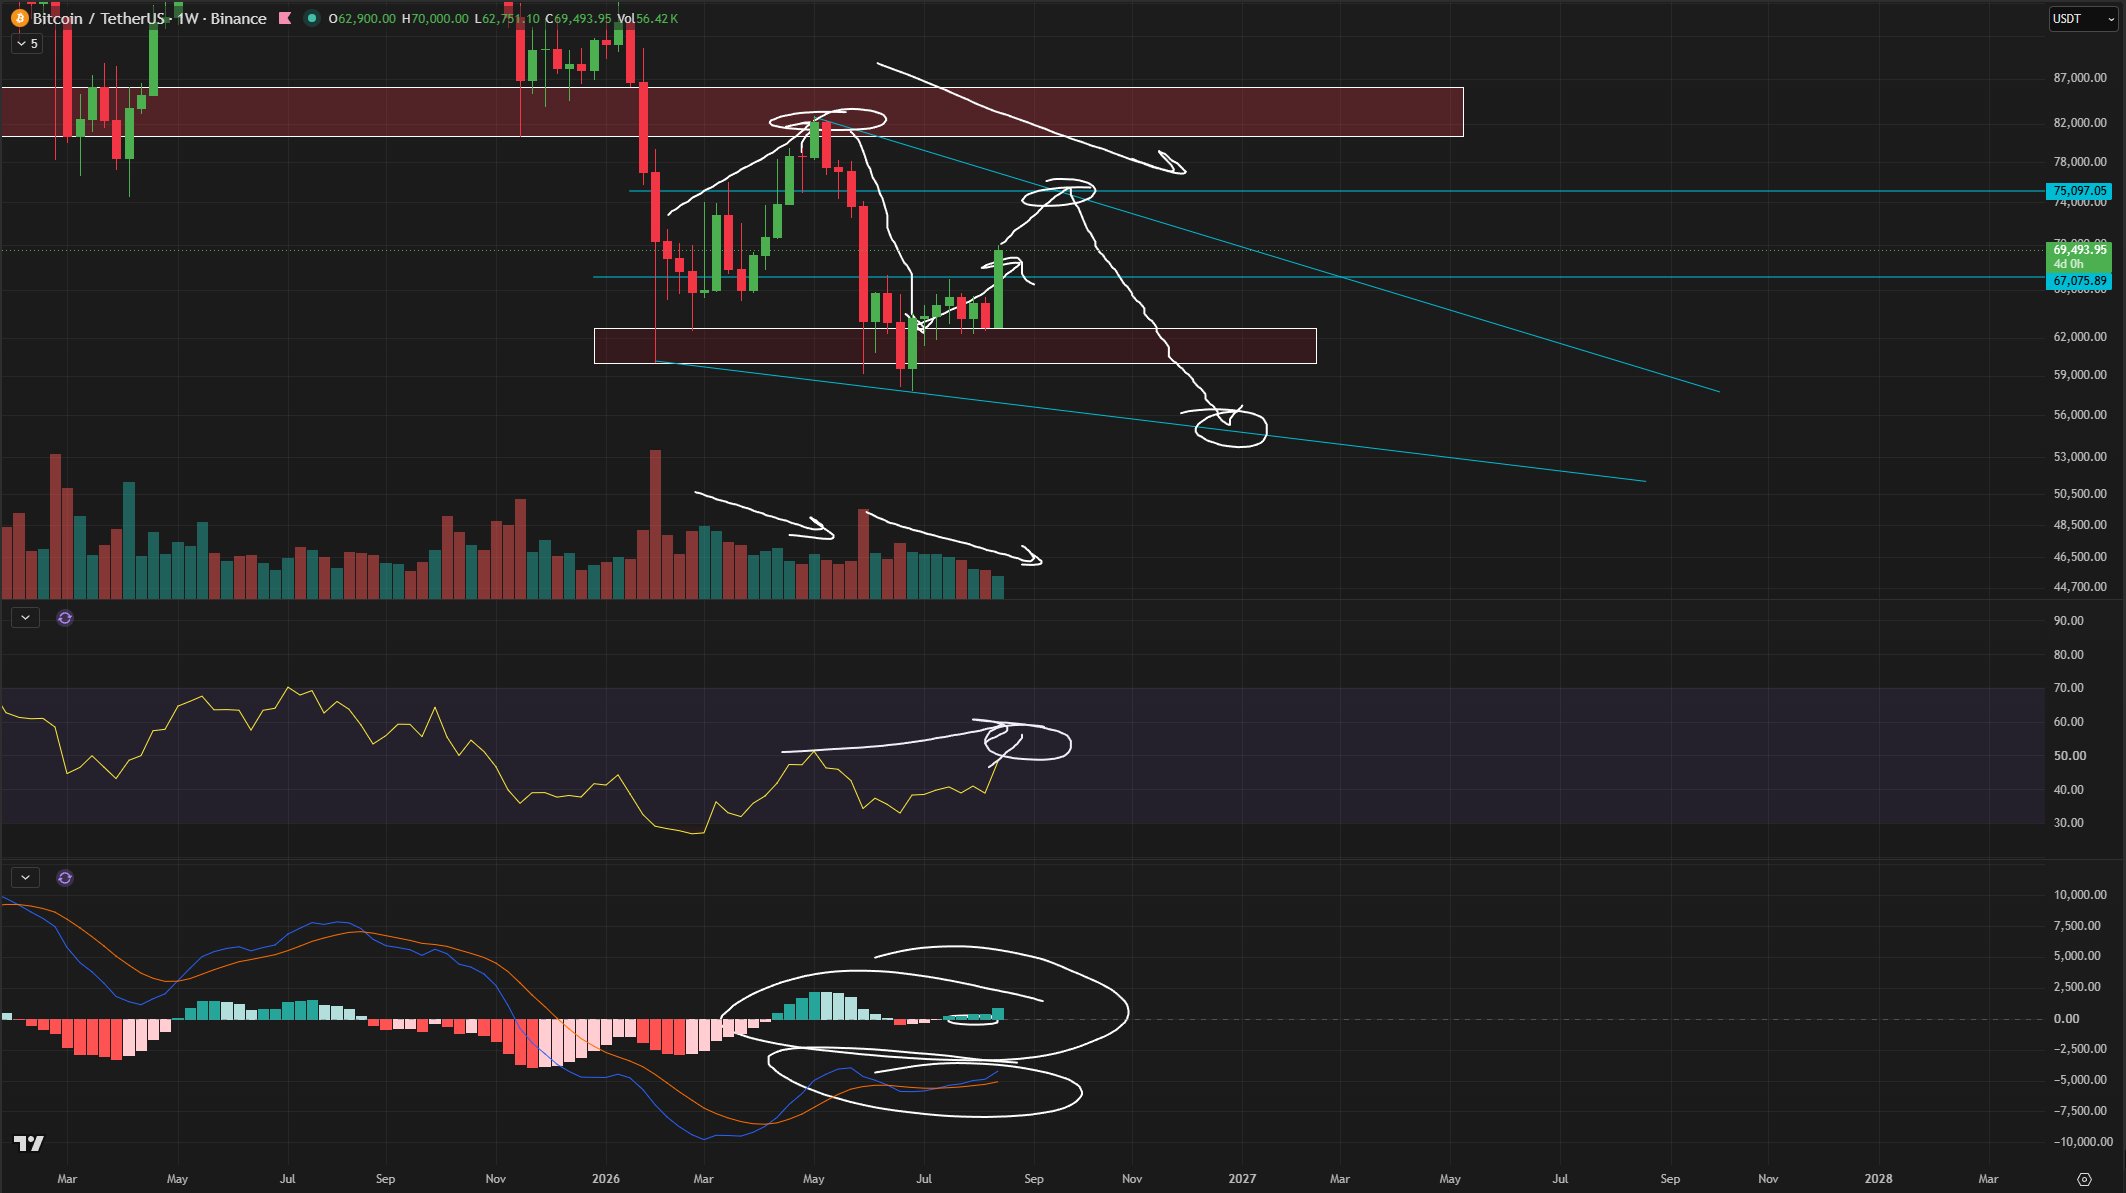
1-week chart of $BTC/USD. Analysis: Roman

AI Opinion

From the perspective of machine data analysis, the current rise of Bitcoin to $70,000 repeats the structure of events from five years ago. In the summer of 2021, the asset already experienced a similar short squeeze: then, the sum of short position liquidations exceeded $1 billion in one day, and the price bounced back almost 20% in a matter of hours. The parallel shows that sharp movements after prolonged consolidation often turn out to be short-term impulses rather than a sustainable trend reversal—the market often returns to testing previous lows after such surges.

end-content

Related Questions

QAccording to the article, what key resistance level did Bitcoin break above, and what is the significance of this event?

ABitcoin broke above the key resistance level of $66,000. The significance, as noted by analyst Crypto Candy, is that the asset was previously in a bearish zone while trading below this level, but the breakout has now shifted market sentiment to bullish.

QWhat is the main concern raised by trader Roman regarding the current Bitcoin price rise?

ATrader Roman's main concern is that the price rise on the weekly chart is accompanied by low trading volume and the potential formation of a bearish divergence. This suggests the possibility that the market might retest the recent low again before a definitive upward reversal.

QWhat historical event does the AI analysis compare the current Bitcoin surge to, and what key parallel does it draw?

AThe AI analysis compares the current surge to a similar short squeeze event in the summer of 2021. It draws a parallel that sharp moves after prolonged consolidation are often short-lived impulses rather than sustainable trend reversals, and the market frequently retests previous lows after such spikes.

QWhat price target does analyst Crypto Candy set for Bitcoin in the near term, and what is the key condition for this scenario to remain valid?

AAnalyst Crypto Candy sets near-term price targets of $70,700 and then $75,000 for Bitcoin. The key condition for this bullish scenario to remain valid is for the price to hold above $65,000.

QWhat specific confirmation does trader Daan Crypto Trades say is needed to confirm a full-fledged trend reversal on the higher timeframe?

ATrader Daan Crypto Trades states that a weekly close above the 200-day exponential moving average (EMA) on the weekly chart and the bull market support band is needed to confirm a full-fledged trend reversal on the higher timeframe.

Related Reads

Some Thoughts on This Trade During the Meta $1.4 Trillion Ruling

During a trial where Meta faces a potential penalty range from $400 million to $1.4 trillion—a difference of five orders of magnitude—the company's stock has underperformed the S&P 500 by roughly 8 percentage points, shedding about $110 billion in market value. The final amount will be determined solely by Judge Yvonne Gonzalez Rogers, as this is a bench trial with an advisory jury. While some might consider short-term options to bet on the ruling date, such a strategy is mathematically challenged and costly due to timing uncertainty and elevated implied volatility. A more fundamental view suggests Meta's current valuation, trading at approximately 16.9 times forward earnings—below its historical average—is applied to artificially depressed profits due to heavy AI infrastructure investments. Even a worst-case regulatory outcome, such as restrictions on data collection from teens, might be less severe than perceived, as Meta's core asset is its advertising monetization engine, not merely owning a young user base. The article contrasts this event with the Google Chrome remedy ruling, highlighting differences in legal posture and settlement dynamics. The author describes their analytical approach, which includes monitoring court dockets via automated tools, prediction markets, insider filings, and options flow to estimate ruling probabilities and timing, rather than relying on news summaries. The piece concludes that owning Meta stock at its current multiple offers a "free option" on the trial outcome, with zero holding cost if the catalyst does not materialize.

marsbit12m ago

Some Thoughts on This Trade During the Meta $1.4 Trillion Ruling

marsbit12m ago

Trading

Spot
活动图片