Analizando si FET puede mantener su nivel crucial o caer a $0.20

ambcryptoPubblicato 2026-03-31Pubblicato ultima volta 2026-03-31

Introduzione

El token Artificial Superintelligence Alliance (FET) ha caído más del 8% y cotiza cerca de $0.229, nivel crítico para su tendencia. Los datos de derivados y el sentimiento de los operadores apuntan a una posible continuación de la tendencia bajista, con objetivos en $0.20 e incluso $0.1737 según analistas. En el gráfico de 4 horas, FET muestra un patrón de triángulo descendente y podría romper su soporte clave en $0.2270, lo que desencadenaría una caída adicional del 10%. Sin embargo, los grandes holders (top 100 direcciones) han aumentado sus tenencias en un 2.04% en la última semana, lo que sugiere acumulación a largo plazo. El indicador ADX (13.22) refleja una tendencia débil, pero la reducción de reservas en exchanges respalda un posible interés comprador subyacente.

Artificial Superintelligence Alliance [FET] ha caído más del 8% y cotizaba cerca de $0.229 al cierre de esta edición, un nivel que parece ser un punto crucial para el activo. Además, el fortalecimiento de las métricas de derivados junto con comentarios de expertos refuerza y potencialmente confirma que FET podría continuar su movimiento a la baja.

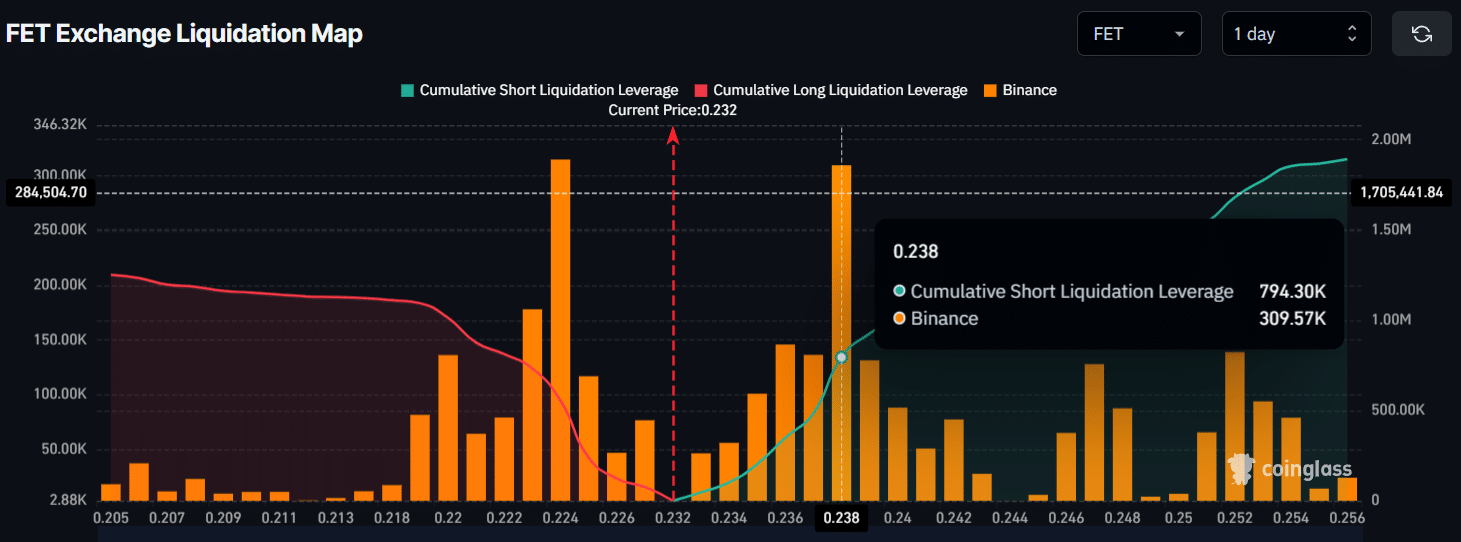
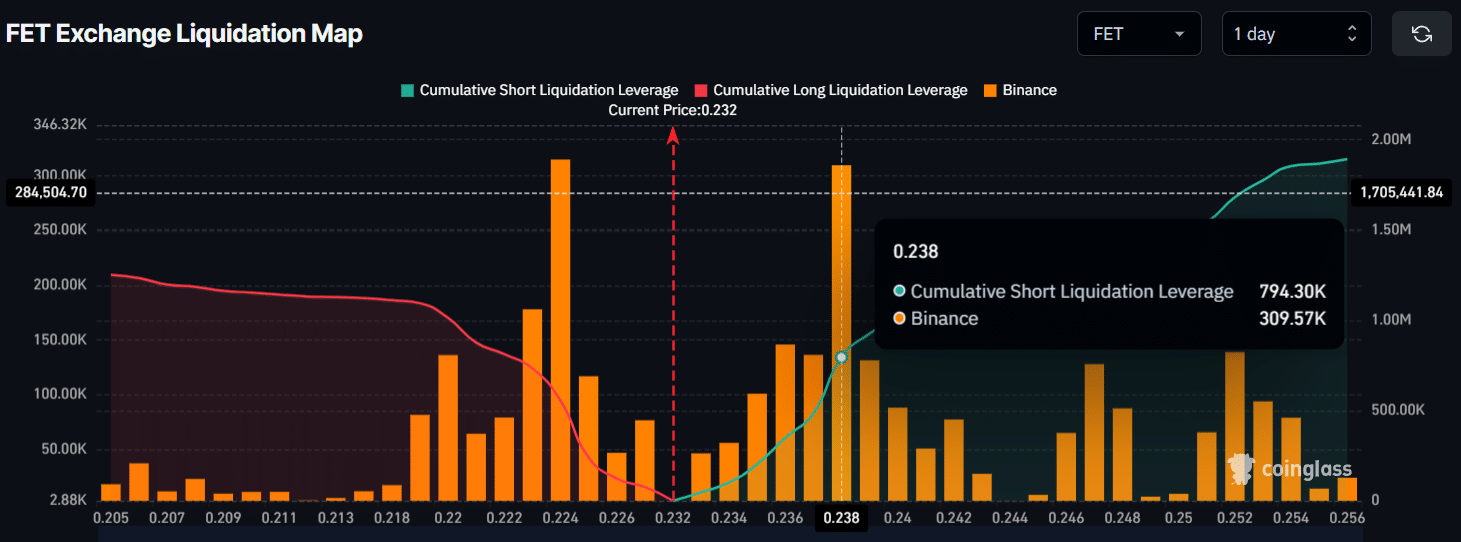
Mientras el mercado en general lucha, los datos de CoinGlass muestran que los traders intradía siguen de cerca la tendencia y apuestan por más caídas.

Según el mapa de liquidación de exchanges de FET, los traders han mostrado un fuerte interés alrededor de $0.224 en la baja y $0.238 en la alza. En estos niveles, han construido aproximadamente $294K en posiciones apalancadas largas y $794K en posiciones apalancadas cortas.

Estas apuestas indican que los osos actualmente dominan el activo a corto plazo, mientras que los toros parecen estar exhaustos.
Fuente: CoinGlass

De hecho, un analista de criptomonedas recientemente hizo eco de una perspectiva similar sobre el precio de FET. En una publicación en X, el analista explicó que el activo se estaba retrayendo hacia una zona de oferta y mostraba claras señales de agotamiento. Además, FET parece estar posicionado para tomar liquidez antes de girar a la baja. Para esta potencial caída, el experto delineó niveles objetivo, señalando que FET podría caer a $0.20 y $0.1737.

Acción del precio de FET y niveles clave a vigilar

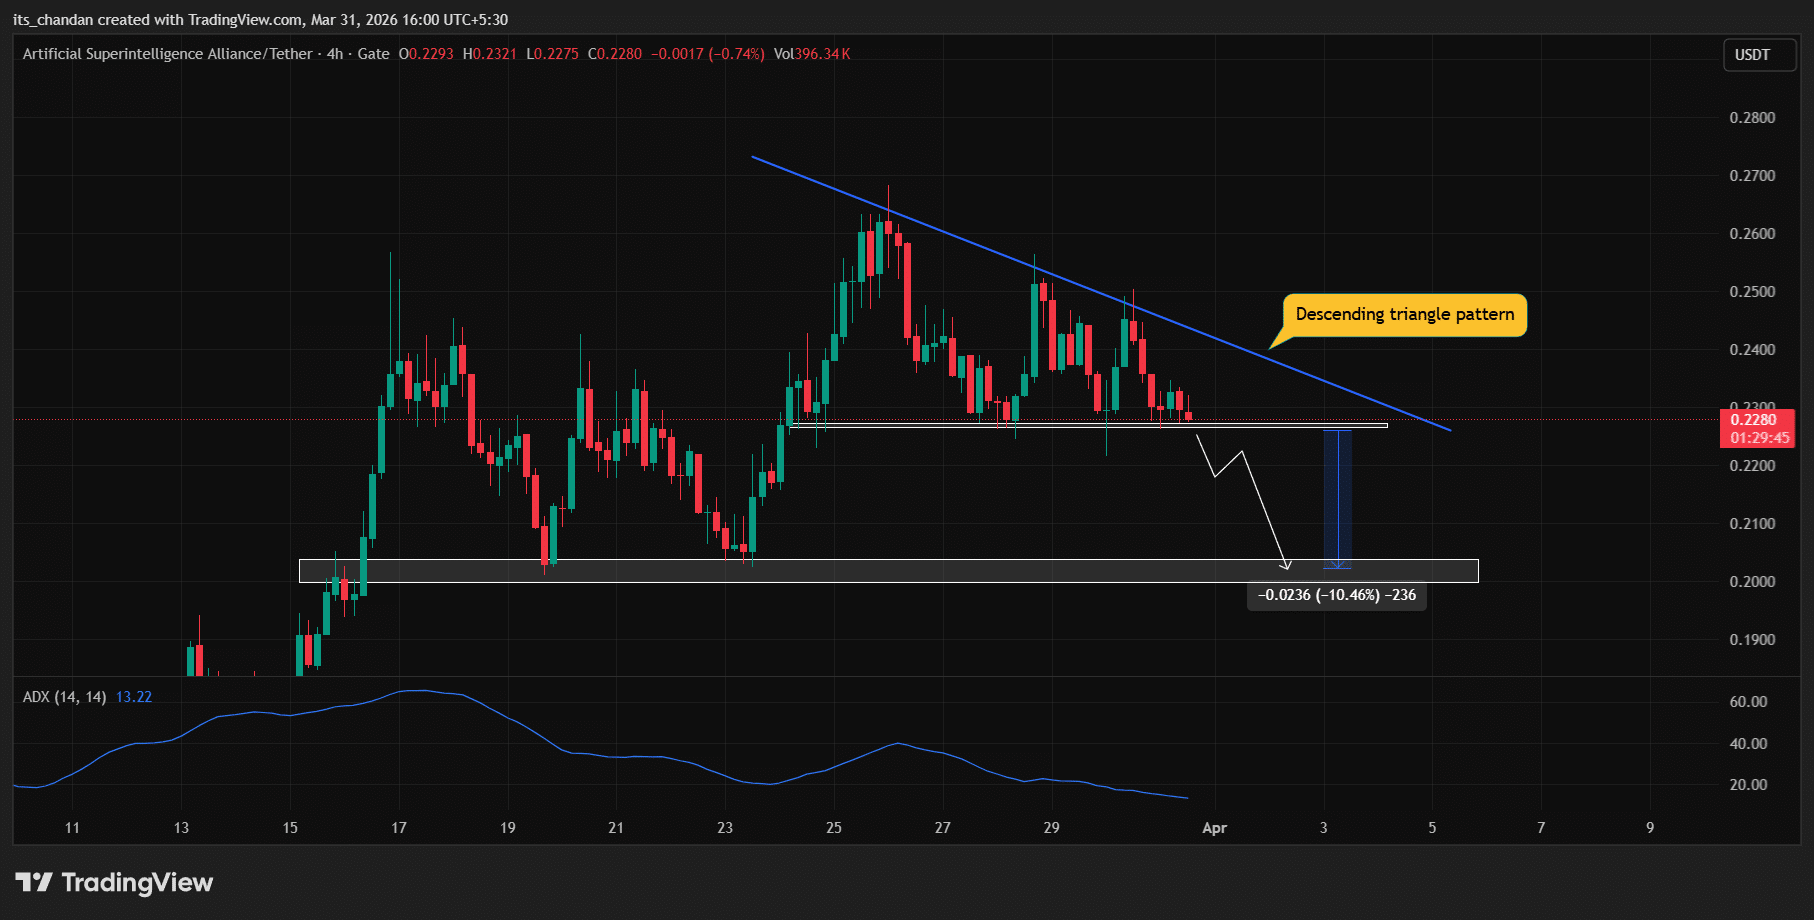
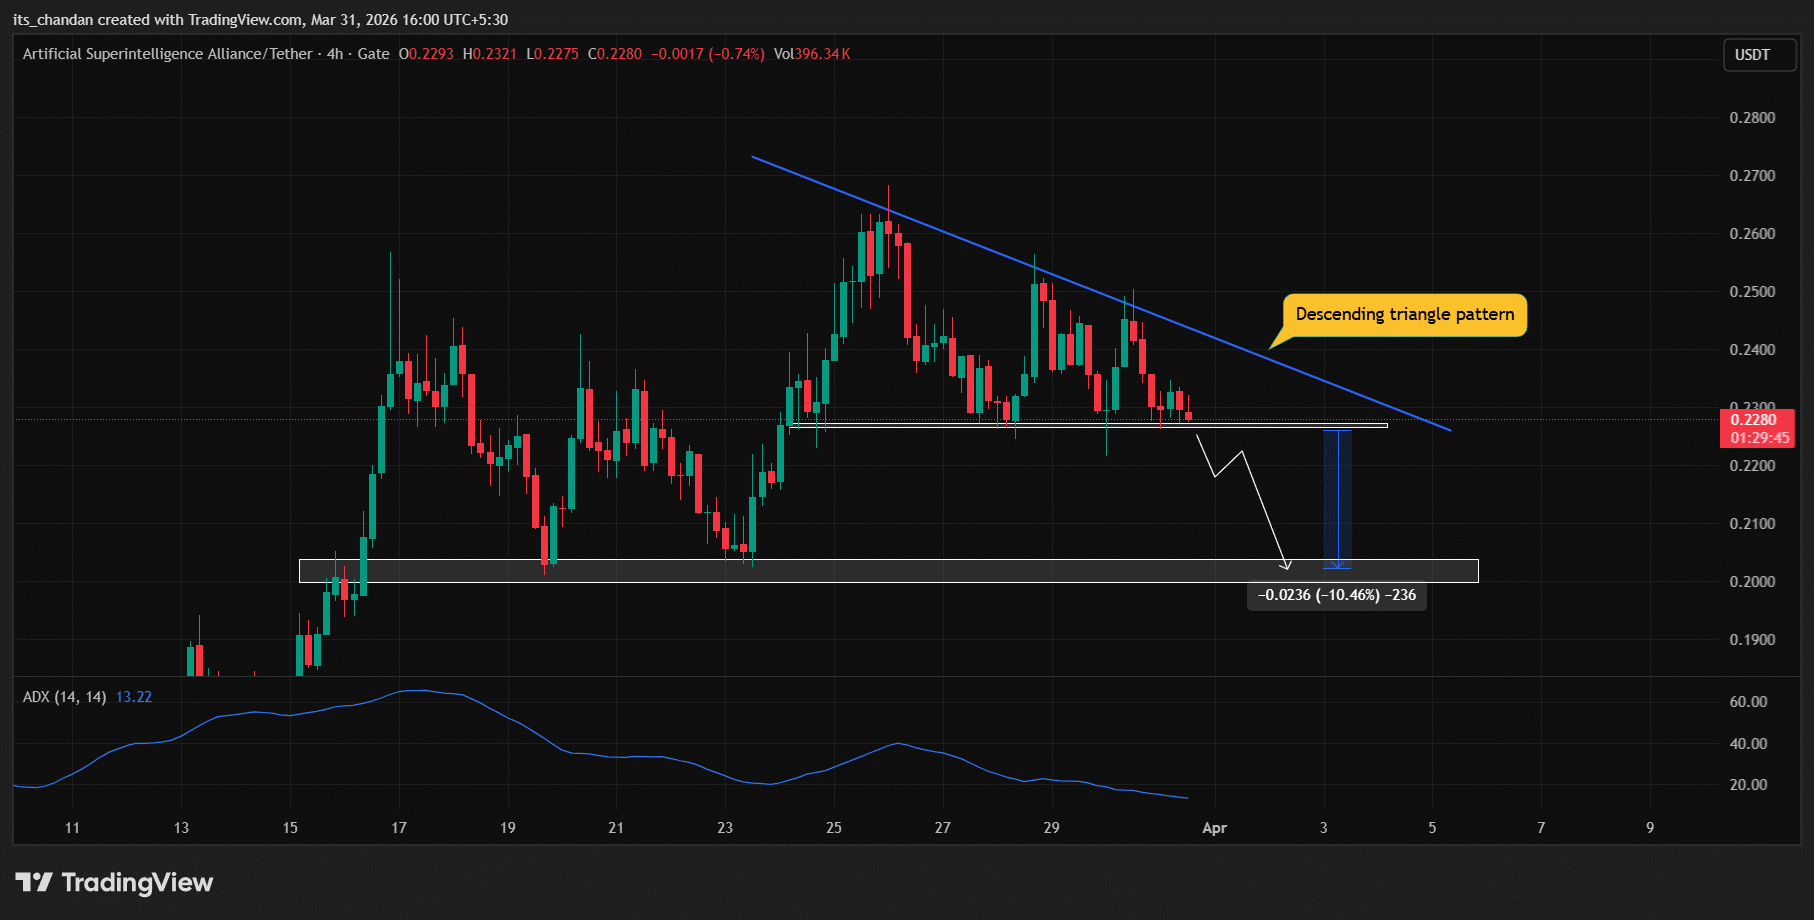
En el gráfico de cuatro horas, FET parece bajista, ya que la caída del token ha llevado el precio a un nivel crucial, un nivel que el activo ha mantenido consistentemente desde el 26 de marzo de 2026. De hecho, el gráfico sugiere que FET ha formado un patrón de triángulo descendente y ahora está listo para una ruptura a la baja.
Fuente: TradingView

Basado en la acción del precio actual, si FET no logra mantener su nivel de soporte clave de $0.2270 y cierra una vela de cuatro horas por debajo de él, el precio podría potencialmente declinar otro 10%, alcanzando el nivel de $0.20 en los próximos días.

Sin embargo, una reversión también es posible si el precio se mantiene por encima del nivel de $0.2270. Un movimiento al alza probablemente solo comenzaría si FET rompe por encima de la línea de tendencia descendente del patrón.

Junto con esto, el indicador técnico Índice Direccional Promedio (ADX) se situó en 13.22, por debajo del umbral clave de 25, indicando un impulso direccional débil. Esto sugiere que el activo podría tener dificultades antes de continuar su movimiento a la baja.

Las 100 direcciones principales aumentan sus tenencias

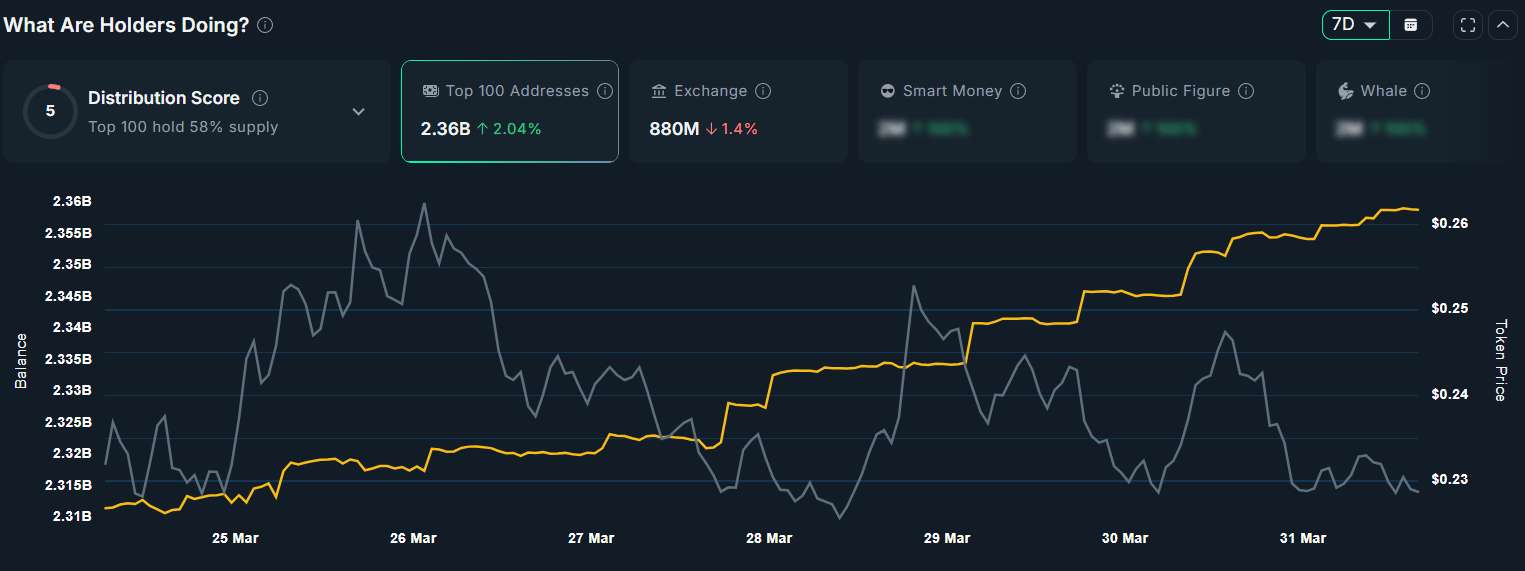
A pesar de todos estos desarrollos bajistas durante las últimas 24 horas, la herramienta de análisis Nansen indica que la perspectiva a largo plazo de FET sigue siendo alcista.

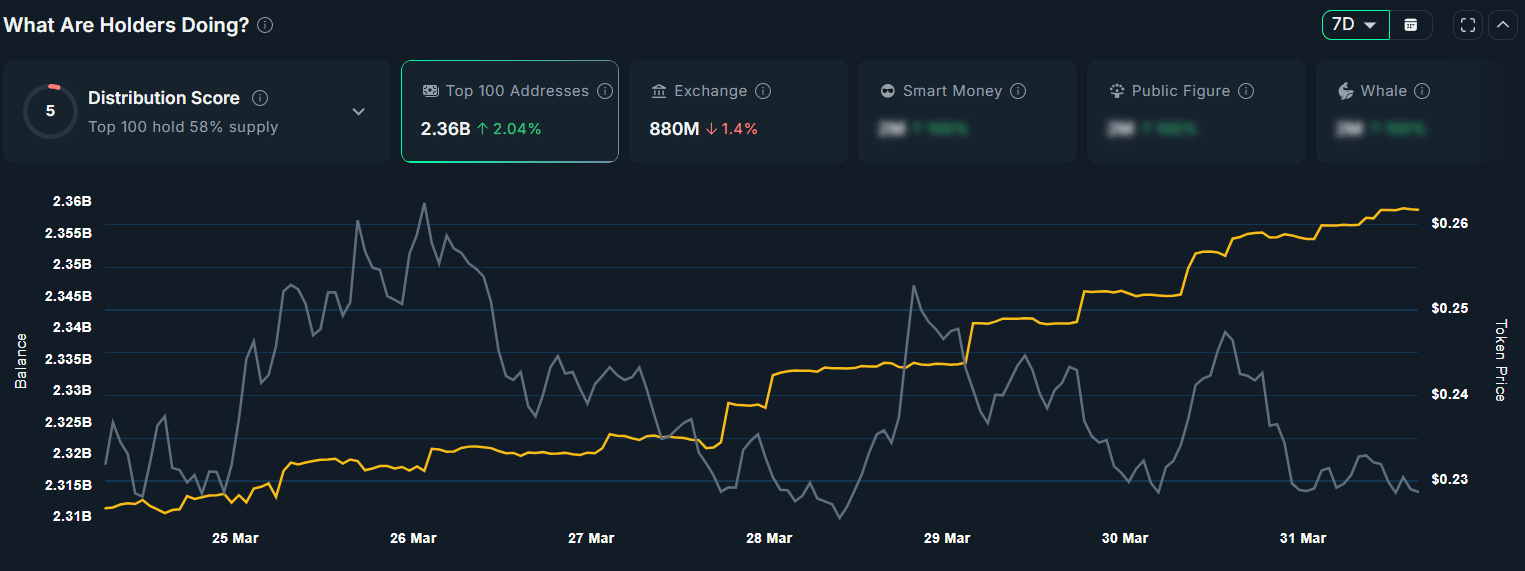
Los datos muestran que las 100 direcciones de billetera principales han aumentado sus tenencias en un 2.04% durante la última semana, señalando una acumulación potencial. Mientras tanto, las Reservas en Exchanges han disminuido un 1.40% durante el mismo período, sugiriendo aún más acumulación por parte de holders a largo plazo.
Fuente: Nansen

Resumen Final

  • FET ha declinado más del 8%, y su acción del precio sugiere una potencial caída del 10% si cae por debajo del nivel de $0.2270.
  • Un experto ha delineado una perspectiva bajista para el activo, apuntando a objetivos a la baja de $0.20 y $0.1737.


Crypto di tendenza

Domande pertinenti

Q¿Qué nivel se considera clave o 'make-or-break' para FET según el artículo?

AEl nivel clave o 'make-or-break' para FET es de $0.2270. Si el precio cierra por debajo de este nivel en un marco de tiempo de cuatro horas, podría desencadenar una caída adicional.

Q¿Cuáles son los objetivos a la baja que un analista ha delineado para FET?

AUn analista ha delineado objetivos a la baja para FET en $0.20 y $0.1737, sugiriendo una posible continuación del movimiento bajista.

Q¿Qué indican los datos de liquidez en los exchanges sobre las posiciones de los traders?

ALos datos de liquidez muestran que los osos dominan a corto plazo, con posiciones cortas apalancadas por valor de $794K, superando a las posiciones largas de aproximadamente $294K, lo que indica expectativas de más caídas.

QA pesar del sentimiento bajista, ¿qué dato sugiere que la perspectiva a largo plazo podría ser alcista?

ALos datos de Nansen muestran que las 100 principales direcciones de billetera han aumentado sus tenencias en un 2.04% en la última semana, y las reservas en exchanges han disminuido un 1.40%, lo que sugiere acumulación y una perspectiva alcista a largo plazo.

Q¿Qué patrón de gráfico sugiere el análisis que ha formado FET y qué implica?

AEl análisis sugiere que FET ha formado un patrón de triángulo descendente en el gráfico de cuatro horas, lo que generalmente es una formación bajista y apunta a una potencial ruptura a la baja.

Letture associate

Low Investment Isn't Apple's Immunity Pass

While Meta and Google face investor scrutiny over ballooning AI capital expenditures, Apple's minimal AI investment has paradoxically become a strength. Its market cap recently reclaimed the global top spot, surpassing $5 trillion. The irony is deep: Apple's own AI efforts have lagged, with "Apple Intelligence" delayed and core talent lost, forcing reliance on partners like Google Gemini and Alibaba's Qianwen. Its Q3 FY2026 (Q2 CY) earnings initially seemed stellar. Revenue hit $109.4B (up 16% YoY), with iPhone and Mac sales, growing 22% and 29% respectively, driving most of the growth. However, the stock fell over 8% post-earnings. The primary concern was a weaker Q4 revenue growth forecast of 9-11%, below expectations, due to looming supply chain constraints. Apple is feeling the indirect cost of the AI boom. Soaring memory and chip prices, fueled by massive data center investments from Microsoft, Amazon, and others, are forcing Apple to raise Mac and iPad prices significantly. The upcoming iPhone launch is also expected to see substantial price hikes. Despite avoiding heavy AI infrastructure spending—its capital expenditures are actually down 28%—Apple cannot escape the industry-wide supply and cost pressures. While Apple's operating cash flow remains robust, its substantial R&D spending (up 32% YoY) has yet to yield major AI breakthroughs. As Tim Cook prepares to step down as CEO, Apple faces a challenging transition: balancing its premium hardware success against the strategic and cost pressures of the AI era it has so far cautiously navigated.

marsbit42 min fa

Low Investment Isn't Apple's Immunity Pass

marsbit42 min fa

PA Graphics Explanation | One Chart to Understand the Major Web3 Events in August 2026

**PANews Crypto Calendar: Key Web3 Events in August 2026** PANews introduces its revamped crypto calendar, featuring comprehensive coverage, flexible filtering, and easy export options. The market in August will be shaped by multiple key events across macroeconomics, regulation, tokenomics, and project developments: * **Macro & Policy:** Key US economic data releases (July Non-Farm Payrolls, CPI), the Federal Reserve meeting minutes, and the Jackson Hole Economic Symposium will be in focus. On the regulatory front, the US Senate plans to release a new draft of the *CLARITY Act*, while the EU's expanded crypto ban against Belarus comes into effect. * **Token Unlocks:** Significant token unlocks are scheduled for assets including ENA, AVAX, CONX, ZRO, and KAITO, which may influence market volatility. * **Project Updates & Shutdowns:** Several services, including Exchange Art, Ctrl Wallet, Zapper, NFTfi, and Summer.fi, are set to cease operations or undergo major adjustments. Users are advised to manage their assets accordingly. * **Corporate Activity:** Q2 earnings reports from companies like SpaceX, Circle, and Nvidia are due. Unitree Robotics will initiate its IPO subscription on the STAR Market, and Moonshot AI plans to begin a Pre-IPO financing round. * **Industry Events:** Major conferences such as Bitcoin Asia 2026 and the 2026 Digital Expo will take place. The overarching market narrative for August will revolve around macroeconomic expectations, regulatory developments, token unlock schedules, and ongoing industry consolidation.

marsbit52 min fa

PA Graphics Explanation | One Chart to Understand the Major Web3 Events in August 2026

marsbit52 min fa

Wall Street's Most Famous 'Cassandra' Now Has His Sights Set on Nvidia

Michael Burry, the famed "Big Short" investor, has once again captured Wall Street's attention with a series of short positions against major tech and semiconductor stocks, most notably Nvidia. In late June and July, through his "Cassandra Unchained" newsletter, Burry disclosed short bets against Nvidia, Tesla, Applied Materials, Caterpillar, the SOXX semiconductor ETF, and later, Micron Technology. His core thesis revolves around potential distortions in the AI infrastructure boom, specifically questioning whether extended depreciation schedules (e.g., 6 years vs. a realistic 2-3 years for AI chips) by cloud giants like Microsoft and Google artificially inflate profits. He also raises concerns about possible "off-balance-sheet circular financing," where chip demand might be propped up by vendor-backed funding to clients. Nvidia's stock experienced volatility following these disclosures, briefly dipping but largely holding near Burry's reported entry points, leaving his positions roughly flat or slightly underwater as of late July. This move is part of a pattern for Burry, whose track record since his legendary 2008 bet is mixed. He has faced notable losses, such as on Tesla in 2021, while scoring on broader market turns like the 2020 pandemic crash. His methodology focuses intensely on free cash flow and scrutinizing original financial documents to spot overvaluation and structural risks, but it often struggles with timing the market. The article contrasts Burry's stance with other prominent investors. Steve Eisman, another "Big Short" figure, is not shorting Nvidia, citing strong fundamentals but expressing nervousness about sustainability. Jim Chanos agrees with the broad "accounting mismatch" concern—comparing it to the dot-com bubble—but targets financial leverage in private equity firms rather than the chip stocks themselves. While Nvidia's short interest remains relatively low at 1.3-1.4% of float, the massive stock size means absolute short losses have been significant, exceeding $5 billion earlier this year. The piece concludes that for ordinary investors, the key takeaway is not replicating specific short bets but learning from the critical frameworks these investors use: questioning rosy accounting, identifying structural vulnerabilities, and maintaining skepticism during market euphoria, even if pinpointing the exact catalyst for a downturn remains elusive.

marsbit1 h fa

Wall Street's Most Famous 'Cassandra' Now Has His Sights Set on Nvidia

marsbit1 h fa

Weekly Selection丨Epic Stock Market Volatility, Changxin Tech's IPO Reshapes Storage Landscape, Saylor Aims to Re-Anchor STRC Around September 8th

PANews Weekly Digest: Market Turmoil, Tech Breakthroughs, and Crypto Developments. The week saw significant volatility across global markets. South Korea's KOSPI index experienced extreme turbulence, including multiple trading halts, largely driven by sharp declines in AI hardware stocks like SK Hynix. In contrast, China's Changxin Xinqiao (CXC) achieved a landmark IPO with a market cap surpassing 4 trillion yuan, marking a major success for the domestic DRAM industry after a decade of losses. In the crypto and Web3 space, several key narratives emerged. AI is driving demand for new infrastructure, with projects like AI agent wallets and programmable payments gaining traction, attracting interest from firms like Coinbase. The Bitcoin mining sector is pivoting, with companies like MARA focusing on energy management as electricity becomes a core AI-era asset. Meanwhile, the RWA (Real World Assets) sector faces a "utilization puzzle," with hundreds of billions in on-chain assets remaining dormant. Notable market movements included a historic single-day surge of over 17% for the KOSPI index and a significant migration of $16.5 billion in staked ETH within the Lido ecosystem. Michael Saylor announced a target to re-peg the STRC stablecoin around September 8th. Other highlights include discussions on Ethereum's ambitious 2030 roadmap for scaling and privacy, analysis showing high protocol revenues not always translating to token price gains, and warnings from Citi about potential extreme commodity price shocks by late 2026.

marsbit1 h fa

Weekly Selection丨Epic Stock Market Volatility, Changxin Tech's IPO Reshapes Storage Landscape, Saylor Aims to Re-Anchor STRC Around September 8th

marsbit1 h fa

When the Market Begins to Question AI Capex: A Full Analysis of Q2 Earnings Reports from Five Tech Giants

In late July 2026, five major US tech giants—Alphabet, Intel, Microsoft, Meta, and Apple—released their Q2 earnings reports. While all companies exceeded revenue and profit expectations, driven by strong AI-related business growth, investor reactions diverged sharply due to concerns over escalating AI capital expenditures (capex) and their impact on free cash flow. Alphabet reported strong revenue growth and a surging cloud business, but its stock fell after announcing a doubled year-on-year capex and negative quarterly free cash flow for the first time. Intel posted its strongest revenue growth in over 15 years, but its stock experienced volatile trading after significantly raising its full-year capex guidance. Microsoft saw its stock surge after beating estimates and, crucially, lowering its capex forecast while projecting positive free cash flow. Meta faced the most severe sell-off as its profits declined despite revenue beats, with free cash flow plunging over 90% and its capex guidance raised. Apple reported record June-quarter results, but its stock plummeted after providing Q4 revenue guidance that fell short of expectations, citing supply chain constraints and forex headwinds. The overall takeaway is that the market's focus has shifted from validating AI demand to scrutinizing the timeline for returns on massive AI investments. Companies demonstrating a clearer path to managing capex and preserving free cash flow, like Microsoft, were rewarded, while those signaling continued aggressive spending faced investor skepticism.

Odaily星球日报1 h fa

When the Market Begins to Question AI Capex: A Full Analysis of Q2 Earnings Reports from Five Tech Giants

Odaily星球日报1 h fa

Trading

Spot

Articoli Popolari

Come comprare FET

Benvenuto in HTX.com! Abbiamo reso l'acquisto di FETCH.ai (FET) semplice e conveniente. Segui la nostra guida passo passo per intraprendere il tuo viaggio nel mondo delle criptovalute.Step 1: Crea il tuo Account HTXUsa la tua email o numero di telefono per registrarti il tuo account gratuito su HTX. Vivi un'esperienza facile e sblocca tutte le funzionalità,Crea il mio accountStep 2: Vai in Acquista crypto e seleziona il tuo metodo di pagamentoCarta di credito/debito: utilizza la tua Visa o Mastercard per acquistare immediatamente FETCH.aiFET.Bilancio: Usa i fondi dal bilancio del tuo account HTX per fare trading senza problemi.Terze parti: abbiamo aggiunto metodi di pagamento molto utilizzati come Google Pay e Apple Pay per maggiore comodità.P2P: Fai trading direttamente con altri utenti HTX.Over-the-Counter (OTC): Offriamo servizi su misura e tassi di cambio competitivi per i trader.Step 3: Conserva FETCH.ai (FET)Dopo aver acquistato FETCH.ai (FET), conserva nel tuo account HTX. In alternativa, puoi inviare tramite trasferimento blockchain o scambiare per altre criptovalute.Step 4: Scambia FETCH.ai (FET)Scambia facilmente FETCH.ai (FET) nel mercato spot di HTX. Accedi al tuo account, seleziona la tua coppia di trading, esegui le tue operazioni e monitora in tempo reale. Offriamo un'esperienza user-friendly sia per chi ha appena iniziato che per i trader più esperti.

123 Totale visualizzazioniPubblicato il 2024.12.11Aggiornato il 2026.06.02

Come comprare FET

Discussioni

Benvenuto nella Community HTX. Qui puoi rimanere informato sugli ultimi sviluppi della piattaforma e accedere ad approfondimenti esperti sul mercato. Le opinioni degli utenti sul prezzo di FET FET sono presentate come di seguito.

活动图片