市场低迷,是否会掩盖 NFT 背后的价值所在?

FootprintPublished on 2022-08-08Last updated on 2022-08-08

Abstract

NFT 市场跟随加密货币市场进入冷静期,仍有部分顶级项目的价格仍然相对稳定

在过去一年里,NFT 经历疯狂 NFT 的牛市之后,许多人一直在等待泡沫的破灭。目前,这些奇怪的图片没能再维持数十万美元的高价了。市场快速降温,NFT 的辉煌时代是时候结束了。

真的是这样吗?

当前加密货币的宏观形势严峻 —— 整个行业链条崩溃,大批资本在向外逃亡,行业头部 CEX 正在申请破产……但数据证明,NFT 相对于行业其他领域,是更加坚挺的。

数据显示:

• DeFi TVL 下跌 68%

• GameFi 的交易量下跌 62%

• NFT 的交易量下跌 41%

• NFT 的融资额也跌幅 57%

然而,纵观整个市场,数据只是其中一角。

本报告将对 2022 年 Q2 的 NFT 行业整体数据进行总结和分析,包括 NFT 市场的整体情况、NFT 投融资以及链上数据表现的细分分析。还将跟踪明星项目 BAYC、CryptoPunk 和 Goblintown 的关键数据。

Q2 NFT 市场整体概览

Q2 的 NFT 交易量处于下行区间,下跌 41%

年初,加密资产价格受到政策影响而下跌,投资资金正流向 NFT 市场,作为收藏品、游戏道具和艺术载体。这推动了 NFT 市场交易的空前活跃,创下 86 亿美元的交易量新高。

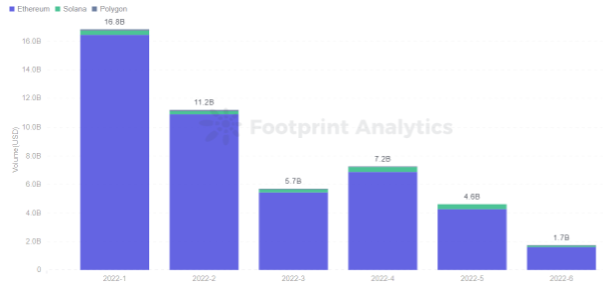
许多人认为这可能会增加 NFT 的热度,为 Q2 做更多铺垫。然而,在 5 月中旬,加密市场面临着相当大的挑战,NFT 市场随之进入冷静期。NFT 的交易额高开低走,从 Q1 的 190.2 亿美元跌至 Q2 的 112.6 亿美元,跌幅 41%。

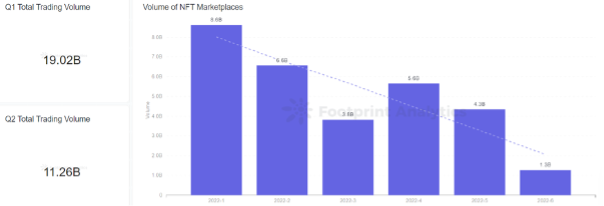
Footprint Analytics - Volume of NFT Marketplaces

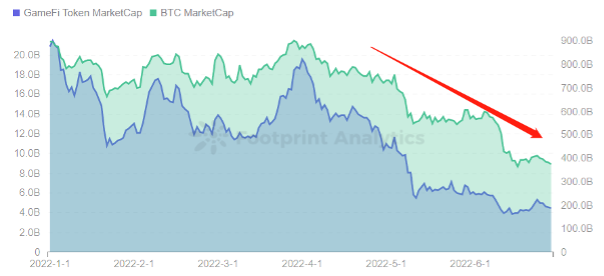
但在市值方面,GameFi Token 与 BTC 市值变化呈正相关,GameFi Token 的市值 Q1 到 Q2 下跌了 76%。而 NFT 市场的情绪反应比其他领域更 “迟钝”。NFT 市场往往不会快速响应,Q1 到 Q2,其市值跌幅仅为 39%。

Footprint Analytics - GameFi Token MC vs BTC MC

与 Q1 相比,Q2 NFT 融资额下降 57%

Q2 NFT 融资额占 Q2 市场总融资额的 8%,Q2 NFT 投资额为 11.68 亿美元。与 Q1 相比,下降 57%。就融资类别而言,Gaming 类项目的融资金额中处于前列,其次是 Marketplace 类。

从 Q1 到 Q2 最大的变化是 Metaverse 类 NFT。过去半年近乎疯狂的 Metaverse 投资热潮,似乎从 3 月份开始降温。可以从 The Sandbox 的项目数据表现看出,构建一个虚拟世界谈何容易。因此,目前许多的 Metaverse 相关项目仍停留在炒作概念的阶段。

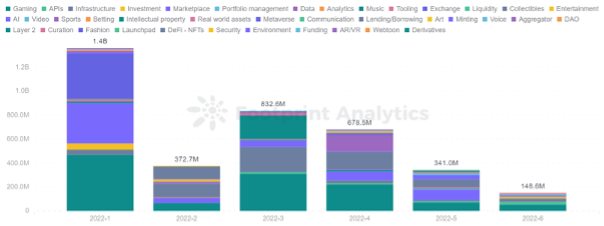
Footprint Analytics - NFTs Investment Funding Category Distribution

从融资轮次来看,种子轮数量最多,其他轮次融资比例均在 10% 以下。但从各链的独立 NFT 融资项目来看,Solana 生态 NFT 市场 Magic Eden 表现尤为突出。6 月下旬,它完成了 1.3 亿美元的 B 轮融资,为 NFT 融资在熊市创造一个罕见的突破。

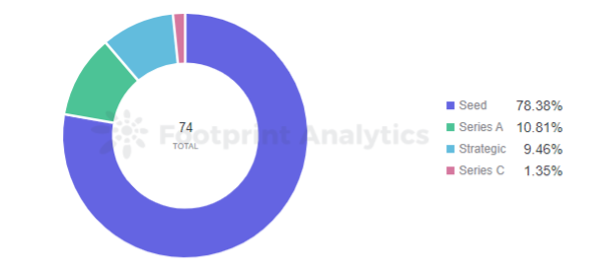
Footprint Analytics - NFTs - Funding Rounds in Q2

NFT 在 Ethereum、Polygon 和 Solana 上的数据表现

据 Footprint Analytics 显示,以太坊生态的 NFT 总交易量在众多公链占 80% 以上。而且以太坊是拥有最多的 NFT 项目,头部项目聚集效应明显,包括有 BAYC、Otherdeed 和 CryptoPunks 等项目。

链上 NFT 交易量对比

从 Ethereum、Polygon 和 Solana 上 NFT 交易量来看,Q2 比 Q1 的 NFT 交易量下降 60%。以太坊仍是 NFT 最繁荣且交易量最大的链上生态系统,但高额的 Gas 费和拥堵问题依旧是以太坊的短板。

于是,Solana 和 Polygon 在 NFT 行业上也不甘落后。尤其是在 OpenSea 引入 Solana 链上的项目后,Solana 的交易量 Q2 比 Q1 增长 12%。这将成为挑战以太坊 NFT 皇冠的最新竞争者。

Footprint Analytics - Monthly NFT Volume by Chain

交易平台的 NFT 交易量对比

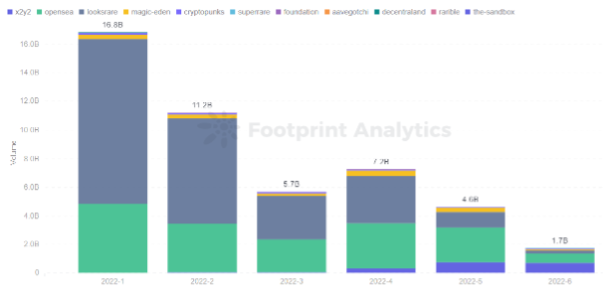
进入第二季度后,尤其是在 6 月 NFT 交易的市场不再是 OpenSea 一家独大了。

X2Y2 已经开始动摇 OpenSea 的霸主地位。它和 LooksRare 一样,都是早期开始挑战 OpenSea 的新兴 NFT 交易平台,它们直奔 OpenSea 中心化、平台收益与用户无关、高手续费和未发行 token 等痛点,逐渐瓜分 OpenSea 在 NFT 的交易市场地位。

还有 Magic Eden 交易平台也逐渐显露,为 Solana NFT 打开了闸⻔,丰富 NFT 多链的交易市场。

Footprint Analytics - Monthly Market Ranked by Volume

NFT 交易市场的活跃用户

从交易平台的图表显示,OpenSea 的竞争对手 LooksRare 推出的激励机制,促使它获得了一些市场份额,但这一举措并没有为其带来可观的用户量。大部分 NFT 用户仍活跃在 OpenSea 上,Q2 期间日均活跃用户超过 50,000+。

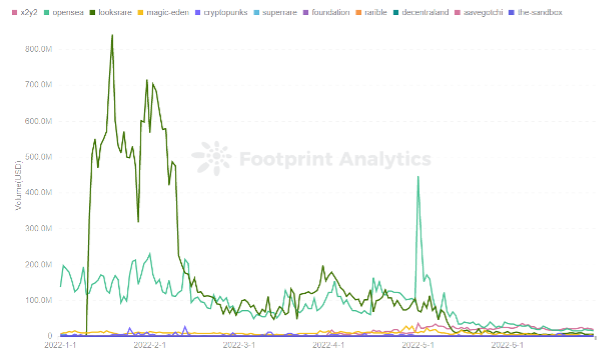
Footprint Analytics - Daily Market Ranked by Volume(USD)

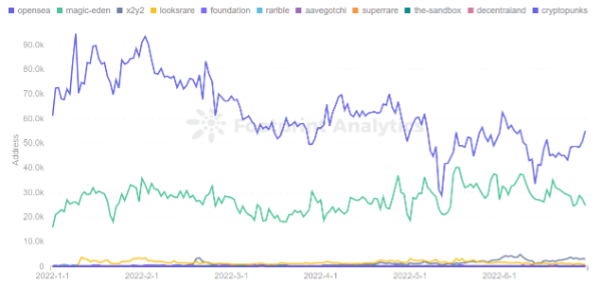
Footprint Analytics - Marketplace Daily Active User

NFT 买家与卖家相关数据情况

如果卖家比买家多,这表明人们正在抛售他们的资产。 如果买家多于卖家,那么想要进入 NFT 生态的新人也会比想要卖出资产的人多。

因此,数据显示,熊市受挫后,第二季度的 NFT 新用户比 Q1 的有所减少。

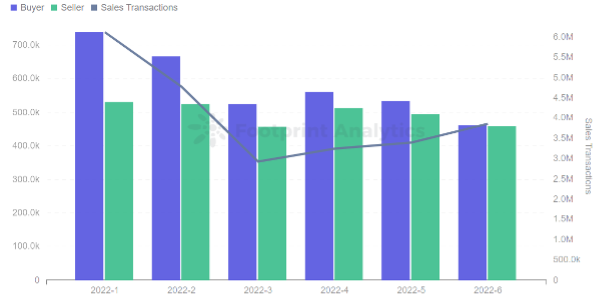
Footprint Analytics - Buyers & Sellers

本季值得关注的 NFT 项目

BAYC 的交易量和 Floor Price 多次反超 CryptoPunks

自从 BAYC 崛起以来,它和 CryptoPunks 之间的竞争就一直在酝酿之中。

多年来,Punks 因其悠久的历史和专注的社区而被称为卓越的 「蓝筹股」 NFT 资产。然而,由于 BAYC 开发团队 Yuga Labs 在 Q1 中收购 CryptoPunks 和 Meebits 的知识产权,以及启动 Otherside 虚拟地块 Otherdeed 销售活动。推动 BAYC 系列的 NFT 交易量和 Floor Price 再次出现大幅增长,屡次击败 CryptoPunks。

随着 Crypto 市场的崩盘,导致投资者对 NFT 的需求也出现了相应幅度衰退,极大地影响其整体交易量和售价下跌。从图表中可以看出,5 月中旬之后,Bored Ape Yacht Club 和 Cryptopunks 的交易量和 Floor Price 都在下滑。

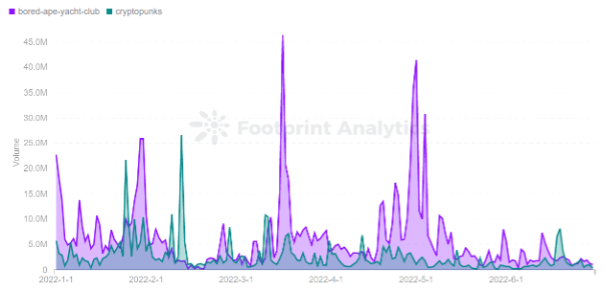
Footprint Analytics - Bored Ape Yacht Club vs Cryptopunks Volume

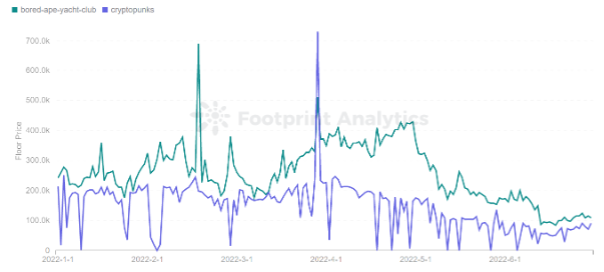
Footprint Analytics - Bored Ape Yacht Club vs Cryptopunks Floor Price

异军突起的项目——Goblintown

市场的低迷并没有阻止新的 NFT 项目的出现。

Goblintown 是由一群相貌丑陋、造型荒诞的 Goblins 头像构成,成为第二季度异军突起的 NFT 项目。5 月 21 日开始初步铸造,9999 个尖耳妖精头像免费分发给 NFT 玩家,用户仅需支付链上 Gas 费,该项目迅速引起了市场的兴趣。在 6 月 1 日,日交易量高达 1,100 万美元,市值高达为 1.27 亿美元。

与 BAYC 相比,Goblintown 通过差异化和二次解读带来的叛逆感,也带着些许艺术性。但从市值和交易量来评估,NFT 之王无疑是还是 BAYC。

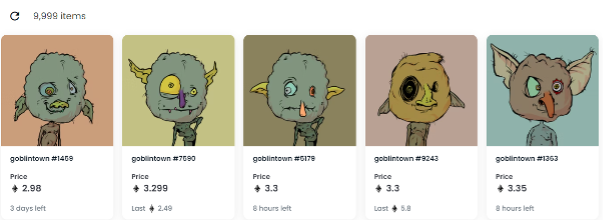
Screenshot source - goblintownwtf collection

结论

NFT 市场跟随加密货币市场进入冷静期,仍有部分顶级项目的价格仍然相对稳定,而且第二季度仍有新项目涌现。换句话说,当前的下行压力已经拖垮了整个产业链、几家风险投资公司以及几家 CEX,但并没有造成 NFT 市场的内爆。

这意味着,尽管 NFT 的价格依然呈下行趋势,但大众预料中的 NFT 泡沫出现几率甚微。即使泡沫出现,NFT 也会是所有加密领域泡沫中最小的那个。

Related Reads

Hackers Steal Nearly $17 Million in 40 Days as 'Zombie Contracts' Become Their ATMs

According to an analysis published by ZeroDrift on June 22, 2026, attackers have stolen approximately $16.9 million over 40 days from five deprecated but still operational smart contracts across various blockchains. The primary issue is not a specific vulnerability but the incomplete decommissioning of legacy contracts. These "zombie contracts" often retain economic value, operational permissions, and callable functions, making them prime targets long after teams cease active development. The most significant loss occurred at DxSale, where an old locker contract lost about $7.3 million due to a forgotten control path becoming accessible again. Other affected projects include TrustedVolumes (~$5.87M), Raydium's legacy AMM pool (~$1.34M), Aztec Connect (~$2.28M), and Huma Finance V1 pool (~$101k). These incidents involved diverse systems—RFQ settlement, credit pools, liquidity lockers, AMMs—demonstrating the widespread nature of the risk. The analysis highlights that automated tools are lowering the cost for attackers to systematically scan for these long-tail targets, which have public code and weaker monitoring. In contrast, defensive practices for contract retirement remain underdeveloped. While the DeFi industry has mature audit processes for new deployments, it lacks strict protocols for securely sunsetting old contracts, which only become truly "retired" after all funds, permissions, authorizations, and trust assumptions are removed.

marsbit9m ago

Hackers Steal Nearly $17 Million in 40 Days as 'Zombie Contracts' Become Their ATMs

marsbit9m ago

Valuation Rout of Old Titans: The Demise of a Generation's Asset Valuation Framework

"The Old Titans' Valuation Collapse: The Death of an Era's Valuation Framework" Between Alibaba's 2014 NYSE debut at $93.89 and its 2026 price of ~$95, twelve years have passed with zero price appreciation. This stagnation symbolizes a wholesale valuation reset for an entire generation of Chinese internet assets. Companies like Tencent, Pinduoduo, Meituan, Bilibili, and Kuaishou have seen catastrophic declines of 80-98% from their peaks. The core question arises: what framework now prices these companies, or has the framework itself expired? The valuation logic for Chinese internet stocks followed a clear "anchor-setting and anchor-removing" process. From 2014-2017, the dominant narrative was "US comparable discounting" – applying a growth premium and governance discount to US peers' multiples. This anchor loosened with the 2018 US-China trade war and the VIE structure risk, then was violently uprooted by the 2020-2021 regulatory crackdowns (Ant Group, Didi, anti-monopoly fines). The 2022 delisting panic and subsequent 2025-2026 geopolitical shocks (US military lists, AI espionage accusations) completed the demolition. The old "US对标打折" model is dead. However, this is not solely a China story. A structural mirror exists in US "old titan" stocks ("老登股"). In 2026, even Microsoft – with robust fundamentals – saw its PE compress from a 34x median to 22x, its worst performer status among the "Magnificent Seven" driven by a $190 billion annual AI capex crushing free cash flow. The core dilemma is universal: legacy platform giants, whether Alibaba or Microsoft, are spending colossal sums to chase an AI paradigm that may颠覆 their own high-margin, user/subscription-based business models. They have shifted from "companies defining the future" to "companies needing to prove they won't be淘汰ed by the future." This phenomenon of a dying valuation坐标系 has a historical precedent: post-1989 Japan. After its bubble burst, the "Japan premium" narrative ("most efficient manufacturing + perpetual growth") collapsed. A 25-year valuation vacuum ensued until Warren Buffett provided a new language in the 2010s: "low valuation + high dividend + governance reform." China's internet sector is now in a similar vacuum six years into its reset. While different from Japan's deflationary context, the parallel is clear: the old macro assumption of "deep integration with global capital" is falsified, but a new pricing framework is absent. Potential "new languages" for Chinese internet valuations are contradictory. AI transformation requires gutting profitable core businesses (e.g., Alibaba's ad-driven e-commerce) for an unproven consumption-based model, risking a Microsoft-like cash flow crunch. Alternatively, shareholder returns (buybacks/dividends) could build a floor, following Buffett's Japanese playbook, but current scales are insufficient to form a standalone anchor. The current state mirrors mid-1990s Japan: the old framework is dead, the new one unborn. The market waits in a vacuum for a重新定义ing force – a person, event, or proven business model shift – to answer "why buy." This may only be the middle phase of a prolonged re-rating.

marsbit17m ago

Valuation Rout of Old Titans: The Demise of a Generation's Asset Valuation Framework

marsbit17m ago

STRC Trading at Significant Discount, mNAV Falls Below Break-Even, Strategy's Valuation Logic Has Been Rewritten

Title: STRC Deeply Discounted, mNAV Falls Below Break-even, Strategy's Valuation Logic Redefined The recent volatility in MSTR and STRC highlights the need to reassess the core business model of Bitcoin reserve companies. These entities function more like leveraged, single-asset banks rather than software/tech firms. Consequently, they should be valued using banking metrics, not based on their total Bitcoin holdings. The key valuation metric is mNAV (market net asset value), akin to a price-to-book ratio. It compares the company's market capitalization to the equity value of its Bitcoin holdings after deducting all senior debt and preferred equity (like STRC). As of June 24, Strategy's mNAV was 1.10x. The focus should be on "net Bitcoin per share" (the Bitcoin claim per share after senior claims) and its growth rate, equivalent to a bank's book value and return on assets. Given STRC's 19% discount to its $100 par value (yielding 14.2%), issuing new MSTR equity at the current price to buy more Bitcoin is inefficient. It slightly dilutes the widely watched "total Bitcoin per share" metric while providing minimal improvement to the more critical "net Bitcoin per share." The article analyzes four potential uses for $1 billion in new equity: 1. **Buy Bitcoin:** Least effective. Improves net Bitcoin per share only marginally while diluting total Bitcoin per share. 2. **Repurchase STRC:** Most effective for balance sheet repair. The discount creates immediate value, increasing net Bitcoin per share by 1.0%, reducing debt burden, and lowering future dividend obligations. 3. **Boost Cash Reserves:** Dramatically improves the "cash coverage ratio" for STRC dividends from 9.8 months to 16.8 months, a crucial liquidity metric in a tightening funding environment. 4. **50/50 Split (STRC buyback & cash):** A balanced approach improving all key metrics. Strategy's own Q1 report indicates its internal break-even mNAV for profitable equity issuance to buy Bitcoin is 1.22x. With the current mNAV at 1.10x, such a move would be value-destructive. The core assumptions of its previous expansion model—issuing STRC at par and maintaining ample dividend coverage—have broken down. The recommended path is to use new capital to optimize core financial health: repurchasing discounted STRC and/or bolstering cash reserves. This would repair the balance sheet, signal liquidity strength, support STRC's price, lower its yield, and potentially reopen the par-value issuance channel. The current STRC discount represents a low-cost capital opportunity to restart this positive cycle. Bitcoin reserve companies must be evaluated as banks, focusing on book value, leverage, and liquidity resilience.

Foresight News18m ago

STRC Trading at Significant Discount, mNAV Falls Below Break-Even, Strategy's Valuation Logic Has Been Rewritten

Foresight News18m ago

Trading

Spot
活动图片