Bitcoin HODLer Selling Cooling Off As ETF Inflows Return: Glassnode

bitcoinistPubblicato 2025-10-03Pubblicato ultima volta 2025-10-03

Introduzione

On-chain analytics firm Glassnode has revealed in a report that Bitcoin long-term holder have slowed down distribution after months of...

Trusted Editorial content, reviewed by leading industry experts and seasoned editors. Ad Disclosure

On-chain analytics firm Glassnode has revealed in a report that Bitcoin long-term holder have slowed down distribution after months of selling.

Bitcoin Long-Term Holder Net Position Change Is Now Neutral

In its latest weekly report, Glassnode has talked about how the behavior of the Bitcoin long-term holders has changed recently. The “long-term holders” (LTHs) refer to the BTC investors who have been holding onto their coins since more than 155 days ago.

Statistically, the longer a holder keeps their coins dormant on the blockchain, the less likely they become to sell them at any point. As such, the LTHs with their relatively long holding time are considered to be the diamond hands of the network.

This can make the behavior of this cohort worth keeping an eye on, as shifts in it can have consequences for the cryptocurrency as a whole, considering their standing.

There are many ways to keep track of LTH behavior, with one method being through the Net Position Change metric. This indicator measures, as its name implies, the monthly net change in the Bitcoin supply held by the LTHs as a whole.

Below is the chart for the metric shared by Glassnode that shows the trend in its value over the past year.

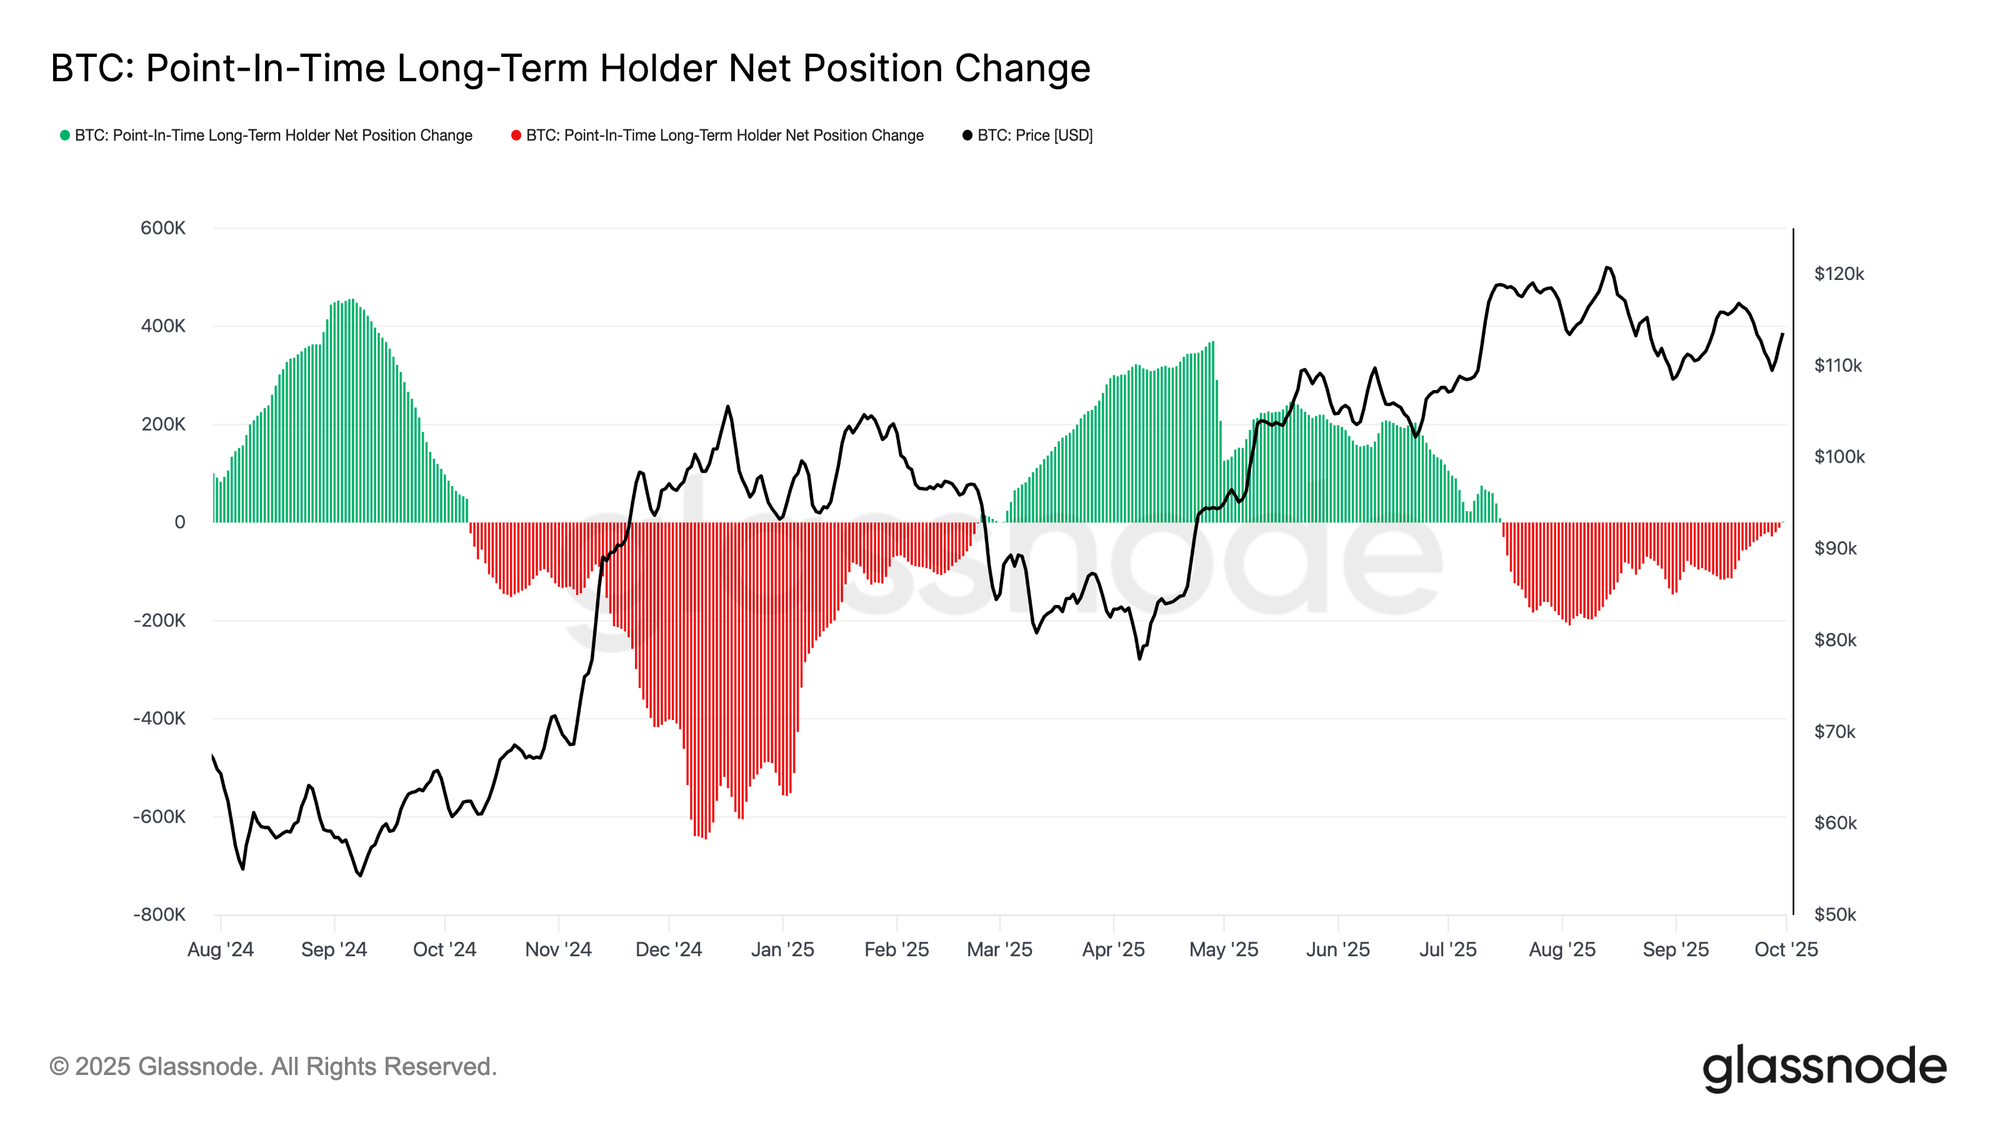
Looks like the value of the metric has been negative in recent months | Source: Glassnode's The Week Onchain - Week 39, 2025

From the graph, it’s visible that the Bitcoin LTH Net Position Change was positive during the first half of 2025, but a shift occurred in July as the indicator flipped into the negative. This implies supply started exiting the cohort.

Something to keep in mind is that while selling from the group can instantly register on the chart, the same isn’t true for buying. When LTH supply rises, it doesn’t mean accumulation is happening in the present, but rather that some buying occurred 155 days ago and those coins have now been held for long enough to become a part of the group.

The LTH distribution continued through August and September, but with the start of October, the Net Position Change has returned back to a neutral value, indicating coins being sold by the group are now being balanced out by tokens maturing past the 155-day cutoff. In other words, their net profit-taking has calmed down.

As the report explains:

This cooling supply pressure suggests that the recent phase of long-term holder profit-taking may be easing, potentially leaving ETFs and new inflows as more decisive drivers of market direction.

The spot exchange-traded funds (ETFs) have also seen a shift recently, as another chart cited by Glassnode shows.

Bitcoin Spot ETF Neflows

How the netflow related to the US BTC spot ETFs has changed over the last twelve months | Source: Glassnode's The Week Onchain - Week 39, 2025

As displayed in the graph, the US Bitcoin spot ETFs switched to outflows in late September, but the netflow has once again turned green for these investment vehicles. The analytics firm notes:

Should this renewed demand align with reduced LTH selling, ETFs could provide a stabilizing force, offering a more constructive foundation for price resilience and supporting the conditions needed for a sustainable advance.

BTC Price

At the time of writing, Bitcoin is floating around $119,700, up almost 8% over the last seven days.

Bitcoin Price Chart

The trend in the price of the coin over the last five days | Source: BTCUSDT on TradingView
Featured image from Dall-E, Glassnode.com, chart from TradingView.com
Editorial Process for bitcoinist is centered on delivering thoroughly researched, accurate, and unbiased content. We uphold strict sourcing standards, and each page undergoes diligent review by our team of top technology experts and seasoned editors. This process ensures the integrity, relevance, and value of our content for our readers.

Keshav is a Physics graduate who has been employed as a writer with Bitcoinist since June 2021. He is passionate about writing and through the years, he has gained experience working in a variety of niches. Keshav holds an active interest in the cryptocurrency market, with on-chain analysis being an area he particularly likes to research and write about.

Letture associate

Bitcoin's 'Rally Ends,' Officially Entering the Later Stage of a Bear Market?

Bitcoin prices declined 13% this week, reversing the recent rebound and signaling a likely transition into the later stages of a bear market. Key on-chain metrics deteriorated, with the short-term holder cost basis falling below the Realized Price—a pattern last seen in early 2022, characteristic of bear market maturity. The rally to ~$82k proved to be a bear market bounce, as evidenced by the 90-day realized profit/loss ratio failing to sustain above the bullish threshold of 2. Daily realized losses surged to $1.35B, including significant selling from long-term holders who accumulated near cycle tops, indicating ongoing supply redistribution. Price was rejected almost precisely at the aggregate US spot ETF cost basis of ~$83k, turning that level into resistance and leaving the average ETF investor underwater again. Spot market selling pressure intensified, with the 7-day volume delta turning significantly negative to its weakest level since February. While a major long liquidation event cleared over $400M in leverage, spot demand has not yet stepped in to absorb the resulting supply. Options markets continue pricing in higher future volatility (elevated volatility risk premium) and maintain a skew toward put options, reflecting persistent demand for downside protection, though not yet panic. Overall, market structure remains fragile. Sustained recovery likely requires a reclaim of the ETF cost basis, a shift back to positive spot demand, and a slowdown in realized loss-taking. Until then, the market risks further downside or extended consolidation within the broader bear trend.

Foresight News55 min fa

Bitcoin's 'Rally Ends,' Officially Entering the Later Stage of a Bear Market?

Foresight News55 min fa

How Risky is the "Death Spiral" of MSTR and STRC?

Summary: This article explores the perceived "death spiral" risk between MicroStrategy (MSTR), its Bitcoin holdings, and its perpetual preferred stock (STRC), drawing comparisons to the LUNA-UST collapse. While both systems feature price anchors, high yields for holders, and potential feedback loops, their core mechanisms differ fundamentally. The MSTR-STRC structure relies on continuous financing to sustain its high dividend payouts, primarily through stock ATM offerings. A negative feedback cycle could occur: falling MSTR stock price makes raising equity capital harder, increasing pressure to sell Bitcoin, which undermines STRC confidence and further depresses MSTR. However, unlike LUNA-UST's automated, direct linkage, the MSTR-STRC loop is weaker and has brakes: STRC dividends can be deferred or rates lowered, and STRC holders have a $100/share liquidation preference in bankruptcy, providing a price floor. The company's sustainability hinges on its ability to continue financing. Its current ~$900 million USD reserves cover only about 6.3 months of its ~$1.71 billion annual interest/dividend burden. The next six months are critical, aligning with both the potential bottom in Bitcoin's four-year cycle and the depletion timeline of its reserves. While a LUNA-style catastrophic collapse is deemed highly unlikely due to structural differences, the key question is whether MicroStrategy can navigate this period through healthy deleveraging to restart its capital engine.

Foresight News1 h fa

How Risky is the "Death Spiral" of MSTR and STRC?

Foresight News1 h fa

Trading

Spot
Futures
活动图片