- Ethereum is holding at $4.1K, with the daily trading volume increasing by over 44%.
- ETH might face crucial resistance in the range of $4,210 to $4,300.
The global crypto market opened the new trading day with a modest recovery, with the overall neutral sentiment lingering in the market. Also, the digital assets are oscillating dramatically between green and red zones. As of today, it brought some green, with the market cap registering a brief 1.56% spike, reaching $3.92 trillion.
Meanwhile, the assets, like Bitcoin (BTC) and Solana (SOL), are among the trending tokens, with moderate gains in value. Among the pack of altcoins, the largest one, Ethereum (ETH), posted a 1.72% uptick in the last 24 hours. This price action has triggered ETH to move from a low of $4,087 to a high of $4,238.
The recovery attempt now sees Ethereum trading at around the $4,191 mark, with its market cap reaching $505.73 billion. Besides, the daily trading volume has surged by over 44.51%, settling at $38.58 billion. As reported by the Coinglass data, the market has experienced a liquidation of $72.03 million of ETH during this interval.
Significantly, the whale 0x69e4 had a short position on Ethereum, betting the price would fall. As the market rebounded instead, the price moved against the direction, forcing the closure of the position. This resulted in a loss of over $1.58 million.
Evaluating Technical Indicators for Short-Term Ethereum Price Action
On the recent 4-hour price chart, the ETH/USDT trading pair shows a bullish sign, a short-term reversal from the downtrend. After the formation of red candles, the green candlesticks have taken their place. Notably, the buyers defended the $4,137 support zone strongly, which led to today’s brief spike. Unless the asset breaks above $4,210 and then $4.3K, the fall could continue.
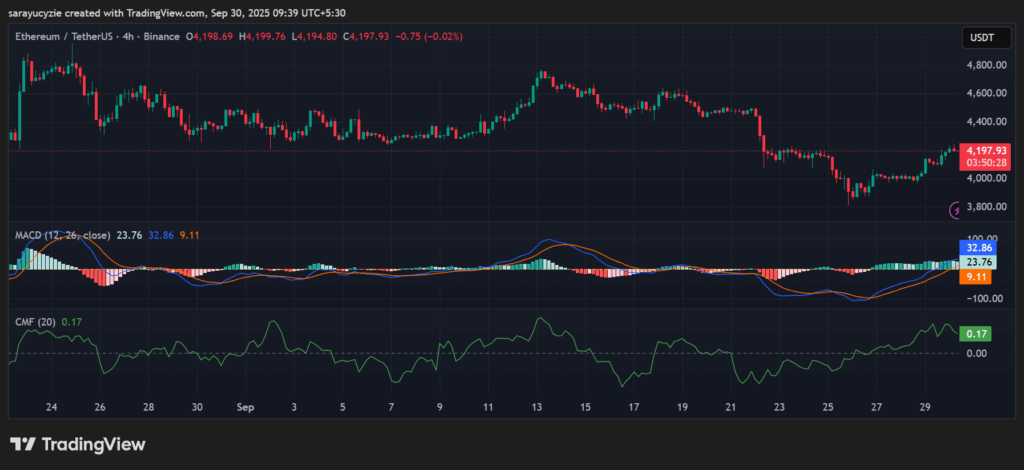
ETH chart (Source: TradingView)
Additionally, both the MACD line and the signal line have crossed above the zero line. This crossover is considered positive. The momentum has shifted toward buyers, with the market gaining upward strength. Ethereum’s CMF indicator value of 0.17 implies moderately strong buying pressure. The money flow is positive in the market.
ETH chart (Source: TradingView)
ETH’s RSI is positioned at 63.46, which suggests a moderately bullish zone. The market is gaining strength, but has not yet entered the overbought territory. There is more room to run upward. Moreover, the asset’s BBP reading staying at 128.42 indicates that bulls are currently dominating the market. It hints at an upward pressure and potential continuation of the uptrend.
In conclusion, the Ethereum price has shown signs of a short-term bounce after the bearish domination. But it is not strong enough to shift the current uptrend to a rally. For a full forecast of Ethereum’s potential, read our comprehensive ETH Price Prediction, which covers 2025 through 2030.


