XRP’s Market Cap Beats Out Heavy Hitters In Climb Into 100 Top Global Assets — Here Are The Numbers

bitcoinistPublished on 2025-09-15Last updated on 2025-09-15

Abstract

XRP has climbed back into the top 100 global assets by market cap, surpassing some notable names, following its reclaim...

Trusted Editorial content, reviewed by leading industry experts and seasoned editors. Ad Disclosure

XRP has climbed back into the top 100 global assets by market cap, surpassing some notable names, following its reclaim of the psychological $3 level. This comes amid a broader crypto market rally, which has sparked hopes of a continuation of the bull run.

XRP’s Market Cap Surpasses Major Companies

Companies Market Cap data shows that XRP’s market cap is larger than that of the world’s largest asset manager, BlackRock, and also Sony. The altcoin’s market cap is currently at around $182 billion, while BlackRock and Sony boast a market cap of $173 and $174 billion, respectively. 

Meanwhile, based on its market cap, XRP currently sits as the 88th largest asset, just behind Xiaomi. It is worth noting that the altcoin has briefly surpassed banking giant Citigroup, Verizon, and Shopify following a rally of over 3% over the weekend. However, XRP has pared some of these gains and now looks to be consolidating in preparation for the next leg to the upside. 

XRP’s rally comes amid a broad crypto market rally, with other major altcoins like Ethereum, Dogecoin, BNB, and Solana recording significant gains. Some fundamentals could serve as a catalyst for higher XRP prices, as its market cap looks to surpass more companies on the global assets ranking. 

This includes the launch of the REX-Osprey XRP ETF that is set to take place this week. This will be the first U.S. XRP fund to provide institutional investors with spot exposure to the altcoin. This is expected to inject new liquidity into the XRP ecosystem. Meanwhile, the Fed is expected to make a rate cut at this week’s FOMC meeting. This is typically bullish for altcoins for XRP, although there is also the possibility that it may be a ‘sell the news’ event. 

XRP Eyes Rally To $3.6

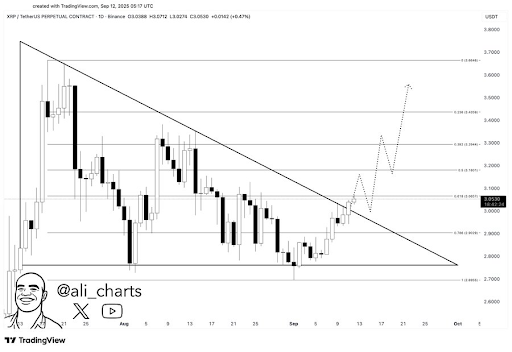
Crypto analyst Ali Martinez has predicted that the XRP price could rally to $3.6 following its breakout above $3.05. He had earlier stated that there were two possible scenarios. One possibility is that it could break above $3.05 and then rally to $3.60, or it could dip to $2.80, break above $2.90, and then rally to $3.60. 

XRP
Source: Chart from Ali Martinez on X

Meanwhile, crypto analyst Dark Defender highlighted $3.01 and $2.85 as the major support levels to watch out for as the XRP price prepares for another leg to the upside. The analyst stated that the targets are the $4.39 and the $5.85 Fibonacci levels. A rally to these price levels would mark a new all-time high (ATH) for the altcoin.

Related Reading: If You Hold XRP, Analyst Says To Strap In; Here’s Why

At the time of writing, the XRP price is trading at around $3.04, down in the last 24 hours, according to data from CoinMarketCap.

XRP
XRP trading at $2.96 on the 1D chart | Source: XRPUSDT on Tradingview.com
Featured image from Adobe Stock, chart from Tradingview.com
Editorial Process for bitcoinist is centered on delivering thoroughly researched, accurate, and unbiased content. We uphold strict sourcing standards, and each page undergoes diligent review by our team of top technology experts and seasoned editors. This process ensures the integrity, relevance, and value of our content for our readers.

Scott Matherson is a leading crypto writer at Bitcoinist, who possesses a sharp analytical mind and a deep understanding of the digital currency landscape. Scott has earned a reputation for delivering thought-provoking and well-researched articles that resonate with both newcomers and seasoned crypto enthusiasts. Outside of his writing, Scott is passionate about promoting crypto literacy and often works to educate the public on the potential of blockchain.

Trending Cryptos

Related Reads

Bitcoin at 59,000 Is Not the Bottom, One Last Drop Needed! Chain Data and Liquidity Analysis: Where is BTC's True Bottom?

Based on analysis by trader Mr. Beggar, Bitcoin's (BTC) recent low of $59k is likely not the final cycle bottom. He argues that while a bottom is near, a final downward movement is still probable to target liquidity below that level, making a deeper low healthier for a sustainable reversal. Mr. Beggar's framework combines on-chain data for long-term cycles and liquidity-based technical analysis for shorter-term trades. His "four deep bear buying models" include Cointime Price (market cost weighted by coin holding time) and AVIV (an enhanced MVRV indicator), which currently suggest prices are nearing cyclical bottom zones. While a PSIP (Percent Supply in Profit) signal has flashed below 50%, it alone is not considered definitive; typically, the first signal is not the final bottom. He presents three potential scenarios for the current market: 1) a direct drop from here, 2) an upward liquidity sweep (stop hunt) of the recent high near $67.3k before declining, and 3) a direct reversal without new lows. He heavily discounts the third scenario due to significant un-swept liquidity in the $59k-$62.3k range, suggesting the market must revisit these levels. Mr. Beggar shares that he used on-chain signals to identify potential cycle tops in late 2024/early 2025 and later established low-leverage BTC-denominated short positions. He emphasizes the importance of risk management and staying within one's expertise ("strike zone"), warning against investing in assets like AI/semiconductor stocks simply because they are rising.

marsbit25m ago

Bitcoin at 59,000 Is Not the Bottom, One Last Drop Needed! Chain Data and Liquidity Analysis: Where is BTC's True Bottom?

marsbit25m ago

From Signal Monitoring to Strategy Copy Trading: How PPP Lowers the Barrier to Trading on Polymarket?

From Signal Monitoring to Strategy Copy Trading: How PPP Lowers the Barrier to Polymarket Trading The surge in trading demand on prediction markets like Polymarket, especially during events like the World Cup, exposes a common challenge for novice users: emotional and impulsive trading due to a lack of stable strategies and reliable signals. Prediction Position Platform (PPP) addresses this by serving as a Telegram-based tool for strategy discovery and automated copy-trading on Polymarket. PPP offers a suite of features through a subscription model. Key functionalities include 24/7 market signal monitoring (tracking smart money movements and rapid probability shifts), an "AI Address Analysis" tool to evaluate trader performance metrics, and specialized sections like a "World Cup Zone" for quick access to related markets. Its core value lies in two curated lists: the "Strategy Square," which identifies addresses suitable for long-term tracking based on comprehensive metrics like returns, win rate, and drawdowns, and the "Trading Leaderboard," highlighting recently outperforming addresses for short-term opportunities. Users can manually analyze any address or set up automated copy-trading with customizable parameters like investment amount and stop-loss. After initiating copy-trades, users can manage all positions from a unified dashboard, adjusting parameters or stopping follows as needed, and review historical performance data. Crucially, PPP employs a non-custodial wallet model, meaning user funds remain in their own self-custodied wallets, enhancing security and trust. In summary, PPP aims to reduce the learning curve and trial-and-error cost for Polymarket users by aggregating signals, curating and analyzing profitable traders, and facilitating automated, yet manageable, copy-trading execution.

Odaily星球日报26m ago

From Signal Monitoring to Strategy Copy Trading: How PPP Lowers the Barrier to Trading on Polymarket?

Odaily星球日报26m ago

From the White-Haired Stock God to the Billion-Dollar Fund Titan: The Smart People Shorting NVIDIA Are Getting Rich Using the Same Framework

From "white-haired stock god" to billionaire fund manager, those profiting from shorting NVIDIA share a common framework. The article analyzes the critical bottlenecks in the AI hardware supply chain, which have become key investment focal points. The core argument is that the real constraint on the AI boom isn't software or algorithms, but fundamental physical infrastructure. The piece dissects nine major bottlenecks, organized around the lifecycle of an AI accelerator circuit board. *Before the Board*: The pre-manufacturing stage faces constraints in EDA tools, new materials (like GaN, SiC, InP) replacing silicon, and the critical, non-renewable supply of helium for semiconductor fabrication. *On the Board*: The primary bottlenecks are High-Bandwidth Memory (HBM), essential for unleashing GPU power, and advanced packaging (e.g., CoWoS), required to integrate components. Both are in severe shortage. *Between Boards*: Chip-to-chip communication is hitting limits with copper, pushing photonics and optical interconnects (CPO) as the next-gen solution, with NVIDIA heavily investing in this area. *Around the Board*: Power delivery requires new materials (GaN/SiC) for efficient voltage conversion from 48V to sub-1V. High-density AI racks (120kW+) are forcing a shift from air to liquid cooling as the standard. *Beyond the Board*: The ultimate bottleneck is electricity. AI data centers consume power equivalent to mid-sized cities, and grid expansion lags far behind demand, causing project delays and a scramble for power contracts. Prominent investors like Leopold and "white-haired stock god" are heavily betting on these infrastructure bottlenecks. Leopold's fund, for instance, holds no NVIDIA stock but uses massive put options to short the semiconductor sector while going long on power and physical infrastructure. His thesis is that while chip competition may eventually erode margins, the scarcity of foundational elements like electricity is more persistent. The framework's validity is tied to the supply-demand gap. Major new capacity in HBM and photonics is scheduled for 2027-2028, but demand continues to outpace it. Experts like Intel's CEO suggest no relief before 2028. However, the article warns of a potential reversal around 2028-2029 if AI capex slows and new capacity floods the market, turning scarcity into oversupply. Until then, the imbalance persists.

链捕手57m ago

From the White-Haired Stock God to the Billion-Dollar Fund Titan: The Smart People Shorting NVIDIA Are Getting Rich Using the Same Framework

链捕手57m ago

Trading

Spot
Futures

Hot Articles

Discussions

Welcome to the HTX Community. Here, you can stay informed about the latest platform developments and gain access to professional market insights. Users' opinions on the price of S (S) are presented below.

活动图片