全球股市动荡:美股夜盘暂停,日韩市场恐慌蔓延

链捕手Published on 2024-08-05Last updated on 2024-08-05

作者:陈植,21 世纪经济报道

编辑:周炎炎,21 世纪经济报道


日股、韩股暴跌的恐慌情绪,已经传至欧美市场。8月5日下午,多家券商发文称,由于美股夜盘上游系统异常,今日的夜盘时段已暂停交易。

图片

美股夜盘暂停交易!券商紧急提示

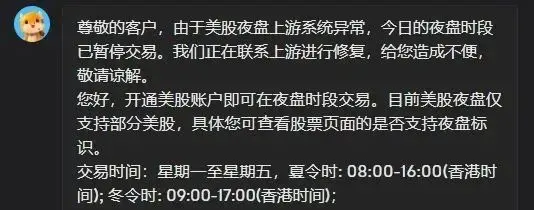
富途控股发文称,“尊敬的客户,由于美股夜盘上游系统异常,今日的夜盘时段已暂停交易。此次影响范围包括大部分提供夜盘交易服务的券商,我们正在联系上游进行沟通,给您造成不便,敬请谅解。”

图片

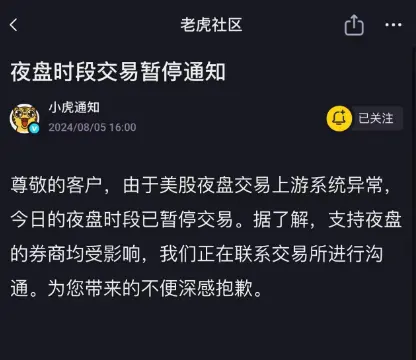
老虎证券亦向投资者发文称:“由于美股夜盘交易所系统异常,今日的夜盘时段已暂停交易。据了解,支持夜盘的券商均受影响。我们正在联系交易所进行沟通。为您带来的不便深感抱歉。”

图片

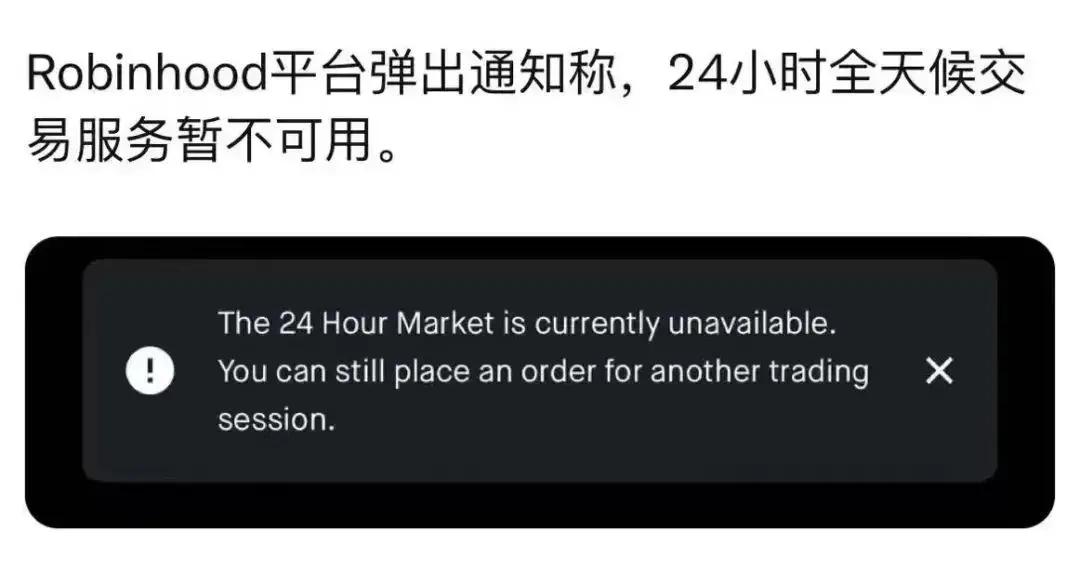
另据Watcher.Guru报道,Robinhood已暂停24小时交易。
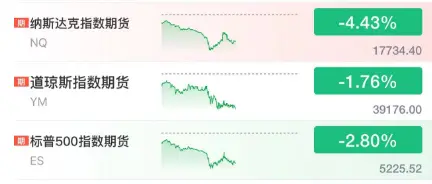
图片

大型科技股盘前下跌

8月5日,标普500指数期货扩大跌幅至盘中低点,下跌3.3%。

英伟达美股盘前跌幅扩大至13%。消息面上,报道称该公司新款人工智能芯片推迟发布,且整体市场普遍下滑。

其他万亿美元科技股也在下跌,其中包括苹果、亚马逊、微软、谷歌母公司Alphabet以及Facebook母公司 Meta Platforms。特斯拉股价盘前也下跌了超10%。这七只股票合计占纳斯达克100指数权重的43%左右。

图片

图片

现货白银和现货黄金持续走低

8月5日,现货白银持续走低,跌幅扩大至逾6.8%,报26.59美元/盎司;现货黄金跌幅扩大至3%,报2367.5美元/盎司。

图片

多国表态救市

据上海证券报,股市剧烈波动后,多国官员作出回应。

周一日本财务大臣铃木俊一表示,对股市下跌表现出强烈关注。股票价格由市场决定,对于政府而言,重要的是平心静气做出决定。

铃木俊一称,很难说股市下跌的背后原因是什么。他补充表示,政府正在与日本央行(BOJ)合作,并将继续密切关注市场,继续关注外汇市场的动向。他拒绝评论目前的日元水平是否被认为过高。铃木俊一表示,外汇汇率最好以稳定的方式变动,并反映经济基本面。

韩国监管当局也发表了若干评论,以安抚投资者情绪,韩国财政部称将根据应急计划应对加剧的市场波动。韩国监管当局还称,今天的股市下跌“过度”,将密切监测外汇和股票市场,并将在必要时迅速采取市场稳定措施。

泰国财政部长在周一表示,泰国将在10月份扩大政府股票基金以支持股市,并补充说市场下跌是由于外部因素所致。

周一,泰国主要股指下跌了2.93%,跌至自2020年11月初以来的最低点,受全球市场抛售潮的影响,这种抛售潮源于对美国经济衰退的担忧。

图片

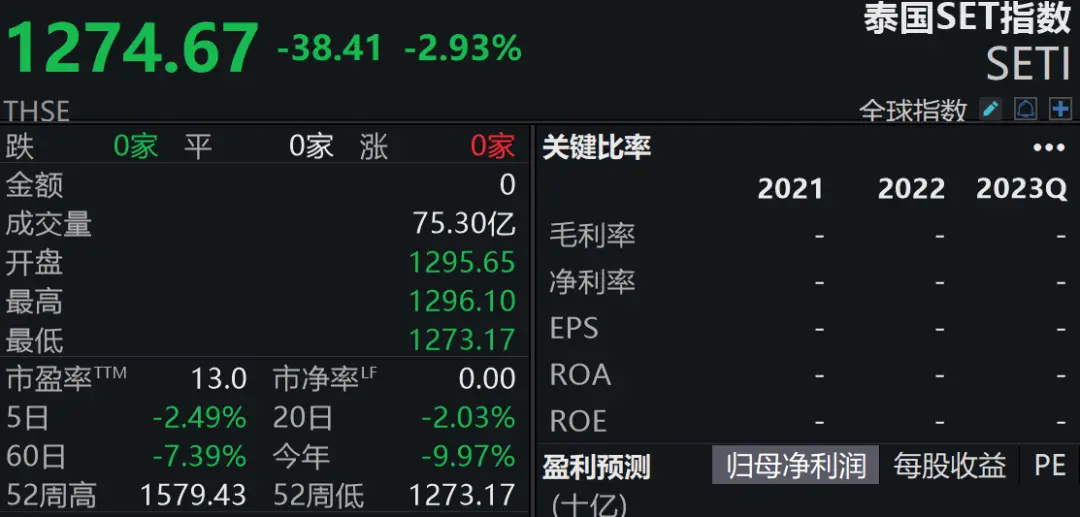
泰国财政部长此前曾表示,政府投资于股票的基金将增加1000亿泰铢,达到1500亿泰铢。

日股“黑色星期一”:海外资本大规模平仓

8月5日,日本股市迎来“黑色星期一”。

截至当天收盘时,日经225指数收在31078点,跌幅达到13.46%,盘中最大跌幅一度超过15%。截至收盘时,日经225指数已基本抹去今年以来的所有涨幅。

据21世纪经济报道采访,在业内人士看来,日本股市之所以遭遇“黑色星期一”,主要受多方面因素影响:

一是上周日本央行加息缩表举措导致市场调低日本出口类企业股票业绩增长前景,引发获利回吐潮涌;

二是中东地区升级冲突,或令此前淘金日本股市的中东资金纷纷迅速撤离并回流本土;

三是美国疲弱的7月非农就业数据引发美国经济硬着陆担忧,令日本股市的投资信心相应下降;

四是上周五欧美股市大跌,或令部分欧美投资机构将资金回流本土“冲抵”欧美地区杠杆投资组合保证金追加要求。

多位新兴市场投资基金经理告诉记者,引发日本股市大跌的另一个不容忽视的资本力量,是海外资本的反向日元利差交易大幅“平仓”。

 海外资本为何热衷反向日元利差交易

21世纪经济报道记者获悉,受此前日本央行延续极度宽松的货币政策影响,金融市场存在着两大日元套利交易。

一是日本本地投资者先借入低息日元放大投资杠杆,再将日元兑换成美元等外币,投资海外高收益债券或股票,博取可观的利差回报;

二是越来越多海外投资机构也在借入低息日元放大投资杠杆,再投资日本股市,押注日本股市上涨与日元升值获利。由于后者与日本本地投资者运作的日本利差交易资金流向截然不同,也被金融市场称之为“反向日元利差交易”。

受去年日本经济持续复苏(摆脱经济通缩)、日本上市公司分红回购力度增强等因素影响,越来越多海外资本纷纷采取反向日元利差交易模式,加仓日本股票押注日本股市上涨。

尤其是股神巴菲特采取发行日元债券融资再抄底日股获得丰厚回报,令海外资本对反向日元利差交易更加趋之若鹜。

多位新兴市场投资基金经理直言,去年以来日本股市大涨期间,海外资本流入日本股市的资金量,占到整个日本股市资金流入量的逾30%,其中相当比例的海外投资资金来自反向日元利差交易。这背后,是反向日元利差交易具备“以小博大”的特点,即海外资本只需动用较低利息支出就能获得较高的资本杠杆,成倍放大投资规模,从而获得更高的日股上涨收益。

一位外汇经纪商向记者透露,反向日元利差交易之所以盛行,另一个重要原因是众多海外资本看好日元未来升值前景。尽管受日本央行延续极度宽松的货币政策影响,去年以来日元兑美元汇率一直跌跌不休,但海外资本认为日本央行迟早会收紧货币政策令日元汇率大涨,令反向日元套利交易在汇兑方面获得不菲的回报。

图片

“去年底以来,随着日元兑美元汇率一直下跌,甚至一度跌破160整数关口,但海外资本采取越跌越买的策略——即日元汇率越跌,他们就越将美元换成更多日元(或者借入更多低息日元),并买入日经225指数ETF,等待日元升值的收获季。”他指出。

如今,在日本央行大幅加息缩表、美国疲弱7月非农就业数据引发美联储9月大幅降息50个基点、中东地区紧张局势持续升级的共振下,日元兑美元汇率从7月初的161大幅涨至142.85附近,令海外资本看到丰厚的反向日元利差交易汇兑收益,纷纷大举抛售日本股票并将日元兑换成美元,收获巨额的汇兑收益。

Related Reads

Rented Faith: How Much of the Bitcoin ETF Inflows Is Real Money?

"Rented Conviction: How Much of Bitcoin ETF Flows Is Real Money" The weekly inflows into Bitcoin ETFs are often interpreted as a gauge of institutional belief. However, a significant portion of this activity is driven by a hidden arbitrage trade, not directional conviction. The core mechanism is a cash-and-carry arbitrage: traders buy spot Bitcoin (often via ETFs) while simultaneously shorting CME futures to lock in the price difference, or "basis." This delta-neutral trade is essentially an interest rate play. In weekly data, about half the fluctuation in ETF flows can be explained by new short positions added by leveraged funds (hedge funds), with a correlation of 0.70. Bitcoin's price movement in a given week shows no statistical power in predicting these flows. While this arbitrage trade drives weekly *volatility*, it is not the main component of the cumulative *stock*. Of the total ~$55 billion in net ETF inflows, the current net arbitrage position is only about $1 billion. The remainder is steady, directional buying averaging ~$400 million per week, which constitutes the vast majority of the accumulated "mountain" over two years. Thus, ETF flow data overstates the *volatility* of conviction, not its *level*. This arbitrage trade has been unwinding for nearly two years. Leveraged fund short positions peaked at ~$14 billion in late 2024 and have since declined to ~$4.5 billion. When the basis compresses to unprofitable levels, ETF inflows and short positions retreat together. Recent outflows should not be mistaken for a loss of faith but rather the routine unwinding of this rate trade. For Ethereum ETFs, the pattern is weaker. Accounting for staking yield makes the basis often negative, so neither strong conviction buying nor robust arbitrage supports its flows. To interpret ETF flows correctly, monitor the CME basis versus T-bill rates and leveraged fund net shorts. They reveal how much of the next "demand" headline is real. The real, patient buy-and-hold demand is what constitutes the enduring bulk of ETF assets.

marsbit1m ago

Rented Faith: How Much of the Bitcoin ETF Inflows Is Real Money?

marsbit1m ago

Soaring Over Tenfold Within the Year: The Frenzy Over SK Hynix Leveraged Products

South China Morning Post The leveraged ETF tracking SK Hynix has surged over tenfold year-to-date, fueled by intense market speculation on the memory chip sector. By June 22, the value of the 'South Korea 2x Long SK Hynix ETF' listed in Hong Kong had skyrocketed by more than 1,061% since the start of the year, while its asset size exploded over twenty times from the end of last year. The rally is driven by AI-driven demand for high-bandwidth memory (HBM), with SK Hynix recently sampling its next-generation HBM4E product. However, industry professionals warn of significant risks. Leveraged ETFs magnify both gains and losses. During a recent market correction, while the underlying SK Hynix stock fell 19.1%, its double-leveraged ETF dropped nearly 38%. Korean regulators noted that such products could theoretically lose 60% in a single day. Additionally, these ETFs face risks like time decay in volatile markets, liquidity spirals during mass redemptions, and extreme price dislocations from market-making failures, as seen in early June when an ETF moved opposite to its underlying stock. The trading is predominantly driven by retail investors, with institutional capital largely absent due to the products' high volatility. Analysts caution that with the semiconductor sector at elevated valuations and facing geopolitical and supply chain uncertainties, leveraged ETFs pose a substantial threat of amplified losses for uninformed investors.

marsbit1h ago

Soaring Over Tenfold Within the Year: The Frenzy Over SK Hynix Leveraged Products

marsbit1h ago

18 Months, Over 50x Surge: KIOXIA's Epic Comeback

KIOXIA, a NAND flash memory giant, staged a dramatic comeback driven by AI demand. After a period of significant losses, a failed merger, and missed HBM opportunities, its 2024 IPO began modestly. However, fueled by explosive demand for AI data storage, its stock price skyrocketed over 50 times within 18 months, making it Japan's most valuable company, surpassing Toyota. Its Q1 FY2026 profit guidance soared 30-fold year-over-year, with 2026 NAND capacity already sold out. Key to its success is its 3D NAND technology, BiCS FLASH. As the inventor of NAND, KIOXIA advanced its technology through generations, reaching over 200 layers by 2023. Key innovations include CBA (CMOS directly Bonded to Array), which separately manufactures control circuits and memory arrays for better performance, and OPS (On Pitch Select Gate) to increase density. The company is now developing high-capacity packages like an 8TB solution stacking 32 dies. Looking beyond NAND, KIOXIA is exploring 3D DRAM with its OCTRAM technology, using oxide semiconductor transistors for ultra-low leakage to reduce power consumption. This fundamental research differs from HBM and represents a long-term bet to extend its 3D expertise from NAND into future DRAM architectures. KIOXIA's story highlights how technological assets and shifting market cycles can rapidly transform a company's fortunes. While questions remain about sustaining growth beyond the current AI boom, its resurgence demonstrates that in semiconductors, being down does not necessarily mean being out.

marsbit1h ago

18 Months, Over 50x Surge: KIOXIA's Epic Comeback

marsbit1h ago

Market Trends in U.S. Stocks (June 23): Peak at Listing? SpaceX Loses Over $800 Billion in Three Days, Tech Stocks Experience Severe Internal Divergence

Stock Market Trends (June 23): Did SpaceX Peak at IPO? The company loses over $800 billion in market value in three days as a sharp divergence unfolds within the tech sector. SpaceX's post-IPO decline of over 20%, falling below its first-day close, reflects a swift market repricing. The catalyst is a clear shift in narrative from "AI platform potential" to concerns over rising capital costs, as its $8.57 billion IPO and subsequent $20 billion debt offering are earmarked for acquisitions and refinancing existing bridge loans rather than de-leveraging. While high-valuation tech stocks like Google, Meta, Amazon, and Microsoft faced pressure, Micron surged nearly 7% to a record high following a strategic supply deal with Anthropic for HBM and memory, highlighting robust, tangible demand in AI infrastructure. The broader market saw funds rotate into more defensive industrial and financial names. Macro factors included a dip in oil prices to a three-month low on news of a US-Iran framework deal, though logistical hurdles for resuming full Strait of Hormuz shipments remain. Key events ahead include Nvidia's shareholder meeting, Micron's earnings, and the May PCE inflation data. The latter will be crucial in determining whether the sell-off in high-valuation growth stocks, which appears to have just begun, will persist.

marsbit1h ago

Market Trends in U.S. Stocks (June 23): Peak at Listing? SpaceX Loses Over $800 Billion in Three Days, Tech Stocks Experience Severe Internal Divergence

marsbit1h ago

Trading

Spot
Futures
活动图片