Arbitrum (ARB) 价格在清算不断增加的情况下创下历史新低、会不会反弹?

金色财经Published on 2024-08-05Last updated on 2024-08-05

Arbitrum (ARB) 的价格在过去 24 小时内暴跌了 23% 以上。这是因为它与比特币 (BTC) 和以太坊 (ETH) 等主要资产具有显著的正相关性,而这些资产的价值在此期间已跌至数月来的最低点。

截至撰写本文时,第 2 层(L2)代币的交易价格为 0.44 美元,为历史最低价。

Arbitrum下跌两位数,多头交易者计算损失

尽管 ARB 呈下降趋势,但其每日交易量却大幅上涨。截至发稿时,其总交易量已达 5.89 亿美元,在过去 24 小时内上涨了 151%。ARB 的价格和交易量的反向走势形成了负向背离,表明对 L2 代币存在明显的看跌倾向。

价格下跌期间成交量激增意味着许多投资者正在抛售资产,这可能是由于负面消息或更广泛的市场低迷。交易量的减少表明下跌趋势并非偶然,而是得到了大量抛售活动的支持。

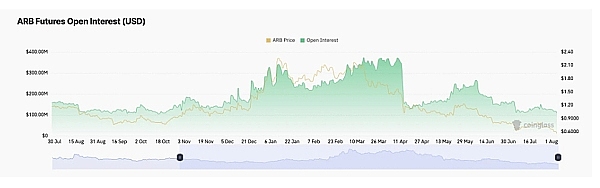
ARB 在过去 24 小时内的两位数价格下跌也影响了其衍生品市场的活动。虽然其衍生品交易量在报告期内飙升了 200% 以上,但未平仓合约下跌 30% 证实了许多市场参与者正在退出 ARB 的期货和期权市场,以防止进一步损失。

根据 Coinglass 的数据,截至本文撰写时,该山寨币的期货未平仓合约为 1.09 亿美元,为 2023 年 10 月以来的最低水平。 

6hktwnVJxQadESWi9pQA5EmCI5c2JAhfVR2KQ0lV.jpeg

此外,价格下跌引发了多头清算的激增,因为市场错误一方的交易者被迫平仓。根据 Coinglass 的数据,截至撰写本文时,ARB 多头清算已达到 201 万美元。上一次每日多头清算如此之高是在 6 月 7 日。

nSM73PnN2bVtOwtmUJnl580mBEl6gNlbosYxKiRl.jpeg

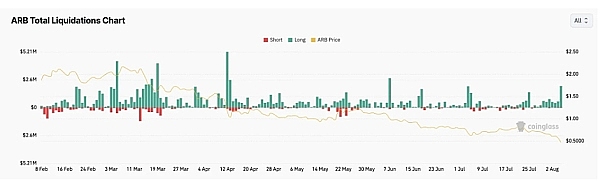
多头清算是指持有多头头寸的交易者被迫以较低的价格出售资产以弥补价格下跌造成的损失。这通常发生在资产价格跌至某个阈值以下时,迫使押注价格上涨的交易者退出市场。

ARB价格预测:反弹在望?

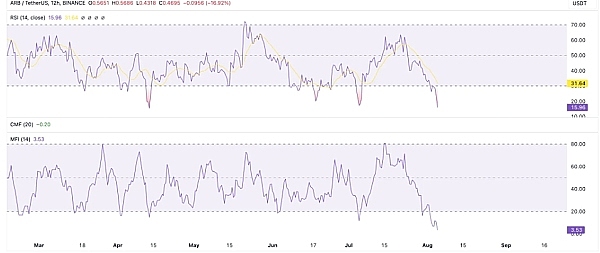
ARB 的关键动量指标、相对强弱指数 ( RSI ) 和资金流量指数 (MFI) 的读数表明,反弹可能即将出现。

截至发稿时,ARB 的 RSI 为 15.96,而其 MFI 为 3.53。这些值表明 ARB 处于超卖状态,可能很快会经历正向修正。 

SB3OTYMUuxH81EsBW0qVRIiiQY3TcndolNUgu5qo.jpeg

虽然这可能是可能的,但对 L2 代币的看跌偏见仍然很明显,大量流动性交易者继续从 ARB 市场中撤出就证明了这一点。 

根据 ARB 的 Chaikin 资金流 (CMF),该指标衡量了资金如何流入和流出市场,目前市场疲软。低于零的 -0.20 表示代币的 CMF 表明大量资本流出。这是价格进一步下跌的已知前兆。 

O0vbB4ouZBodkHD1nAphsO8HqqcFHyjWFvIhDmeo.jpeg

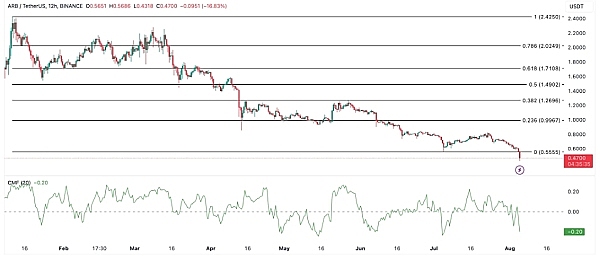
这可能会进一步推低代币价格。但是,如果出现反弹,ARB 的价格可能会跌至 0.99 美元。

Trending Cryptos

Related Reads

Rented Faith: How Much of the Bitcoin ETF Inflows Is Real Money?

"Rented Conviction: How Much of Bitcoin ETF Flows Is Real Money" The weekly inflows into Bitcoin ETFs are often interpreted as a gauge of institutional belief. However, a significant portion of this activity is driven by a hidden arbitrage trade, not directional conviction. The core mechanism is a cash-and-carry arbitrage: traders buy spot Bitcoin (often via ETFs) while simultaneously shorting CME futures to lock in the price difference, or "basis." This delta-neutral trade is essentially an interest rate play. In weekly data, about half the fluctuation in ETF flows can be explained by new short positions added by leveraged funds (hedge funds), with a correlation of 0.70. Bitcoin's price movement in a given week shows no statistical power in predicting these flows. While this arbitrage trade drives weekly *volatility*, it is not the main component of the cumulative *stock*. Of the total ~$55 billion in net ETF inflows, the current net arbitrage position is only about $1 billion. The remainder is steady, directional buying averaging ~$400 million per week, which constitutes the vast majority of the accumulated "mountain" over two years. Thus, ETF flow data overstates the *volatility* of conviction, not its *level*. This arbitrage trade has been unwinding for nearly two years. Leveraged fund short positions peaked at ~$14 billion in late 2024 and have since declined to ~$4.5 billion. When the basis compresses to unprofitable levels, ETF inflows and short positions retreat together. Recent outflows should not be mistaken for a loss of faith but rather the routine unwinding of this rate trade. For Ethereum ETFs, the pattern is weaker. Accounting for staking yield makes the basis often negative, so neither strong conviction buying nor robust arbitrage supports its flows. To interpret ETF flows correctly, monitor the CME basis versus T-bill rates and leveraged fund net shorts. They reveal how much of the next "demand" headline is real. The real, patient buy-and-hold demand is what constitutes the enduring bulk of ETF assets.

marsbit1m ago

Rented Faith: How Much of the Bitcoin ETF Inflows Is Real Money?

marsbit1m ago

Soaring Over Tenfold Within the Year: The Frenzy Over SK Hynix Leveraged Products

South China Morning Post The leveraged ETF tracking SK Hynix has surged over tenfold year-to-date, fueled by intense market speculation on the memory chip sector. By June 22, the value of the 'South Korea 2x Long SK Hynix ETF' listed in Hong Kong had skyrocketed by more than 1,061% since the start of the year, while its asset size exploded over twenty times from the end of last year. The rally is driven by AI-driven demand for high-bandwidth memory (HBM), with SK Hynix recently sampling its next-generation HBM4E product. However, industry professionals warn of significant risks. Leveraged ETFs magnify both gains and losses. During a recent market correction, while the underlying SK Hynix stock fell 19.1%, its double-leveraged ETF dropped nearly 38%. Korean regulators noted that such products could theoretically lose 60% in a single day. Additionally, these ETFs face risks like time decay in volatile markets, liquidity spirals during mass redemptions, and extreme price dislocations from market-making failures, as seen in early June when an ETF moved opposite to its underlying stock. The trading is predominantly driven by retail investors, with institutional capital largely absent due to the products' high volatility. Analysts caution that with the semiconductor sector at elevated valuations and facing geopolitical and supply chain uncertainties, leveraged ETFs pose a substantial threat of amplified losses for uninformed investors.

marsbit1h ago

Soaring Over Tenfold Within the Year: The Frenzy Over SK Hynix Leveraged Products

marsbit1h ago

18 Months, Over 50x Surge: KIOXIA's Epic Comeback

KIOXIA, a NAND flash memory giant, staged a dramatic comeback driven by AI demand. After a period of significant losses, a failed merger, and missed HBM opportunities, its 2024 IPO began modestly. However, fueled by explosive demand for AI data storage, its stock price skyrocketed over 50 times within 18 months, making it Japan's most valuable company, surpassing Toyota. Its Q1 FY2026 profit guidance soared 30-fold year-over-year, with 2026 NAND capacity already sold out. Key to its success is its 3D NAND technology, BiCS FLASH. As the inventor of NAND, KIOXIA advanced its technology through generations, reaching over 200 layers by 2023. Key innovations include CBA (CMOS directly Bonded to Array), which separately manufactures control circuits and memory arrays for better performance, and OPS (On Pitch Select Gate) to increase density. The company is now developing high-capacity packages like an 8TB solution stacking 32 dies. Looking beyond NAND, KIOXIA is exploring 3D DRAM with its OCTRAM technology, using oxide semiconductor transistors for ultra-low leakage to reduce power consumption. This fundamental research differs from HBM and represents a long-term bet to extend its 3D expertise from NAND into future DRAM architectures. KIOXIA's story highlights how technological assets and shifting market cycles can rapidly transform a company's fortunes. While questions remain about sustaining growth beyond the current AI boom, its resurgence demonstrates that in semiconductors, being down does not necessarily mean being out.

marsbit1h ago

18 Months, Over 50x Surge: KIOXIA's Epic Comeback

marsbit1h ago

Market Trends in U.S. Stocks (June 23): Peak at Listing? SpaceX Loses Over $800 Billion in Three Days, Tech Stocks Experience Severe Internal Divergence

Stock Market Trends (June 23): Did SpaceX Peak at IPO? The company loses over $800 billion in market value in three days as a sharp divergence unfolds within the tech sector. SpaceX's post-IPO decline of over 20%, falling below its first-day close, reflects a swift market repricing. The catalyst is a clear shift in narrative from "AI platform potential" to concerns over rising capital costs, as its $8.57 billion IPO and subsequent $20 billion debt offering are earmarked for acquisitions and refinancing existing bridge loans rather than de-leveraging. While high-valuation tech stocks like Google, Meta, Amazon, and Microsoft faced pressure, Micron surged nearly 7% to a record high following a strategic supply deal with Anthropic for HBM and memory, highlighting robust, tangible demand in AI infrastructure. The broader market saw funds rotate into more defensive industrial and financial names. Macro factors included a dip in oil prices to a three-month low on news of a US-Iran framework deal, though logistical hurdles for resuming full Strait of Hormuz shipments remain. Key events ahead include Nvidia's shareholder meeting, Micron's earnings, and the May PCE inflation data. The latter will be crucial in determining whether the sell-off in high-valuation growth stocks, which appears to have just begun, will persist.

marsbit1h ago

Market Trends in U.S. Stocks (June 23): Peak at Listing? SpaceX Loses Over $800 Billion in Three Days, Tech Stocks Experience Severe Internal Divergence

marsbit1h ago

Trading

Spot
Futures

Hot Articles

How to Buy ARB

Welcome to HTX.com! We've made purchasing Arbitrum (ARB) simple and convenient. Follow our step-by-step guide to embark on your crypto journey.Step 1: Create Your HTX AccountUse your email or phone number to sign up for a free account on HTX. Experience a hassle-free registration journey and unlock all features.Get My AccountStep 2: Go to Buy Crypto and Choose Your Payment MethodCredit/Debit Card: Use your Visa or Mastercard to buy Arbitrum (ARB) instantly.Balance: Use funds from your HTX account balance to trade seamlessly.Third Parties: We've added popular payment methods such as Google Pay and Apple Pay to enhance convenience.P2P: Trade directly with other users on HTX.Over-the-Counter (OTC): We offer tailor-made services and competitive exchange rates for traders.Step 3: Store Your Arbitrum (ARB)After purchasing your Arbitrum (ARB), store it in your HTX account. Alternatively, you can send it elsewhere via blockchain transfer or use it to trade other cryptocurrencies.Step 4: Trade Arbitrum (ARB)Easily trade Arbitrum (ARB) on HTX's spot market. Simply access your account, select your trading pair, execute your trades, and monitor in real-time. We offer a user-friendly experience for both beginners and seasoned traders.

5.7k Total ViewsPublished 2024.03.29Updated 2026.06.02

How to Buy ARB

Discussions

Welcome to the HTX Community. Here, you can stay informed about the latest platform developments and gain access to professional market insights. Users' opinions on the price of ARB (ARB) are presented below.

活动图片