How Does Current Bitcoin Rally Compare With Historical Ones?

newsbtcPublished on 2023-05-23Last updated on 2023-05-23

Abstract

Here's how the current Bitcoin rally stacks up against the previous ones in terms of the drawdowns it has experienced so far. The Current Bitcoin Rally Has Seen A Peak...

Here’s how the current Bitcoin rally stacks up against the previous ones in terms of the drawdowns it has experienced so far.
The Current Bitcoin Rally Has Seen A Peak Drawdown Of -18.6% So Far
In a recent tweet, the on-chain analytics firm Glassnode compared the latest Bitcoin rally with the ones seen throughout the entire history of the cryptocurrency.
Generally, rallies are compared using metrics like the percentage price uplifts recorded during them or the amount of time that they lasted (which may be measured in terms of the blocks produced, as is done when looking at cycles in terms of halvingsere, however, Glassnode has taken a different approach that provides a new perspective on these rallies.

The comparison basis between the price surges here is the drawdowns that each of them experienced across their spans. Note that these drawdowns aren’t to be confused with the cyclical drawdowns that are used to measure how the price has declined since the bull run top.
The drawdowns in question are the obstacles that the cryptocurrency encountered while the rallies were still ongoing, and are hence, those that the coin eventually managed to overcome.
Here is a chart that shows the degree of drawdowns that each of the historical bull markets experienced, and also where the current rally stands in comparison to them:
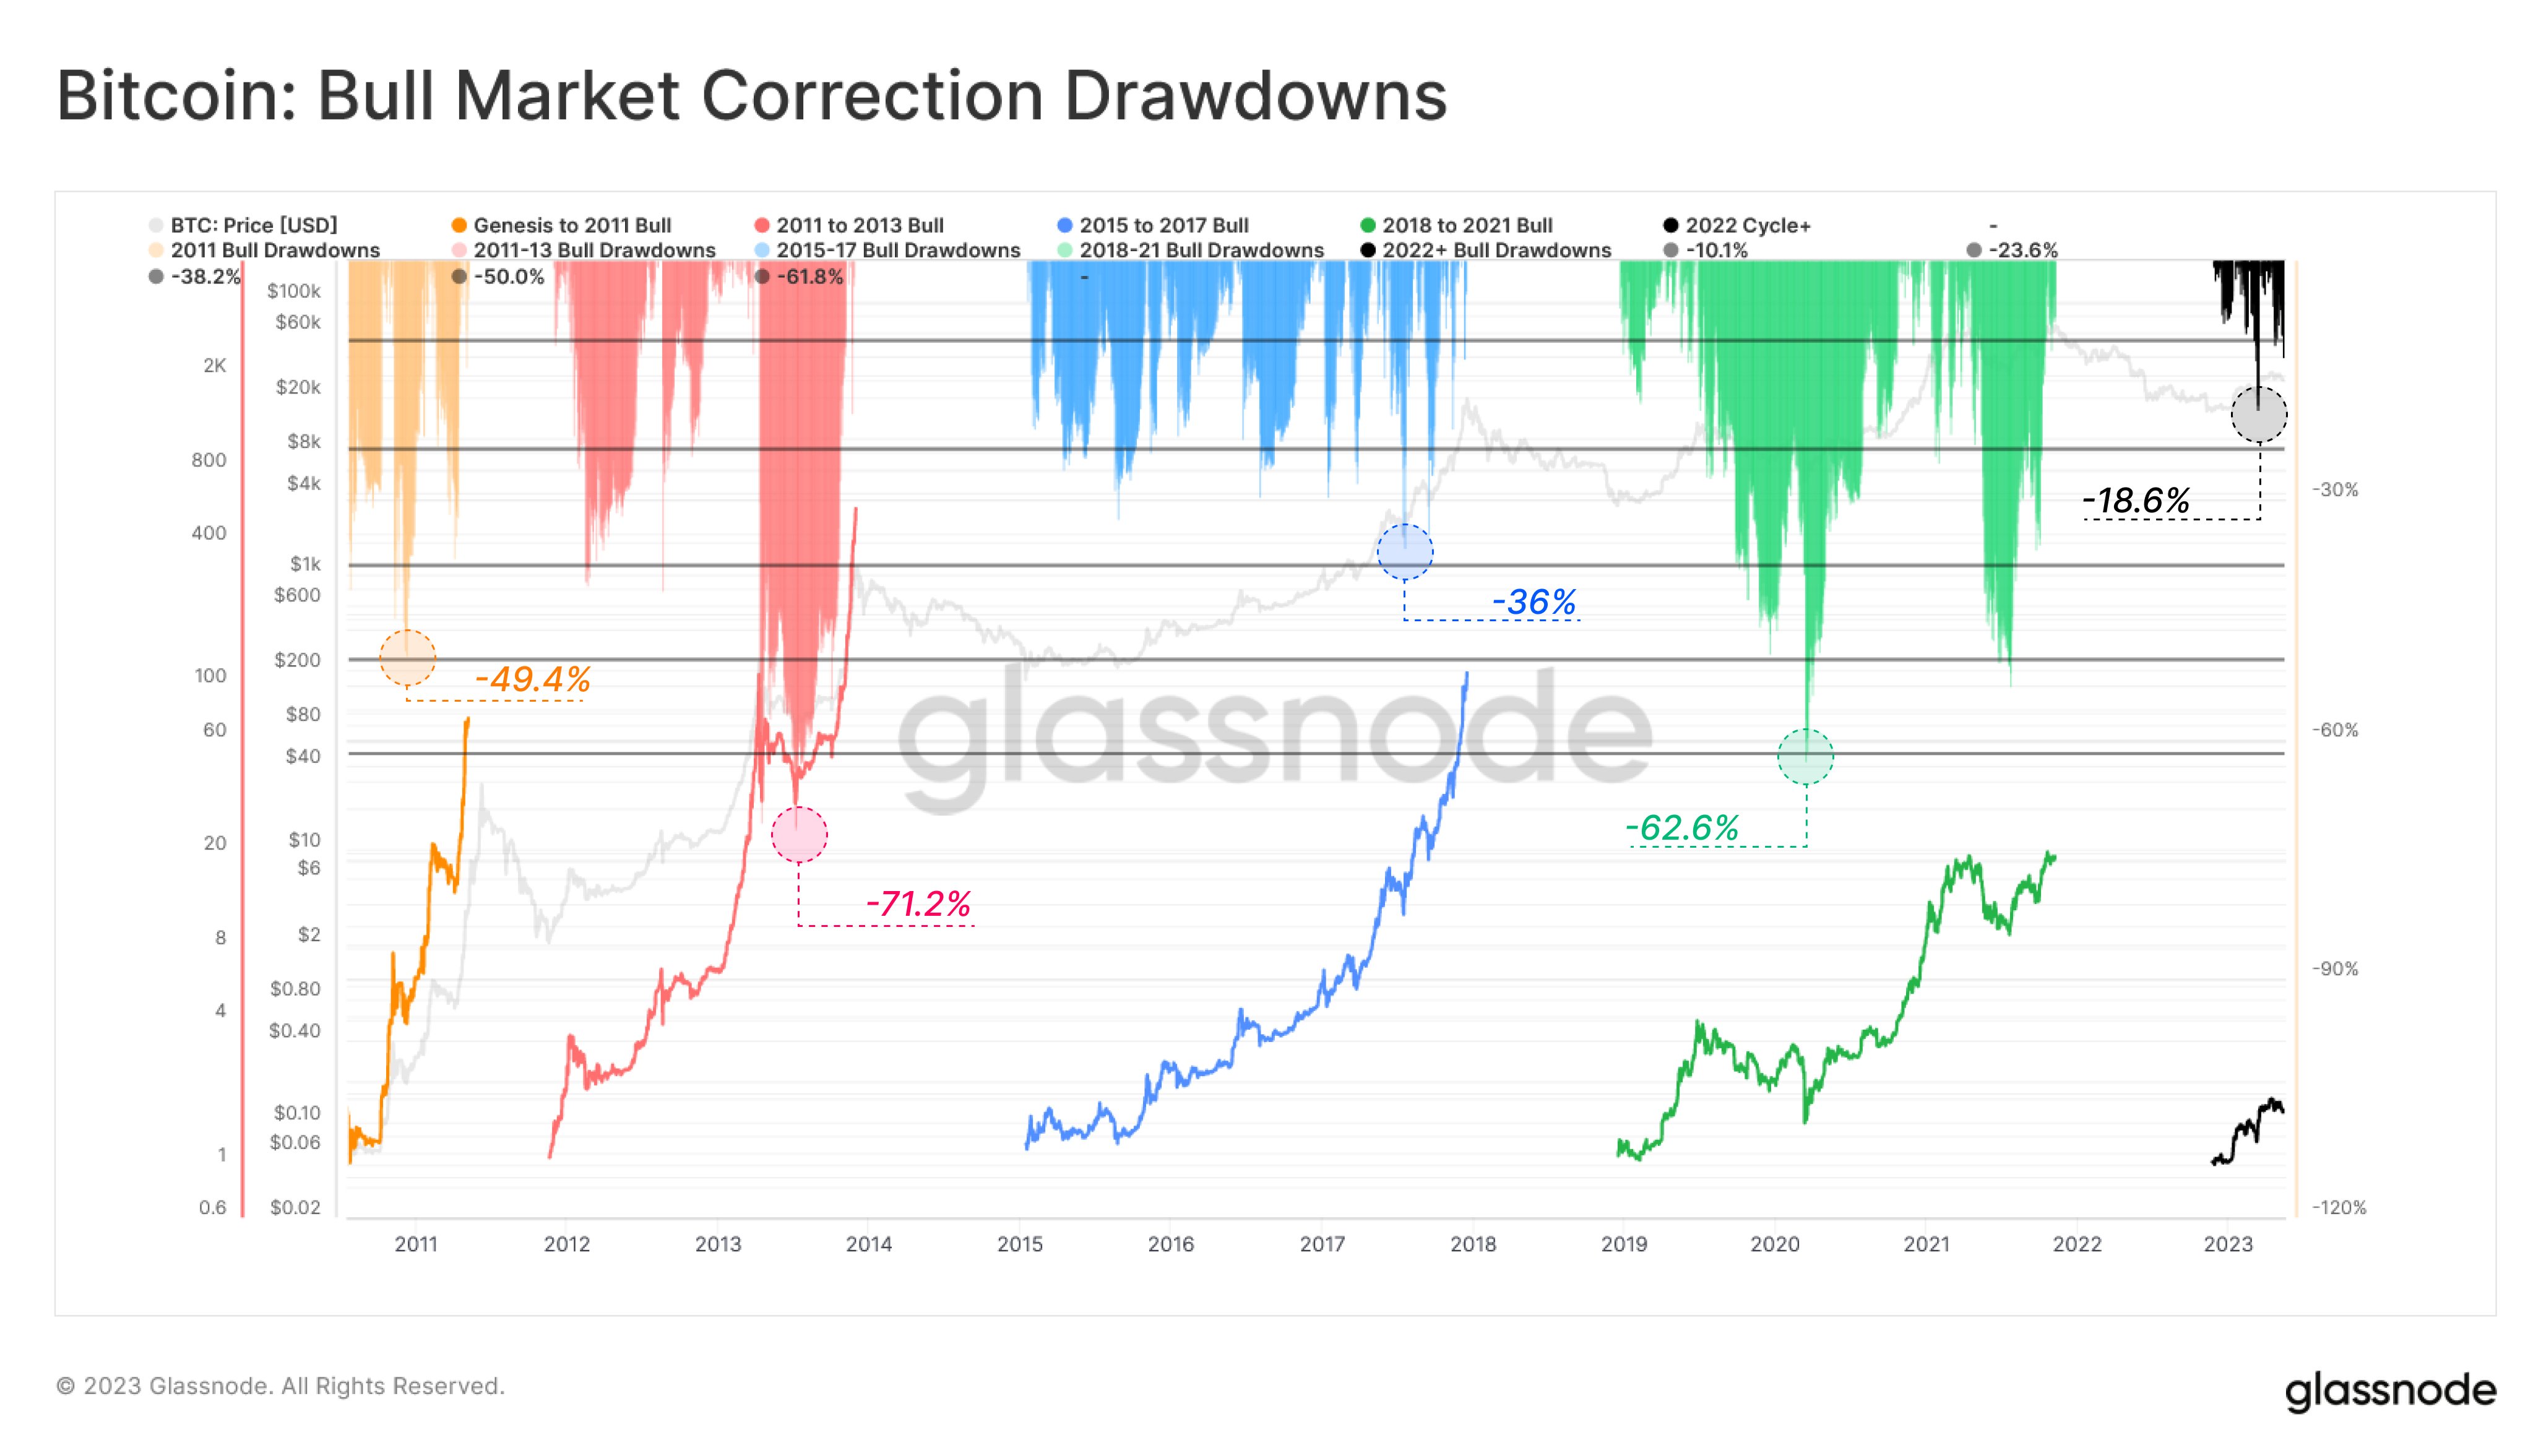
Bitcoin Bull Market Drawdowns


Looks like the value of the metric hasn't been too high for the latest rally so far | Source: Glassnode on Twitter
The five bull rallies here are as follows: genesis to 2011 (the very first rally), 2011-2013, 2015-2017, 2018-2021 (the last rally), and 2022 cycle+ (the ongoing one).
The analytics firm here has taken the bottom of each of the bear markets as the start of the next bull rallies. This means that parts of the cycle that some may not consider as part of the proper bull run are also included.
The main example of this would be the April 2019 rally, which is often considered its own thing but is clubbed with the last Bitcoin bull market in the above chart.
From the graph, it’s visible that the deepest drawdown that occurred during the first bull market measured around -49.4%. The next run, the 2011 to 2013 bull, experienced an even larger obstacle of a -71.2% plunge midway through it.
The next one (2015-2017) then only saw a drawdown of -36%, but the drawdown was again up at -62.6% for the run that followed it (that is, the latest bull market).
So far in the 2022+ Bitcoin bull market (which would only be considered a bull market at all if the November 2022 low was truly the cyclical bottom), the deepest drawdown observed so far is the March 2023 plunge of -18.6%.
Clearly, the drawdown seen in the current rally so far is significantly lesser than what the historical bull markets face. If the pattern of the past runs holds any weight at all, then this would mean that the current bull market should still have more potential to grow.
At the time of writing, Bitcoin is trading around $26,900, down 2% in the last week.

Bitcoin Price Chart


BTC has been moving sideways recently | Source: BTCUSD on TradingView
Featured image from iStock.com, charts from TradingView.com, Glassnode.com

Related Reads

Solana Proposals Could Lead to Reduction in Staking Yields to 2.25% and Cut Emissions by $1.5 Billion

Solana is moving towards a stricter monetary model that could lead to a SOL deficit and significantly reduce staking rewards for holders. Two governance proposals drive these changes. SIMD-550, currently under vote, would double Solana's annual disinflation rate from 15% to 30%, accelerating the timeline to reach a final inflation rate of ~1.5% to the first half of 2029. The second, SIMD-553 (already approved), introduces additional token burning tied to computational units used on the network. Together, these measures could reduce SOL emission by an estimated $1.4-$1.5 billion over six years. The immediate impact would be lower staking yields, potentially falling from the current ~5.25% to approximately 4.34% in year one, 3% in year two, and 2.25% by year three. Analyst Matt Mena from 21Shares suggests inflation should be tied to economic metrics to help offset this decline. The changes also raise concerns for validator economics, with some potentially becoming unprofitable as inflation rewards decrease and voting costs may rise. However, the lower passive yield might push a significant portion of the 67.9% staked SOL into Solana's DeFi ecosystem for activities like lending and trading. This shift could boost network fee revenue to compensate for lower inflation rewards. The proposals aim to trade lower yield today for less dilution tomorrow, betting that network growth and usage will make this a worthwhile trade-off for SOL holders.

cryptonews.ru27m ago

Solana Proposals Could Lead to Reduction in Staking Yields to 2.25% and Cut Emissions by $1.5 Billion

cryptonews.ru27m ago

Bitcoin 'Basically Hopped' to $80K. What Will Happen to the Price in Autumn?

Bitcoin surged close to $80,000 in August, marking its fastest growth since 2024. Experts anticipate continued volatility for the autumn season, with price forecasts heavily dependent on macroeconomic conditions and regulatory developments in the US. Key drivers for the recent rise include a weakening US dollar, renewed capital inflows into spot Bitcoin ETFs, and liquidations of trading positions. The US Treasury's decision to increase long-term bond purchases has helped stabilize debt markets but pressured the dollar, leading investors to seek assets like Bitcoin as a hedge. Looking ahead, experts outline two primary scenarios for Bitcoin's price. A positive outcome, supported by favorable macroeconomics and the potential passage of the CLARITY Act regulating crypto in the US, could push Bitcoin toward $85,000-$100,000. Conversely, a negative scenario involving hawkish signals from the US Federal Reserve or regulatory setbacks could trigger a correction, potentially driving the price back down to the $62,000-$75,000 range. Institutional demand, reflected in consistent ETF inflows, is seen as a crucial stabilizing factor, gradually outweighing the influence of Bitcoin's traditional four-year cycles. Meanwhile, a broad rally in altcoins is not widely expected, as capital is likely to flow selectively into the most liquid projects. The central question for autumn is whether institutional buying can transform August's rapid surge into a sustainable upward trend.

cryptonews.ru31m ago

Bitcoin 'Basically Hopped' to $80K. What Will Happen to the Price in Autumn?

cryptonews.ru31m ago

Trading

Spot
活动图片