Why Chainlink’s $32.6M whale move could shape LINK’s push toward $9

ambcryptoPublished on 2026-07-20Last updated on 2026-07-20

Abstract

A transfer of 3.89 million Chainlink (LINK) tokens worth $32.58 million from a Coinbase Institutional wallet to an unknown address drew significant attention, sparking speculation about strategic accumulation by large holders. This coincided with Chainlink's spot exchange netflows turning positive after a prolonged period of outflows, indicating a slight increase in tokens moving to exchanges. However, the overall selling pressure remained limited. Despite improving spot market activity and a price recovery to around $8.35, derivatives data revealed persistent bearish sentiment among futures traders, creating uncertainty. Technically, LINK faces resistance near $8.35. A successful break above this level could target $9, while a rejection might lead to a retest of support near $8.18. The article concludes that while institutional activity and spot buying are supportive, cautious futures positioning continues to challenge the recovery.

A transfer involving 3.89 million Chainlink [LINK] worth $32.58 million drew fresh attention to Chainlink after Whale Alert flagged the transaction. The tokens moved from a Coinbase Institutional wallet to an unknown wallet, encouraging speculation about strategic positioning among large holders rather than immediate exchange selling.

Such transfers often reflect changes in custody or portfolio management rather than outright distribution. However, the movement still highlighted growing institutional participation around LINK.

Large transactions frequently influence market sentiment because traders monitor them for signs of accumulation or distribution. As a result, the transfer placed Chainlink back on investors’ watchlists while the market assessed whether whale activity would support the ongoing recovery.

Exchange inflows returned after months of out flows

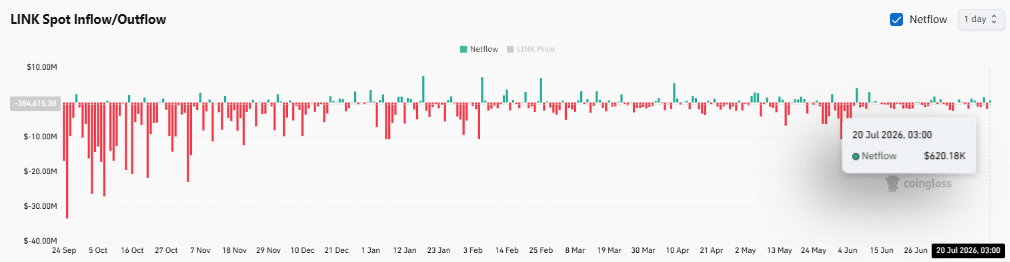
Chainlink’s spot netflows shifted into positive territory after recording an inflow of approximately $620.18K.

The change marked a notable departure from the prolonged period of exchange outflows that had previously reduced available selling supply. Positive netflows indicate that more tokens reached exchanges than left them during the latest session.

However, the relatively modest inflow suggested that exchange-bound supply remained limited instead of overwhelming the market. Even so, the latest reading reflected a change in short-term market behavior, making exchange activity an important metric for assessing LINK’s next directional move.
Source: CoinGlass

Can bearish futures sentiment derail LINK’s recovery?

Derivatives traders maintained a cautious stance despite improving activity in the spot market.

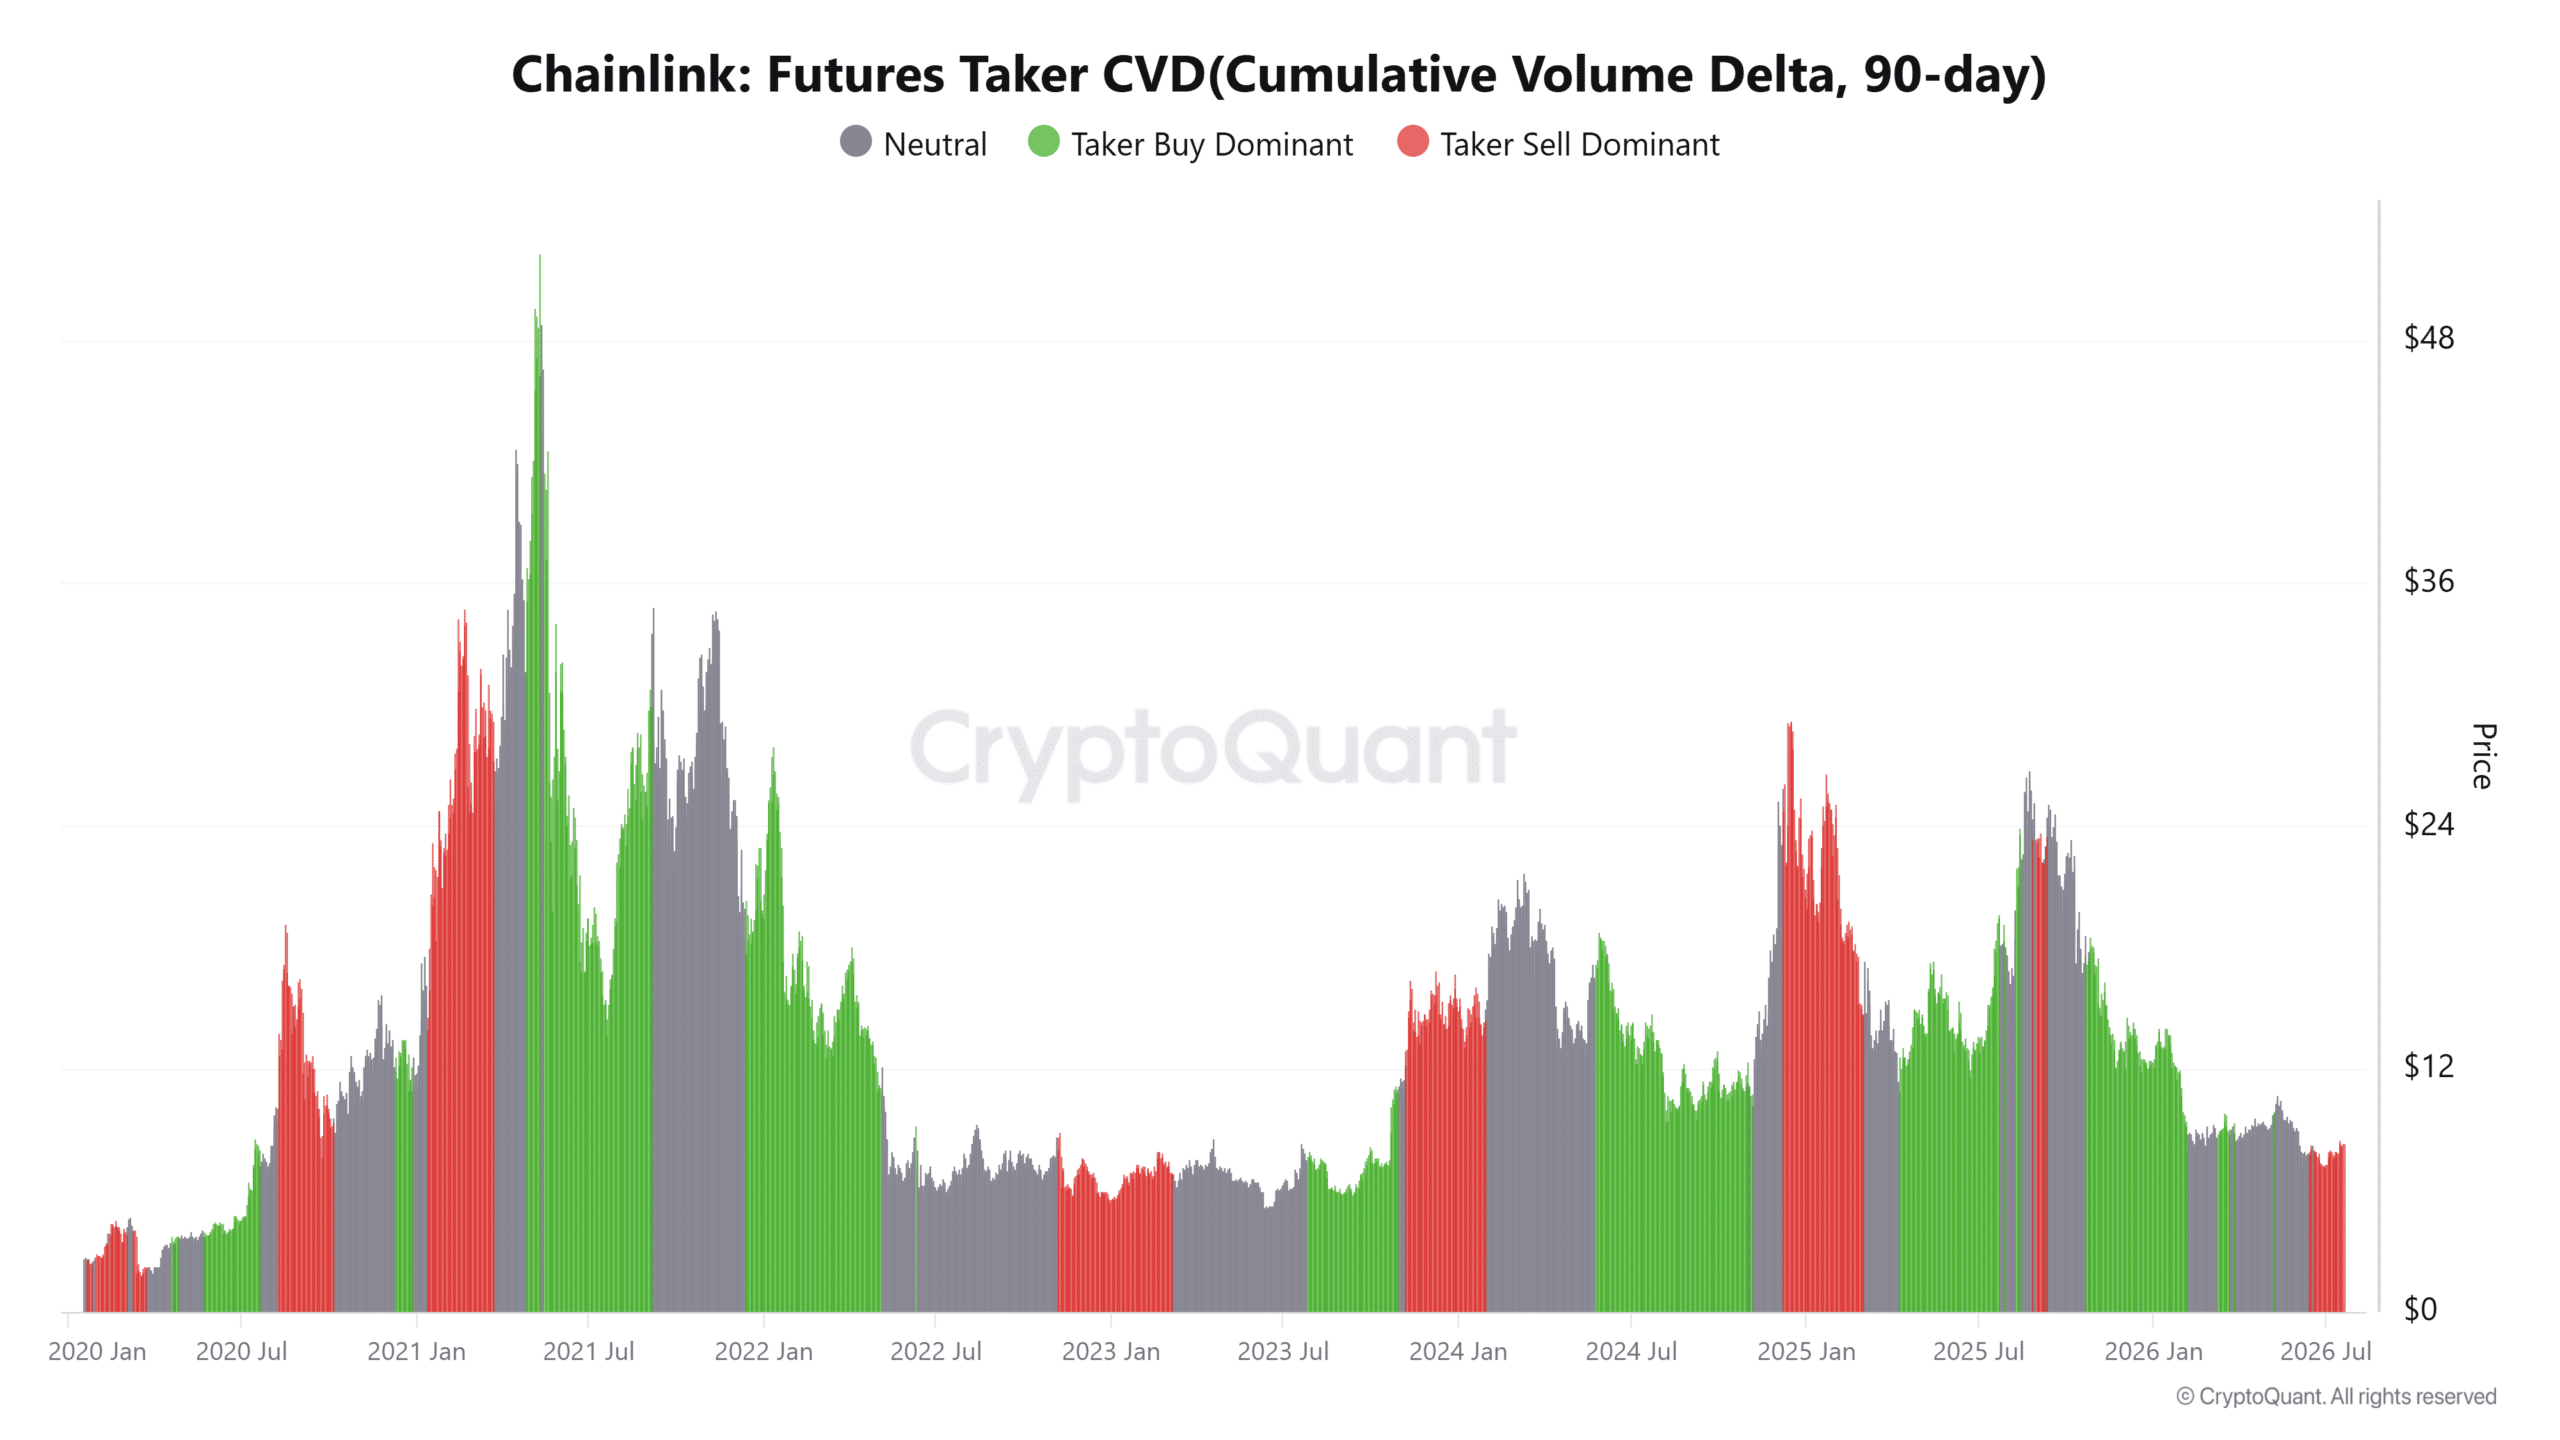
At press time, the 90-day Futures Taker CVD remained seller-dominant, indicating that aggressive market participants continued executing more sell orders than buy orders.

This imbalance suggested bearish conviction persisted among leveraged traders even as institutional wallet activity attracted attention. However, the divergence between spot positioning and futures activity created uncertainty around LINK’s short-term outlook.

Spot participants appeared willing to absorb supply, while futures traders continued favoring downside exposure. Such contrasting behavior often preceded stronger volatility because either buyers eventually overwhelmed sellers or derivatives sentiment pulled prices lower.
Source: CryptoQuant

Chainlink tests resistance as RSI continues improving

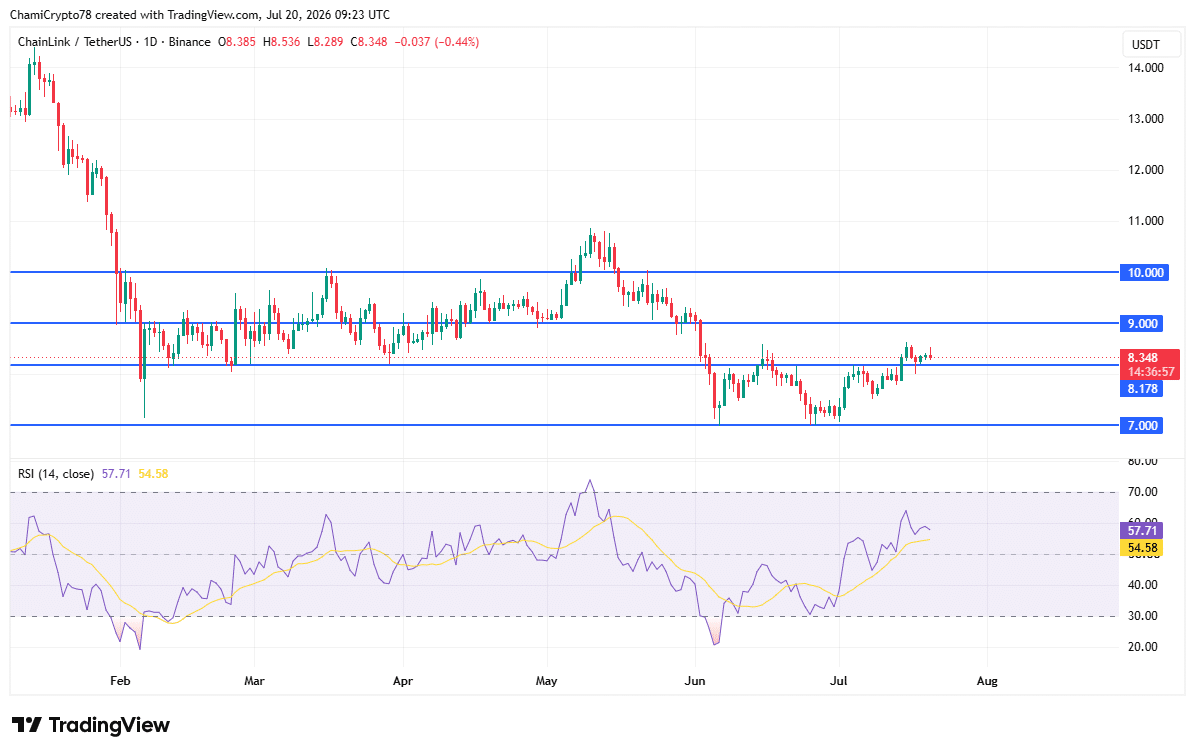
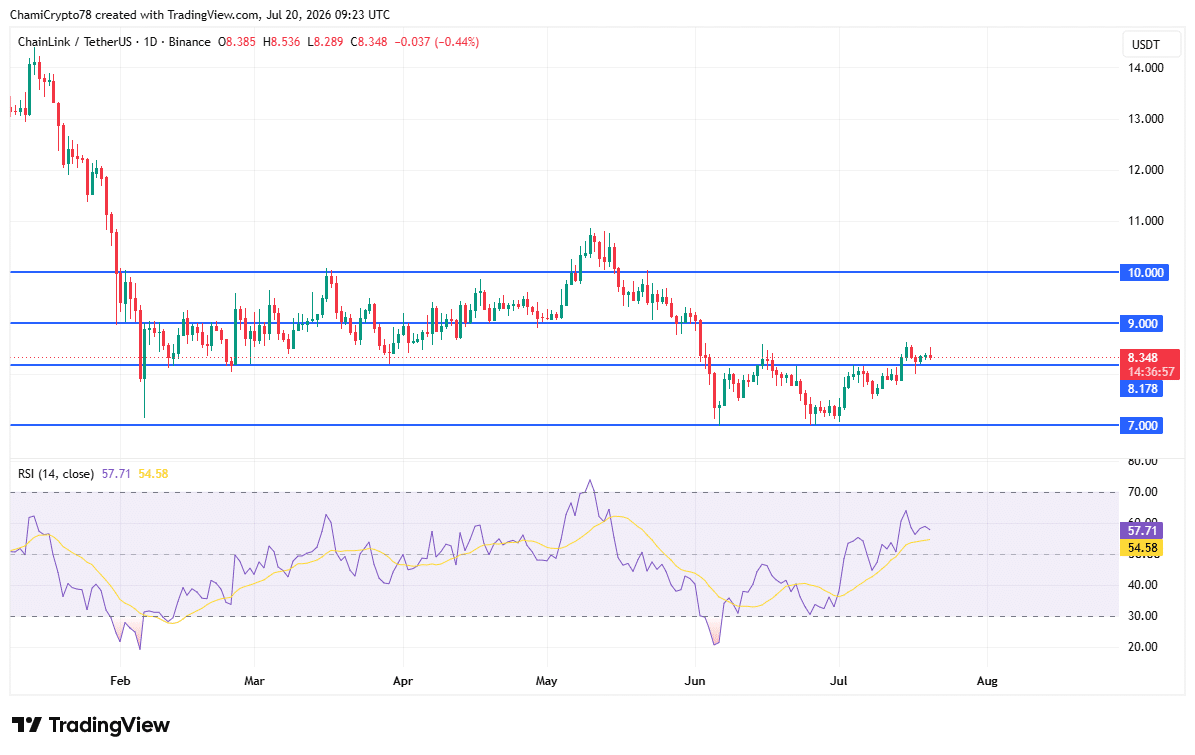
At the time of press, Chainlink [LINK] traded around $8.35 after extending its recovery from the $7.00 support region.

Buyers reclaimed the $8.18 level and pushed the price toward immediate resistance near $8.35, although that area continued limiting further advances.

A successful break above this zone would likely expose $9.00, while sustained buying could later bring $10.00 into focus. However, rejection at current levels could encourage another retest of $8.18 before buyers attempted another advance.

Meanwhile, the Relative Strength Index (RSI) climbed to 57.71 as of writing, remaining above its Moving Average near 54.58. The indicator reflected strengthening buying pressure without entering overbought territory.

As a result, the technical structure favored continued recovery, provided buyers reclaim nearby resistance with stronger participation.
Source: TradingView

To conclude, institutional wallet activity increased attention around Chainlink, while spot netflows shifted back into positive territory. However, seller-dominant futures positioning continued to signal caution.

If buyers clear the $8.35 resistance, LINK would likely challenge $9.00 next. Otherwise, another pullback toward $8.18 would remain the more likely short-term outcome.


Final Summary

  • Institutional wallet activity increased, while positive netflows reflected more LINK returning to exchanges.
  • LINK approached a key resistance, but bearish futures traders continued limiting the recovery.

Trending Cryptos

Related Questions

QWhat was the significance of the $32.58 million Chainlink (LINK) transfer flagged by Whale Alert?

AThe transfer of 3.89 million LINK from a Coinbase Institutional wallet to an unknown wallet drew attention to growing institutional participation. It encouraged speculation about strategic positioning by large holders rather than immediate selling pressure, influencing market sentiment.

QHow did Chainlink's spot netflows change according to the article, and what does it indicate?

AChainlink's spot netflows shifted into positive territory with an inflow of approximately $620.18K. This marked a departure from a prolonged period of outflows. While positive netflows indicate more tokens reached exchanges than left them, the modest size suggests the supply increase was limited and not overwhelming the market.

QWhat does the seller-dominant 90-day Futures Taker CVD indicate about market sentiment?

AThe seller-dominant 90-day Futures Taker CVD indicates that aggressive leveraged traders executed more sell orders than buy orders. This shows bearish conviction persisted among futures traders, creating uncertainty and contrasting with more positive spot market activity.

QWhat key price levels are discussed for Chainlink (LINK) in the technical analysis?

ALINK was trading around $8.35, having reclaimed the $8.18 support. Immediate resistance was near $8.35. A break above this zone could expose $9.00 and later $10.00. A rejection could lead to a retest of $8.18.

QWhat was the state of the Relative Strength Index (RSI) for LINK, and what does it suggest?

AThe RSI climbed to 57.71, remaining above its Moving Average at 54.58. This indicates strengthening buying pressure without the asset entering overbought territory, which favored a continued recovery provided buyers can overcome nearby resistance with stronger participation.

Related Reads

Bitcoin Boom in Full Swing: Saylor's Latest Statement Fuels Buying Speculation

MicroStrategy's Executive Chairman Michael Saylor has fueled speculation about a new Bitcoin purchase by posting "Bitcoin Drive engaged" on August 2, accompanied by the company's customary purchase tracker. This aligns with his pattern of hinting at treasury changes ahead of weekly reports. The accompanying report showed MicroStrategy's Bitcoin holdings at 843,775 BTC, with an average cost of $75,653 per coin and an unrealized loss of -$10.58B. A similar signal preceded the company's July 27 announcement, strengthening expectations for a treasury update on Monday. However, MicroStrategy's real-time ledger reflects two recent Bitcoin sales totaling 3,588 BTC, reducing holdings from 847,363 BTC to the current 843,775 BTC. The company stated these sales funded preferred stock dividends and replenished its U.S. dollar reserve. Recent reports indicate the company made no Bitcoin purchases the week ending July 26 while increasing its dollar reserve to approximately $3.75B. The company faces financial headwinds after reporting an $8.33B operating loss for Q2 2026, including an $8.32B unrealized loss on its digital assets. Management may sell up to $1.25B more in Bitcoin to meet cash obligations. The expected Monday update will reveal if the "Bitcoin Drive" signal marks a return to accumulation as MicroStrategy balances its massive Bitcoin stash against growing cash commitments.

cryptonews.ru2h ago

Bitcoin Boom in Full Swing: Saylor's Latest Statement Fuels Buying Speculation

cryptonews.ru2h ago

Trading

Spot

Hot Articles

How to Buy MOVE

Welcome to HTX.com! We've made purchasing Movement (MOVE) simple and convenient. Follow our step-by-step guide to embark on your crypto journey.Step 1: Create Your HTX AccountUse your email or phone number to sign up for a free account on HTX. Experience a hassle-free registration journey and unlock all features.Get My AccountStep 2: Go to Buy Crypto and Choose Your Payment MethodCredit/Debit Card: Use your Visa or Mastercard to buy Movement (MOVE) instantly.Balance: Use funds from your HTX account balance to trade seamlessly.Third Parties: We've added popular payment methods such as Google Pay and Apple Pay to enhance convenience.P2P: Trade directly with other users on HTX.Over-the-Counter (OTC): We offer tailor-made services and competitive exchange rates for traders.Step 3: Store Your Movement (MOVE)After purchasing your Movement (MOVE), store it in your HTX account. Alternatively, you can send it elsewhere via blockchain transfer or use it to trade other cryptocurrencies.Step 4: Trade Movement (MOVE)Easily trade Movement (MOVE) on HTX's spot market. Simply access your account, select your trading pair, execute your trades, and monitor in real-time. We offer a user-friendly experience for both beginners and seasoned traders.

5.3k Total ViewsPublished 2024.12.10Updated 2026.06.02

How to Buy MOVE

Discussions

Welcome to the HTX Community. Here, you can stay informed about the latest platform developments and gain access to professional market insights. Users' opinions on the price of MOVE (MOVE) are presented below.

活动图片













