Worldcoin bears force yet another structure break: What’s next for WLD?

ambcryptoPubblicato 2026-03-25Pubblicato ultima volta 2026-03-25

Introduzione

Worldcoin (WLD) experienced a brief bullish bounce on March 23, rebounding 8.46% from a low of $0.3039 to defend a key support level. However, the longer-term trend remains strongly bearish, with WLD having lost 73.57% of its value in under six months. Unlike some altcoins that benefited from Bitcoin's recent surge above $70k, WLD broke below its local support at $0.345 and made new lows on the daily chart. The 4-hour chart shows a bearish structure break from March 19, with the 23.6% Fibonacci retracement level at $0.326 acting as resistance. While the RSI and CMF indicate some momentum and capital inflow, the overall advice for traders is to sell any bounce toward the $0.354–$0.366 resistance zone. A break above $0.406 would be needed to invalidate the current bearish outlook.

Worldcoin [WLD] had a strong bullish showing on Monday, the 23rd of March. Buyers defended the $0.3075 support from the 6th of February, and forced an 8.46% bounce from the day’s low at $0.3039.

Since reaching $0.3296, WLD has receded and was trading at $0.3175 at the time of writing. Will the altcoin succeed in gathering steam for its next rally, or should traders expect more losses?

Worldcoin drops below the $0.345 local support

Source: WLD/USDT on TradingView

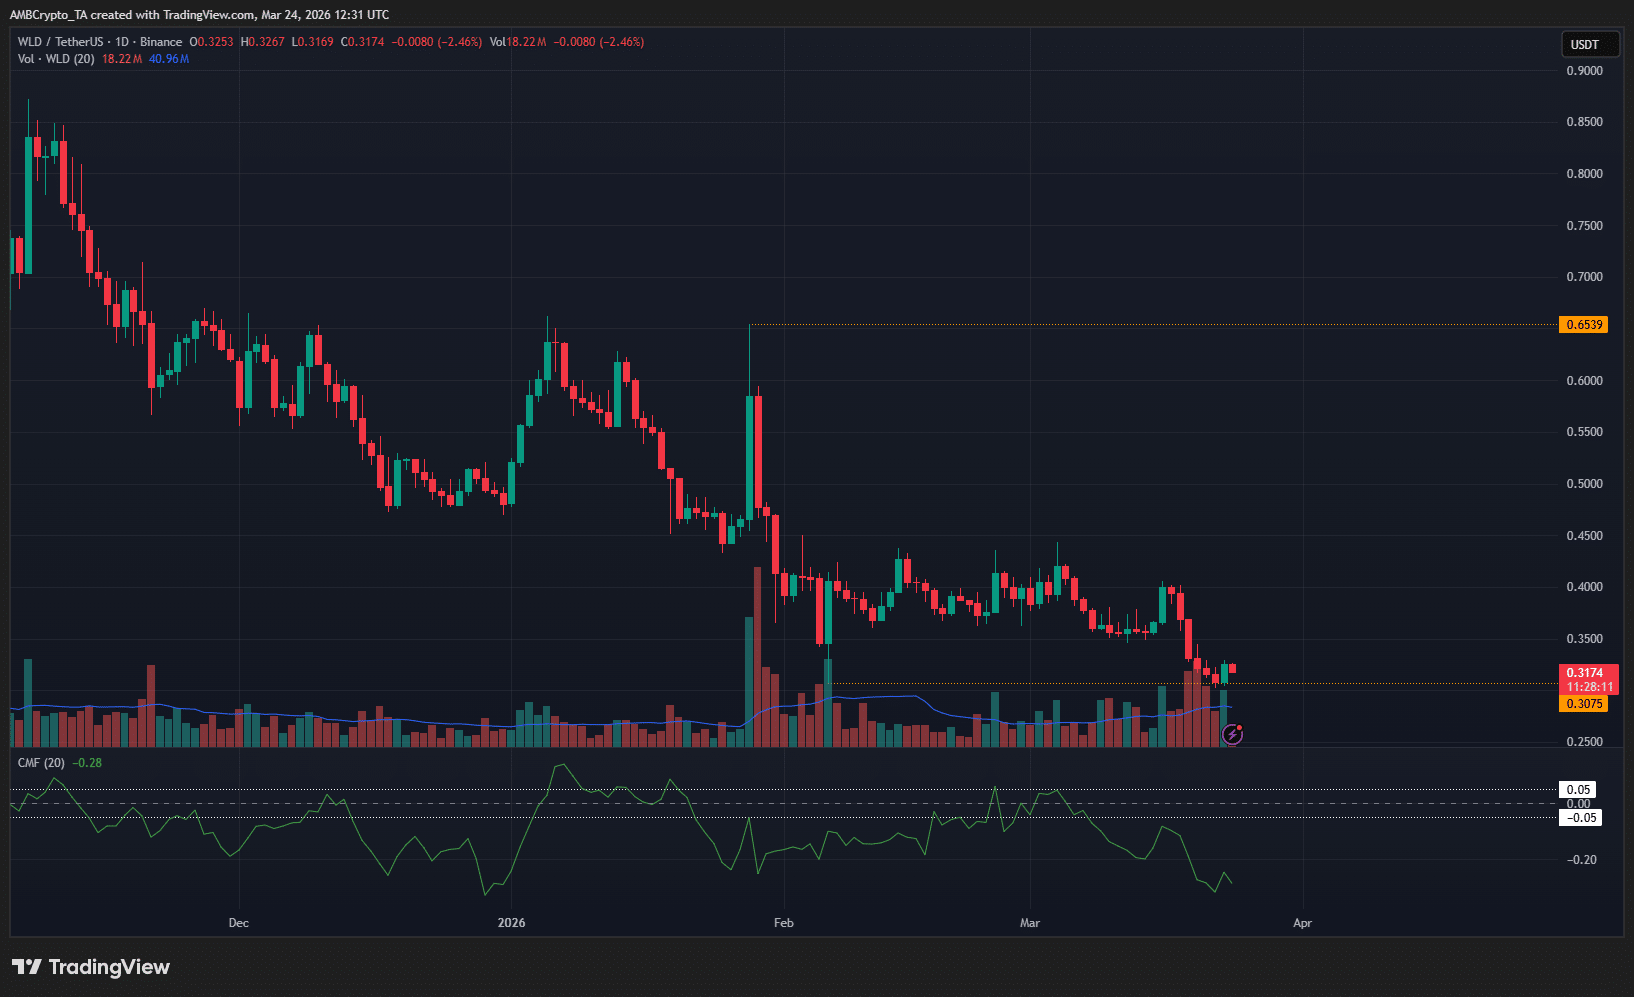
The long-term trend of Worldcoin has been unambiguously bearish. Measured from the day’s open during the 10/10 crash, WLD has shed 73.57% in value in under six months.

By itself, this was not an extraordinary number. Many altcoins have similar and even more severe losses. However, select altcoins have also been able to display short-term bullish strength in March.

The Bitcoin [BTC] push back above the $70k market gave some altcoins the impetus to bounce higher and shift their short-term trends bullishly. Worldcoin was not one of them.

Instead, WLD made new lows on the daily chart. The $0.345 local support from February was breached, and the price plunge was temporarily halted at the extremes of the early February crash.

Traders’ call to action- Sell the bounce

Source: WLD/USDT on TradingView

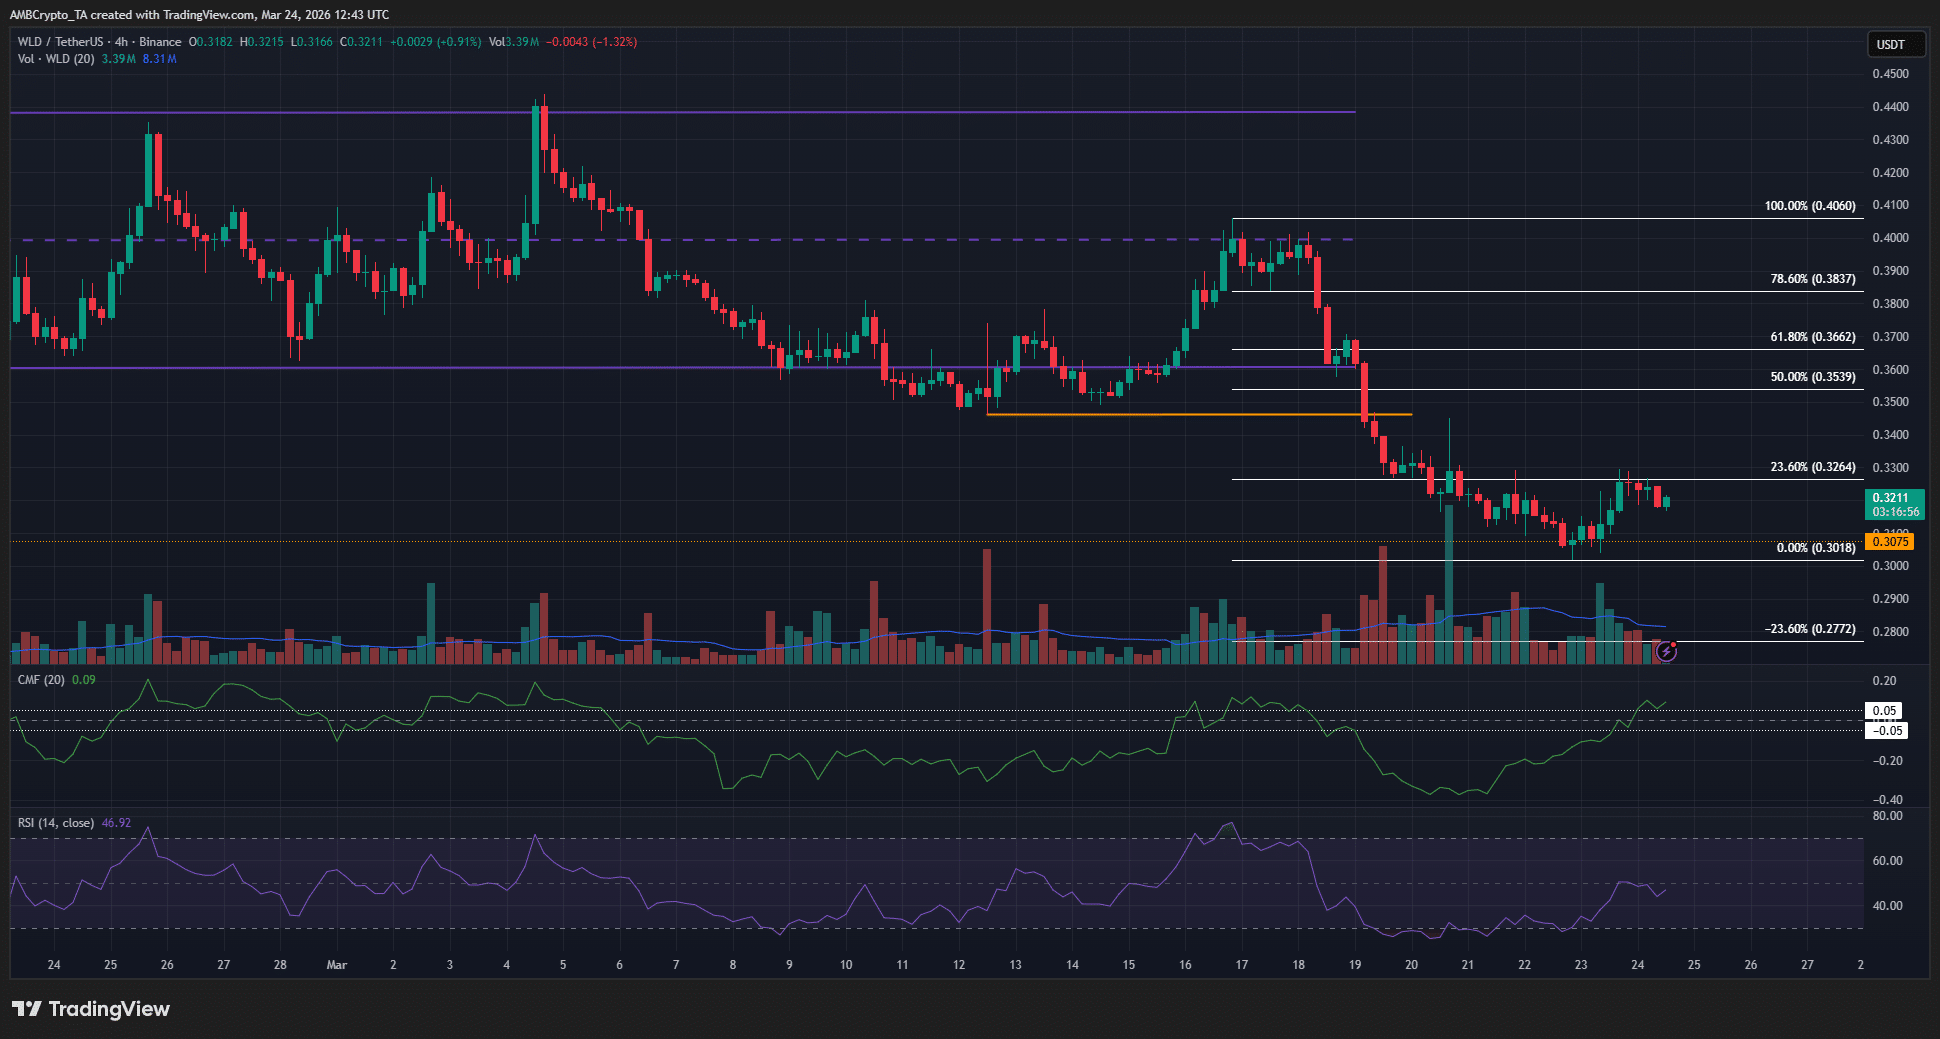
The 4-hour chart showed a bearish swing structure for Worldcoin. This bearish shift occurred on the 19th of March, when WLD fell below the swing low at $0.346.

This impulse move downward was used to plot a set of Fibonacci retracement levels (white). At the time of writing, the 23.6% retracement level at $0.326 was acting as resistance.

If it is flipped to resistance, traders can expect WLD to rally to the golden pocket at $0.354-$0.366.

The RSI was just below neutral 50, and the CMF had succeeded in climbing above +0.05 to indicate strong capital inflows. If demand and momentum are sustained, Worldcoin could bounce higher.

However, traders should remember the longer-term trend of WLD and use the price bounce toward $0.366 to sell the altcoin.

If a rally can break out past the local high at $0.406, the swing structure would be flipped bullishly and invalidate the current bearish bias.


Final Summary

  • The long-term trend of Worldcoin, like Bitcoin and many altcoins, was bearish, but WLD has exhibited relative weakness in recent days.
  • This weakness saw a bearish structural shift on the 4-hour chart, and traders can wait to sell the bounce.

Domande pertinenti

QWhat was the key support level that Worldcoin buyers defended on March 23rd, and what was the resulting price bounce?

ABuyers defended the $0.3075 support level from February 6th, which resulted in an 8.46% bounce from the day's low of $0.3039.

QWhat significant long-term price change has Worldcoin (WLD) experienced since the 10/10 crash?

ASince the 10/10 crash, Worldcoin has lost 73.57% of its value in under six months.

QWhat local support level did Worldcoin recently drop below, and what was the significance of this breach?

AWorldcoin recently dropped below the $0.345 local support level from February. This breach signaled a bearish structural shift and led to new lows on the daily chart.

QAccording to the 4-hour chart analysis, what is the recommended trader action for Worldcoin's current price action?

AThe analysis suggests traders should 'sell the bounce,' using any price rally toward the golden pocket resistance at $0.354-$0.366 as a selling opportunity, given the dominant long-term bearish trend.

QWhat key price level would need to be broken to invalidate the current bearish bias and flip the swing structure to bullish?

AA breakout past the local high at $0.406 would be needed to flip the swing structure bullishly and invalidate the current bearish bias.

Letture associate

From Theory to Countdown: Google Sounds the Blockchain Quantum Resistance Alarm with Zero-Knowledge Proofs

An article discusses the significant threat quantum computing poses to blockchain and classical encryption systems, triggered by Google's recent research. By optimizing Shor's algorithm, Google reduced the logical qubits required to break 256-bit elliptic curve encryption from around 6,000 to just 1,200—slashing computational costs by 20 times. This advancement sets a potential countdown, with Google estimating 2029 as the deadline for upgrading to quantum-resistant cryptography. Both Bitcoin and Ethereum face severe risks. About 25-35% of Bitcoin addresses have exposed public keys, making them vulnerable to attacks, especially during transaction processing. Ethereum’s design exposes public keys upon first use, jeopardizing its entire network if signatures aren’t updated. Historical blockchain data remains permanently available for future quantum attacks. The solution lies in adopting post-quantum cryptography (PQC). Ethereum is already implementing account abstraction and PQC-based signatures, leveraging its upgradeable architecture. Bitcoin is considering BIP-360 to introduce quantum-resistant algorithms like FALCON or CRYSTALS-Dilithium, though consensus may delay action. Notably, Google used zero-knowledge proofs to disclose this threat responsibly, aiming to prevent panic. Collaboration with Ethereum Foundation researchers suggests抗量子 (quantum resistance) could become a major narrative, aligning with crypto’s cryptographic roots.

marsbit3 min fa

From Theory to Countdown: Google Sounds the Blockchain Quantum Resistance Alarm with Zero-Knowledge Proofs

marsbit3 min fa

How is the 'Bottom Structure' of a Bear Market Formed, and Where Are We Now?

This article analyzes the formation of Bitcoin's bear market "bottom structure" by examining the relationship between cost basis and price action, particularly the behavior of short-term holders (STH). Historically, the cost basis of coins held for 1-3 months (1-3m_RP) has acted as a key resistance level during bear market rallies. This group's supply is often less committed; many entered the market expecting quick gains but were trapped. When the price rebounds to their break-even point, they tend to sell, creating resistance. Data shows that as of mid-April, the 1-3m_RP is approximately $75,400, a level Bitcoin is currently testing for the second time this cycle. The first test in mid-January failed, leading to a pullback. The author suggests a high probability of a similar outcome this time, as historical cycles show the second test rarely results in an immediate reversal. An alternative, less likely scenario is a break above this level, only to face stronger resistance at the broader STH-RP (average cost basis for all short-term holders) near $81,000, where a much larger supply of 2.31 million BTC resides. This could lead to price consolidation around the 1-3m_RP. A definitive bottom structure is confirmed only when the 1-3m_RP trend reverses from down to up, signaling a transition from a bear to a bull market. This process takes time, requiring patience to observe whether breakouts are genuine.

marsbit47 min fa

How is the 'Bottom Structure' of a Bear Market Formed, and Where Are We Now?

marsbit47 min fa

Bloomberg Terminal Earns Billions Annually from Data Intermediation, Now 6 Institutions Are Putting Data Directly On-Chain

Six major financial institutions — Fidelity, Euronext, Tradeweb, OTC Markets Group, Singapore Exchange (Forex), and Exchange Data International — have begun publishing proprietary market data directly on-chain via Pyth Network. This move bypasses traditional data intermediaries like Bloomberg, which has long dominated the financial data market with annual revenues of approximately $10 billion from its terminal business alone. The shift enables developers on over 100 blockchains to access high-quality, real-time financial data — including ETF valuations, fixed income data, FX rates, and OTC securities — without long-term contracts, steep fees, or proprietary hardware. This development is critical for the scalability of real-world asset (RWA) tokenization in DeFi, as reliable, institutional-grade data must be available on-chain before assets can be traded or used as collateral in decentralized protocols. Pyth’s model differs from earlier oracle solutions like Chainlink by sourcing data directly from institutional traders and exchanges rather than aggregating from third-party sources. While this approach offers higher speed and accuracy, it also involves a more centralized network of known publishers. The move challenges the decades-old monopoly of data middlemen and could significantly reduce barriers to entry for developers building DeFi products tied to traditional financial markets.

marsbit52 min fa

Bloomberg Terminal Earns Billions Annually from Data Intermediation, Now 6 Institutions Are Putting Data Directly On-Chain

marsbit52 min fa

Trading

Spot
Futures

Articoli Popolari

Come comprare WLD

Benvenuto in HTX.com! Abbiamo reso l'acquisto di Worldcoin (WLD) semplice e conveniente. Segui la nostra guida passo passo per intraprendere il tuo viaggio nel mondo delle criptovalute.Step 1: Crea il tuo Account HTXUsa la tua email o numero di telefono per registrarti il tuo account gratuito su HTX. Vivi un'esperienza facile e sblocca tutte le funzionalità,Crea il mio accountStep 2: Vai in Acquista crypto e seleziona il tuo metodo di pagamentoCarta di credito/debito: utilizza la tua Visa o Mastercard per acquistare immediatamente WorldcoinWLD.Bilancio: Usa i fondi dal bilancio del tuo account HTX per fare trading senza problemi.Terze parti: abbiamo aggiunto metodi di pagamento molto utilizzati come Google Pay e Apple Pay per maggiore comodità.P2P: Fai trading direttamente con altri utenti HTX.Over-the-Counter (OTC): Offriamo servizi su misura e tassi di cambio competitivi per i trader.Step 3: Conserva Worldcoin (WLD)Dopo aver acquistato Worldcoin (WLD), conserva nel tuo account HTX. In alternativa, puoi inviare tramite trasferimento blockchain o scambiare per altre criptovalute.Step 4: Scambia Worldcoin (WLD)Scambia facilmente Worldcoin (WLD) nel mercato spot di HTX. Accedi al tuo account, seleziona la tua coppia di trading, esegui le tue operazioni e monitora in tempo reale. Offriamo un'esperienza user-friendly sia per chi ha appena iniziato che per i trader più esperti.

145 Totale visualizzazioniPubblicato il 2024.12.11Aggiornato il 2025.03.21

Come comprare WLD

Discussioni

Benvenuto nella Community HTX. Qui puoi rimanere informato sugli ultimi sviluppi della piattaforma e accedere ad approfondimenti esperti sul mercato. Le opinioni degli utenti sul prezzo di WLD WLD sono presentate come di seguito.

活动图片