Trader's Practical Guide: Avoiding 'Catching Falling Knives' - A Bottom-Fishing Methodology Integrating Fundamentals, Technicals, and Sentiment

marsbitPubblicato 2026-01-23Pubblicato ultima volta 2026-01-23

Introduzione

This guide outlines a systematic framework for buying stocks at their bottom, integrating fundamental, technical, and sentiment analysis to avoid premature buying ("catching a falling knife"). The process begins by identifying the catalyst for a stock's decline and assessing whether it's a temporary issue or a fundamental break in the investment thesis. A thorough fundamental review using the "4M" framework (Business Model, Moat, Management, Margin of Safety) and conservative DCF valuation is essential. Technically, patience is key; wait for signs of seller exhaustion. Strategies include buying on the right side of a V-shaped reversal, after a 5-day EMA crosses above the 20-day EMA, near long-term support levels, or after a base forms at least 5% above 52-week lows. Riskier "waterfall decline" entries require careful scaling-in. Sentiment analysis acts as a contrarian indicator. Extreme pessimism, such as drastically lowered price targets or widespread capitulation from retail investors, can signal a potential bottom. Combining these elements creates a disciplined approach to identify high-probability entry points with a margin of safety.

Author: SixSigmaCapital

Compiled by: Yuliya, PANews

This article aims to summarize a set of procedures for buying at stock price bottoms, detailing practical experiences and lessons learned, and establishing a sustainable framework for identification and execution. It is recommended that investors combine this strategy with other investment philosophies to gain a more comprehensive understanding of the market.

Initial Analysis and Catalyst Tracking

When a stock an investor is interested in begins to decline, close attention should be paid. Identify any upcoming catalysts, whether positive or negative. If there are no clear catalysts, it usually means the investor has more time for analysis.

At this point, the key is to figure out the reason for the stock's decline: is it a company-specific issue or an industry-wide problem? Is the price decline reasonable, or is the market over-penalizing? Is this a temporary problem, or one that fundamentally alters the original investment thesis? If the reason for the decline does not break the initial investment logic, then you can move to the next steps for a more thorough consideration of this investment opportunity.

Fundamental Due Diligence

It is essential to complete fundamental research as early as possible. The classic "4M Framework" is an effective tool, consisting of four dimensions:

  • Business Model (Meaning): What business the company is specifically in.

  • Moat: What competitive advantages the company possesses.

  • Management: The capability and integrity of the management team.

  • Margin of Safety: Whether the current stock price provides a sufficient margin of safety.

It is recommended that investors carefully review the company's financial filings and familiarize themselves with its three main financial statements (Income Statement, Balance Sheet, Cash Flow Statement). Attention should also be paid to earnings call transcripts. If using a DCF (Discounted Cash Flow) model for valuation, be sure to use conservative estimates to determine the stock's intrinsic value. This ensures that when the time comes, the investor knows clearly they are buying at a significant discount.

Incorporating Technical Analysis

Do not bottom-fish too early; patience is key. Ideally, an investor should aim to be among the last to buy the bottom. This is crucial because it allows time to study prior price action and wait for selling pressure to gradually exhaust itself. It is recommended to study charts across multiple timeframes; daily and weekly charts are good starting points.

Here are several technical analysis methods that can be used individually or in combination:

  • Buying on the "right side" of a V-shaped reversal

  • Waiting for the 5-period EMA (Exponential Moving Average) to cross above the 20-period EMA

  • Buying at long-established support levels

  • Waiting for the stock to base build after holding at least 5% above the 52-week low before initiating a tentative buy

  • Buying during a "waterfall decline" (this method is higher risk)

The application of these methods is illustrated below with some case studies.

1. Buying on the "Right Side" of a V-Shaped Reversal

This is a relatively simple strategy: first, determine an ideal price you are willing to pay, then patiently wait for the stock to stop falling. When the price rebounds and rises back to that level, you can execute the trade. This is a higher-probability entry method and allows you to place a stop-loss near the recent low to protect the position.

2. Exponential Moving Average Crossover

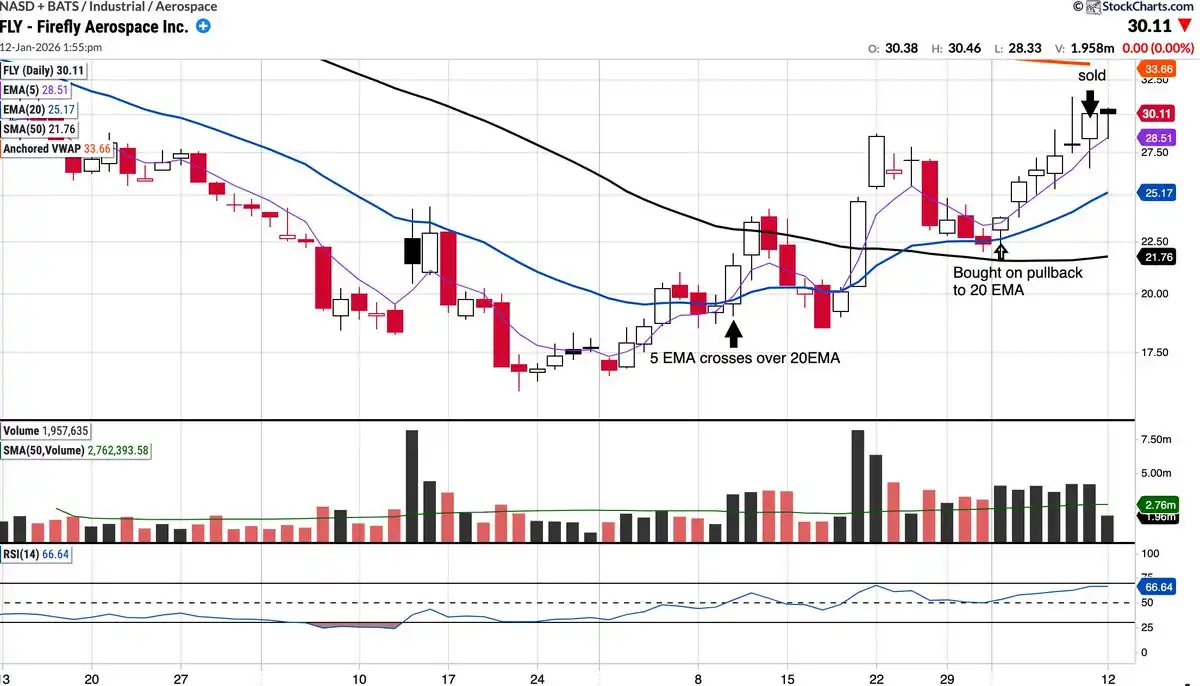
Waiting for the 5-period EMA to cross above the 20-period EMA is a straightforward strategy. The core idea is to wait for a potential trend reversal confirmation signal before committing any capital.

Take the recent FLY trade as an example. The stock had initially caught the investor's attention, but a buy was initiated only after waiting for the 5-day EMA to cross above and hold above the 20-day EMA, entering on a pullback to test the 20-day EMA. This trade ultimately proved successful, yielding a gain of about 35% to 36% over approximately six trading days.
3. Base Building (Basing)

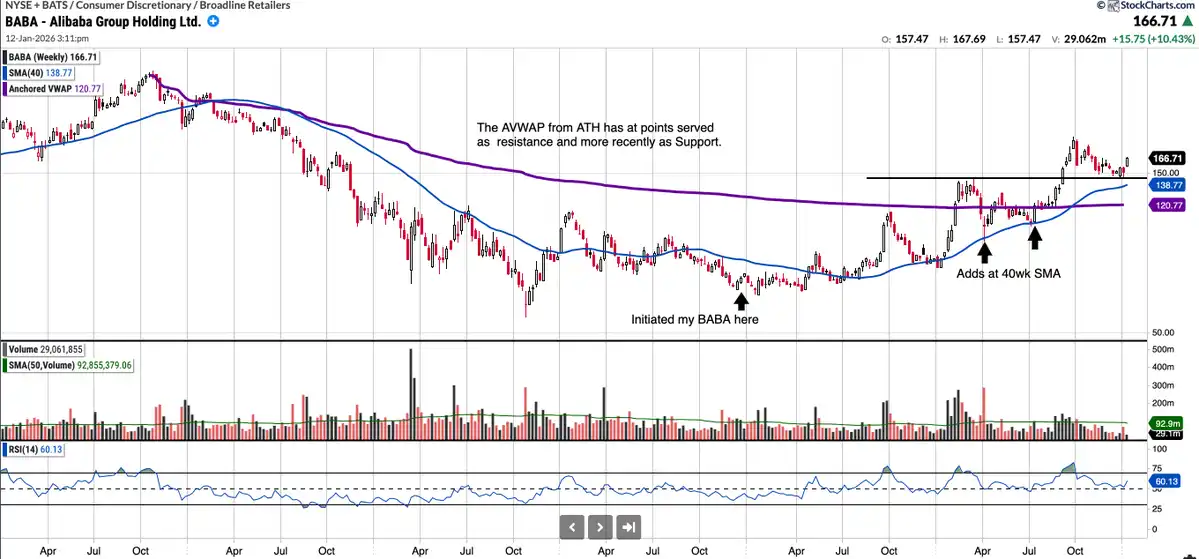
Waiting for a stock to hold and start building a base above its 52-week low (e.g., at least 5% above the low) is another recommended strategy. The reason is simple: investors need to see evidence that the price is likely to hold the previous low and that a trend change might be occurring.

Looking back to 2023, BABA is a good example. Although the stock had bottomed at $55 per share the previous year, an investor chose to enter in December 2023 when the price was between $68 and $70. At that time, the stock was basing, and there was a significant dislocation between price and value, with a P/E ratio of only 7. Later, the investor added to the position when the price pulled back to test the 40-week SMA (Simple Moving Average) and still holds these shares to this day.
4. Waterfall Decline

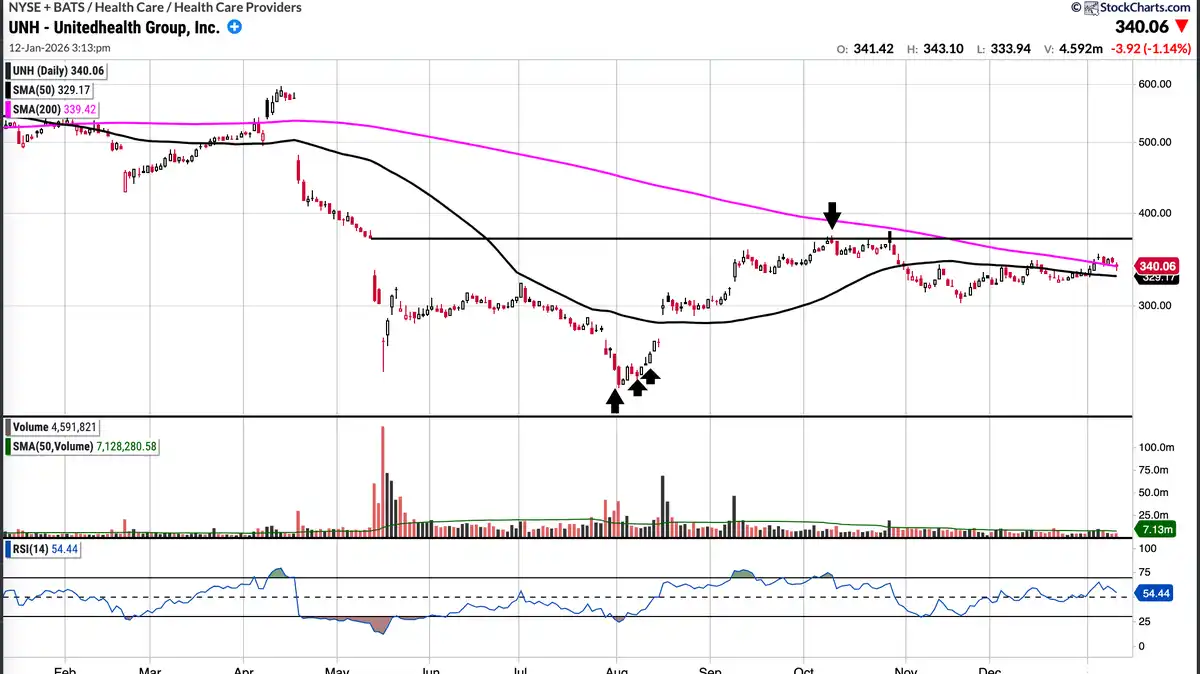
UNH is a case study for trading a "waterfall decline." This is a higher-risk setup, but the risk can be managed by combining the principle of "delayed buying" (waiting for sellers to diminish) and adding on the "right side" of the V-shaped reversal.

When UNH's stock price first declined in mid-May, it entered the investor's watchlist but was not bought immediately. The massive selling volume at the time was enough to cause hesitation. However, after completing fundamental analysis, $240 was marked from a valuation perspective as a level worth considering for a buy. When the price began to fall rapidly in August, buying operations commenced. Buys were made in batches as the price began to recover, in the range of the $230s to $240s. Finally, the position was closed out after the gap was filled in mid-October.
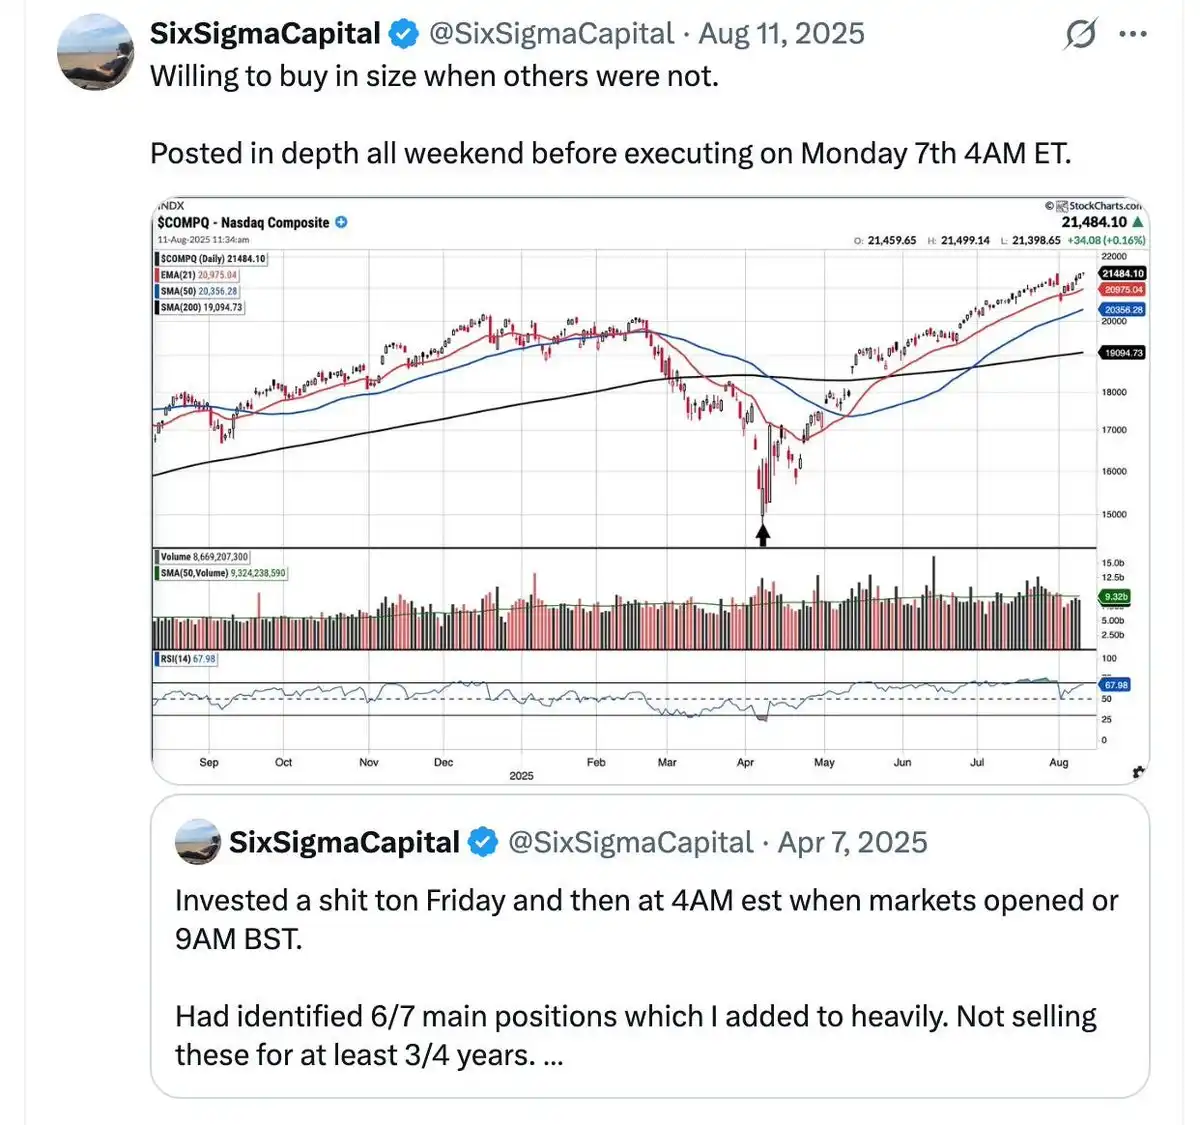
Another successful case of buying a waterfall decline was catching the bottom on April 7, 2025. Deep analysis was conducted throughout the weekend before executing the trade at 4 AM ET that Monday morning.
Sentiment Analysis

Tracking market sentiment is another crucial piece of the decision-making puzzle. Although it is not an exact science, there are several specific methods to incorporate it into the analysis process.

As mentioned before, it is not advisable to buy when the general public is bottom-fishing. Instead, one should look for entry points when early buyers have become frustrated and finally capitulated. An important signal is when extremely pessimistic price targets start circulating in the market, or when investors who are "all-in" on a single stock sell their positions out of despair. Typical examples include the crash Tesla experienced when its stock fell to $150 in April 2024, and the widespread belief at the time that Google was "destined to fail" in artificial intelligence.

Furthermore, waiting for analysts to lower their expectations and price targets is also an effective strategy. This process often reduces risk; once market expectations are lowered, the company only needs to achieve a small beat to potentially trigger a positive stock reaction.

Finally, if you have a following on social media, you can use them to gauge current market sentiment. For example, you can test sentiment by posting something like: "I bought UNH at $237, am I screwed?" If the post gets unusually high engagement and the replies are overwhelmingly bearish, even with some calling for prices below $100, such extreme pessimism can be seen as a good contrarian indicator.


Domande pertinenti

QWhat is the four-dimensional framework mentioned for fundamental due diligence?

AThe four-dimensional framework is the '4M Framework', which includes: 1. Meaning (What business the company is in), 2. Moat (The company's competitive advantages), 3. Management (The capability and integrity of the management team), and 4. Margin of Safety (Whether the current stock price provides a sufficient margin of safety).

QAccording to the article, what is a key technical analysis strategy for entering a position after a 'V-shaped reversal'?

AThe key strategy is to buy on the 'right side' of the V-shaped reversal. This involves first identifying an ideal price you are willing to pay, then waiting for the stock to stop falling. When the price rebounds and rises back to that level, you can execute the trade, allowing you to set a stop-loss near the recent low.

QHow does the article suggest using market sentiment as a contrarian indicator?

AThe article suggests looking for extreme pessimism as a contrarian indicator. This includes when extremely bearish price targets are circulating, when 'all-in' investors sell out of desperation, or when analyst expectations and price targets are downgraded. It also mentions gauging sentiment through social media, where a high volume of bearish replies to a post about a purchase can signal a potential buying opportunity.

QWhat is the recommended approach for buying during a 'waterfall decline' to manage risk?

AThe recommended approach for a 'waterfall decline' is to manage risk by combining the principle of 'delayed buying' (waiting for selling pressure to subside) with adding to the position on the 'right side' of a V-shaped rebound. This avoids buying into the initial, high-volume selloff and instead focuses on entering as the price begins to recover.

QWhy does the article emphasize the importance of identifying the catalyst for a stock's decline?

AIdentifying the catalyst is crucial to determine if the price drop is due to a company-specific issue or a broader industry problem, and to assess whether it is a temporary setback or a fundamental change that breaks the original investment thesis. This analysis helps investors decide if the sell-off is an overreaction and if the opportunity warrants further investigation.

Letture associate

Cardano Price Forecast for August 2026: Will ADA Triangle Breakout Happen Before or After the CLARITY Act Deadline?

Cardano (ADA) is trading at $0.1642, testing the apex of a symmetrical triangle pattern on the daily chart, which signals an impending directional move. Technical analysis identifies key resistance at the 20-day EMA ($0.1650) and the triangle's upper trendline. A breakout above could target the 50-day EMA at $0.1732, with a cup-and-handle pattern potentially forming. Support lies at the SuperTrend indicator ($0.1536) and the June low of $0.1386. Historically, August has been a weak month for ADA, with a median return of -12.8%. A weekly forecast outlines a volatile month influenced by the imminent August 8th deadline for the U.S. CLARITY Act vote, potential SEC regulatory action, and renewed geopolitical tensions following Iran's missile strike. Key bullish catalysts include the potential passage of the CLARITY Act and a major upgrade integrating Cardano's developer documentation and tools into AI coding assistants like Claude, which could significantly boost developer adoption. On-chain data also shows whale accumulation, a potential Wyckoff accumulation signal. The price forecast presents two scenarios: a bullish breakout above $0.1650 targeting $0.17-$0.1732 if the CLARITY Act passes and AI integration fuels momentum, or a bearish break below $0.1536 toward $0.1386 if the bill fails, seasonal weakness persists, and risk appetite diminishes.

cryptonews.ru9 min fa

Cardano Price Forecast for August 2026: Will ADA Triangle Breakout Happen Before or After the CLARITY Act Deadline?

cryptonews.ru9 min fa

Coinbase Vice President: The Wars Over Cryptocurrency Regulation Are Over

Coinbase's new Vice President, Ryan VanGrak, declared that regulatory wars in the cryptocurrency sector are over. Since taking office on July 9, 2026, he has shifted the company's approach from litigation and sanctions to focusing on growth and innovation. The industry can now concentrate on development rather than fighting for its right to exist. He highlighted that the Digital Asset Market Clarity Act (CLARITY Act), which aims to establish a clear federal regulatory framework dividing oversight between the SEC and CFTC, has gained significant momentum. This framework is intended to provide proper supervision, investor protection, and maintain U.S. leadership in digital assets. VanGrak's appointment marks a strategic shift from a "wartime" to a "peacetime" advisor, replacing former Chief Legal Officer Paul Grewal, who oversaw major litigation, including a dismissed 2023 SEC lawsuit. With his background at Citadel Securities and the SEC, VanGrak brings deep regulatory and institutional finance expertise as Coinbase expands beyond a simple exchange into a broader financial services provider, offering stocks, futures, prediction markets, and AI tools. For investors, bipartisan support for crypto legislation like the CLARITY Act represents a major shift from the enforcement-focused environment of 2023-2024. Lawmakers are now focused on *how* to regulate crypto, not *if* it should exist. However, risks remain, as the bill's passage is not yet guaranteed.

cryptonews.ru1 h fa

Coinbase Vice President: The Wars Over Cryptocurrency Regulation Are Over

cryptonews.ru1 h fa

Deep Dive into FWA: An Intriguing Experiment Turning NFTs into "On-Chain Gachapon"

A Deep Dive into FWA: The “On-Chain Gacha” Experiment for NFTs Fake World Assets (FWA), created by TokenWorks, introduces an innovative “NFT gacha machine” fully operating on-chain. Users can deposit eligible NFTs paired with ETH (called Backing) to create a Position, acting as a prize pool. Others can then pay a uniform Acquisition Price for a chance to win a random NFT from the pool. The core mechanism features a reverse probability system: Positions with lower Backing have a higher chance of being selected, serving as common prizes, while high-Backing Positions are rare “jackpots.” The acquisition price is calculated based on the harmonic mean of all Backings, keeping entry costs low. When a Position is won, the purchaser must choose: keep the NFT or accept the Standing Bid (85% of the Backing, claimable in ETH or $FWA tokens), returning the NFT to the original depositor. The protocol involves two main roles. Depositors provide liquidity (NFT + ETH), earning a share of fees from each draw, distributed equally per active Position, plus potential $FWA rewards. Purchasers pay to spin the gacha, receiving $FWA rewards for participation. A special “Crown” reward goes to the Position with the highest Backing. The $FWA token has a fixed supply and is initially obtainable only through protocol participation (depositing or purchasing), with external buying disabled early on to reduce sell pressure. Its value is supported by a built-in buy pressure: when purchasers opt for the $FWA settlement on a Standing Bid, the protocol uses the backing ETH to buy $FWA from the market. Revenue for the protocol comes from a 1% fee on each draw, a 1% settlement fee when an NFT is kept, and the 15% discount from Standing Bid settlements (currently allocated to the protocol). The design cleverly blends Uniswap-style liquidity provision, gacha mechanics, and tokenomics to create a novel, self-regulating marketplace for NFT liquidity and engagement.

marsbit1 h fa

Deep Dive into FWA: An Intriguing Experiment Turning NFTs into "On-Chain Gachapon"

marsbit1 h fa

Trading

Spot
活动图片