Tracking Volatility Regimes: Gamma Exposure Heatmap

insights.glassnodePubblicato 2026-02-24Pubblicato ultima volta 2026-02-24

Introduzione

Glassnode introduces a new Gamma Exposure (GEX) Strike Heatmap, a proprietary tool designed to track how dealer hedging flows influence crypto market volatility over time. Unlike static snapshots, this visualization shows how gamma exposure shifts across strike prices as markets move, helping traders identify volatility regimes are likely to change. GEX measures whether dealers are net long (positive GEX) or short (negative GEX) gamma. Positive GEX acts as a volatility dampener, leading to range-bound conditions, while negative GEX accelerates price moves, often causing liquidity cascades. The heatmap reveals key features like persistent positive gamma “walls” that stabilize price and expanding negative zones that signal potential breakouts. An accompanying chart tracks total GEX over time, indicating whether the market is in a high or low volatility regime based on dealer positioning. Available for BTC, ETH, XRP, and SOL in Glassnode Studio, this tool offers systematic and discretionary traders deeper insight into how options flows affect short-term price action.

As crypto options markets continue to grow, dealer hedging flows are becoming a more relevant driver of short-term price behavior. Knowing where those flows may absorb movement or reinforce it can materially improve volatility context.

Building on our foundational work in gamma exposure, Glassnode is proud to introduce a sophisticated new metric: the Gamma Exposure (GEX) Strike Heatmap.

Unlike a single snapshot view, this feature tracks the distribution of gamma exposure across strike levels over time, showing how dealer positioning shifts as the market moves.

This is a proprietary visualization methodology available exclusively on Glassnode, designed to give systematic traders and volatility professionals a temporal edge in understanding how options positioning influences price action.

Explore the live metrics in Glassnode Studio. Now available for BTC, ETH, XRP, and SOL to all Professional plan users.

Visit metrics

What is Gamma Exposure and Why it Matters

Gamma Exposure (GEX) measures how options dealers' hedging flows respond to price movements. When markets move, option deltas shift (this is gamma), forcing dealers to rebalance their positions by trading futures or spot. These flows create structural feedback loops that either dampen or amplify price action.

  • Long Gamma (Positive GEX): When dealers are net long options, they act as volatility dampeners. To stay neutral, they must sell as prices rise and buy as prices fall. This counter-cyclical trading creates resistance to large moves, often resulting in a "rangy" or stable price action.
  • Short Gamma (Negative GEX): When dealers are net short options, they act as volatility accelerators. To stay neutral, they must buy as prices rise and sell as prices fall. This pro-cyclical trading adds fuel to the fire, turning small moves into liquidity cascades.

We have developed an internal methodology to estimate dealer gamma exposure using a taker-flow approach. For a detailed explanation, refer to this article.

Why the Gamma Exposure Heatmap?

Most gamma dashboards in the industry show only a single snapshot in time. A current GEX snapshot tells you where dealer hedging pressure exists right now, but it doesn’t show how that pressure shifts. And markets are dynamic.

As price moves:

  • Strikes that are heavily gamma-positive today can fall out of the money tomorrow;
  • New gamma concentrations emerge;
  • Gamma “walls” strengthen or weaken as open interest builds or decays.

As time passes:

  • Expirations cause GEX to collapse or redistribute.

The GEX Strike Heatmap captures these changes, showing how GEX evolves.

Visit Live Chart

Gamma Exposure Heatmap Case Study

The GEX Heatmap provides a clear narrative of market sentiment that spot price alone cannot convey.

Persistent positive bands (green):

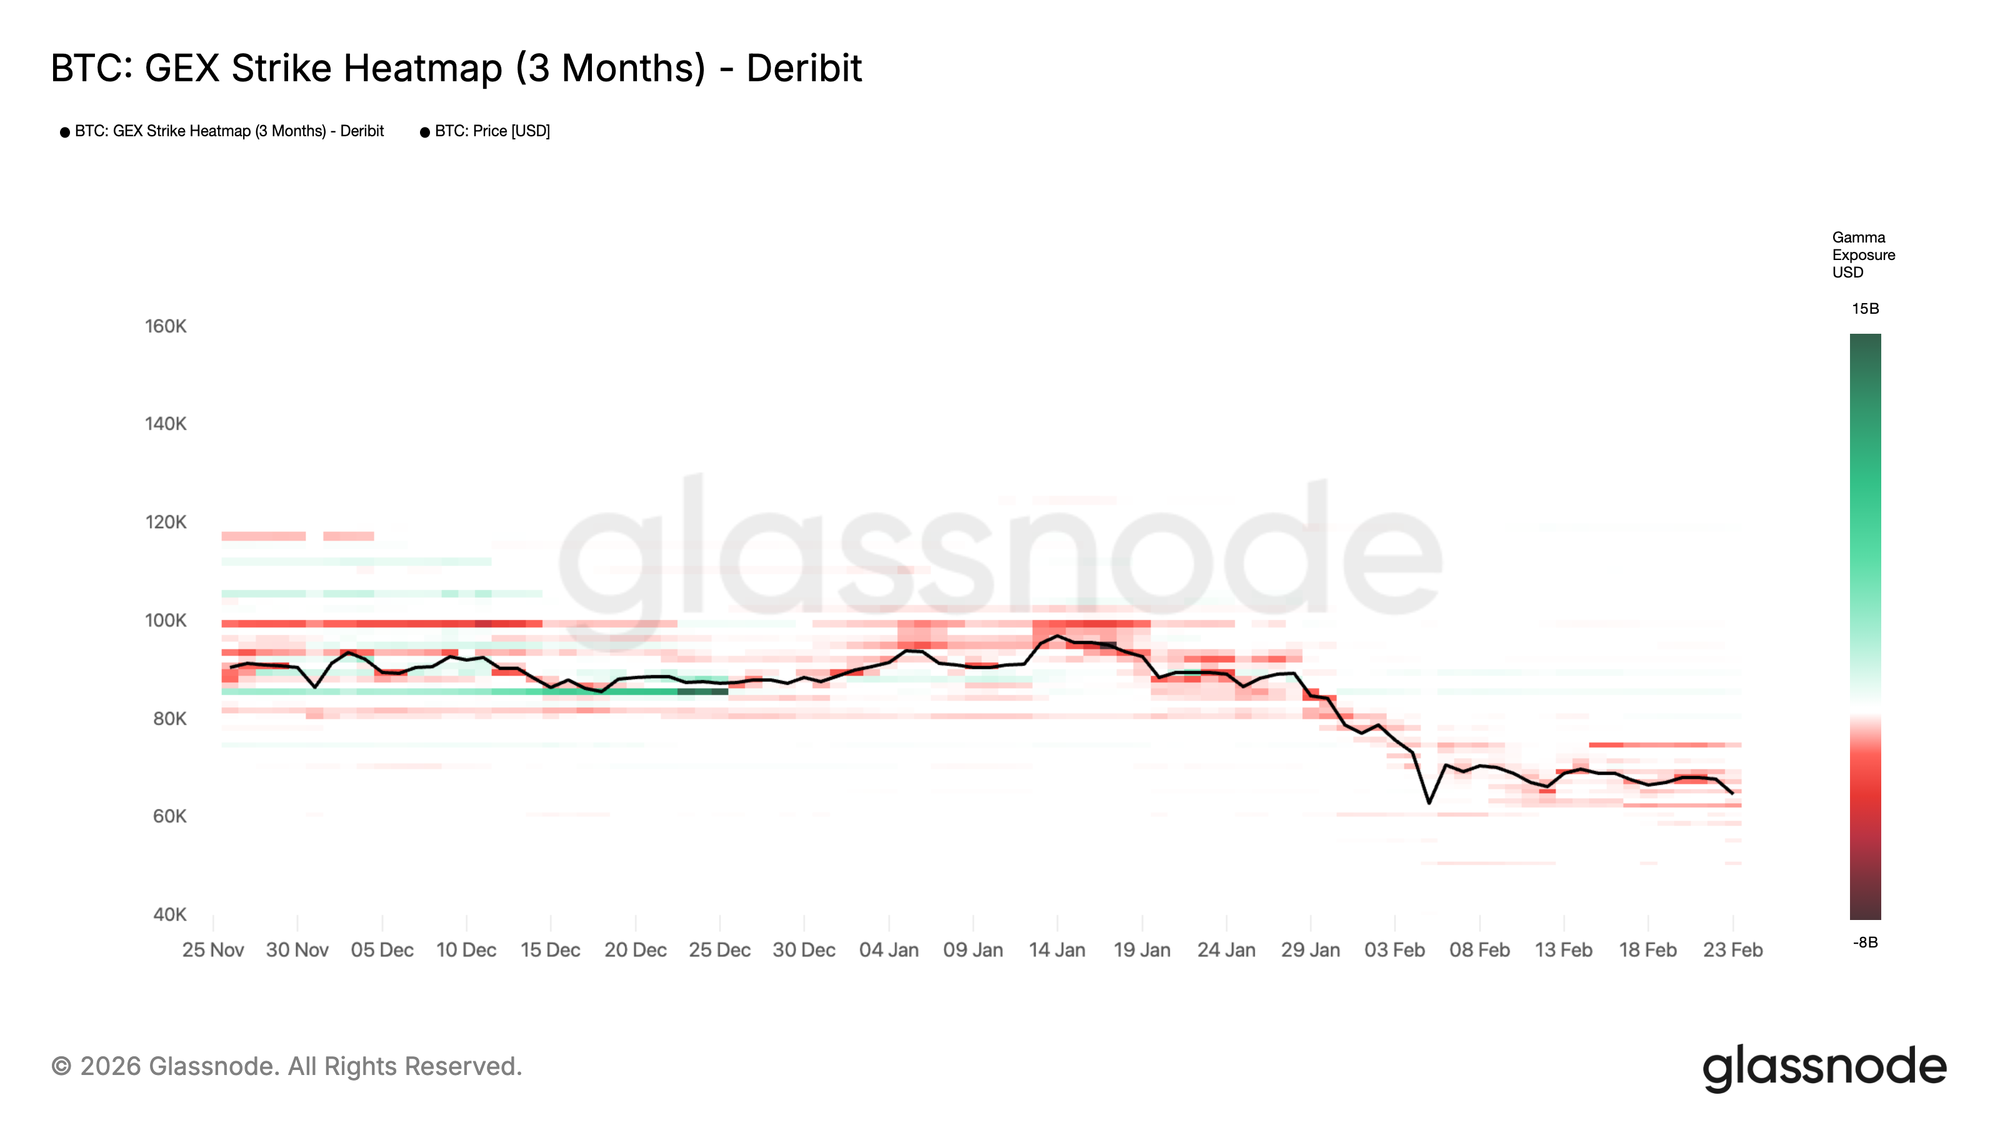
In the heatmap above, distinct green horizontal bands around 85k mid-December 2025 acted as gamma “walls”. These are price levels where dealers are heavily incentivized to suppress volatility. As long as price remains pinned here, we expect choppy, range-bound conditions.

What to look for:

  • Width of the band: Wider bands suggest a broader range of strikes with positive GEX, indicating a larger stabilization zone;
  • Duration: Bands that persist over days/weeks are more structurally significant than fleeting concentrations;
  • Proximity to spot: When price trades within a positive band, expect choppy, range-bound conditions.

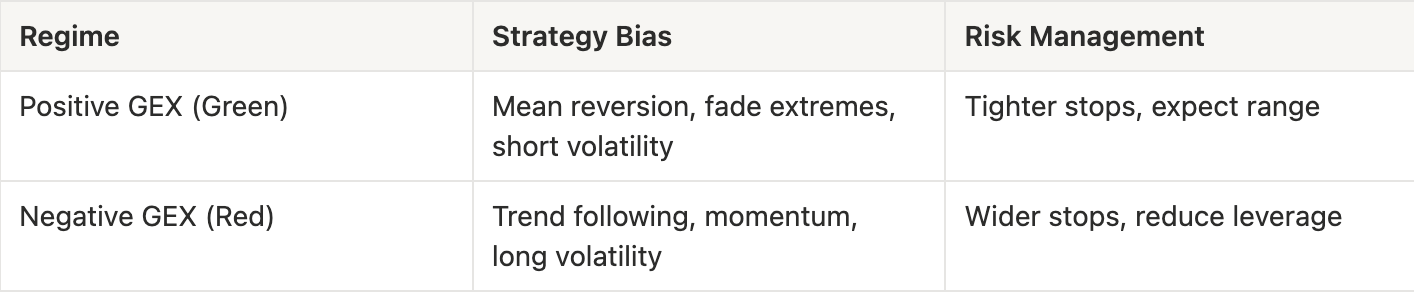
Trading implications: Mean-reversion strategies tend to work well. Fading rallies and buying dips into these zones aligns with dealer hedging flows. Breakout attempts often fail or produce false breaks.

Expanding negative zones (red):

In the recent down-leg (January-February 2026), the heatmap shifts toward stronger red bands around and below spot, while aggregate GEX turns more negative. This is consistent with a short-gamma environment, where hedging flows can reinforce downside pressure and volatility expansion.

What to look for:

  • Negative zones approaching spot: This is a warning sign for volatility expansion;
  • Increasing intensity (darker red): Growing short gamma concentration amplifies the potential for acceleration;
  • Negative zone below support levels: If price breaks into these zones, hedging flows will reinforce downside.

Trading implications: Reduce leverage, widen stops, or position for momentum trades. Mean-reversion becomes riskier. This environment favors trend-following and volatility-long positions.

Total GEX Over Time: A Volatility Lens

While the strike heatmap reveals where GEX concentrates, a natural question emerges: What is the net positioning across all strikes? Is the market, on aggregate, in a long-gamma or short-gamma regime? This is where Total GEX Over Time completes the picture.

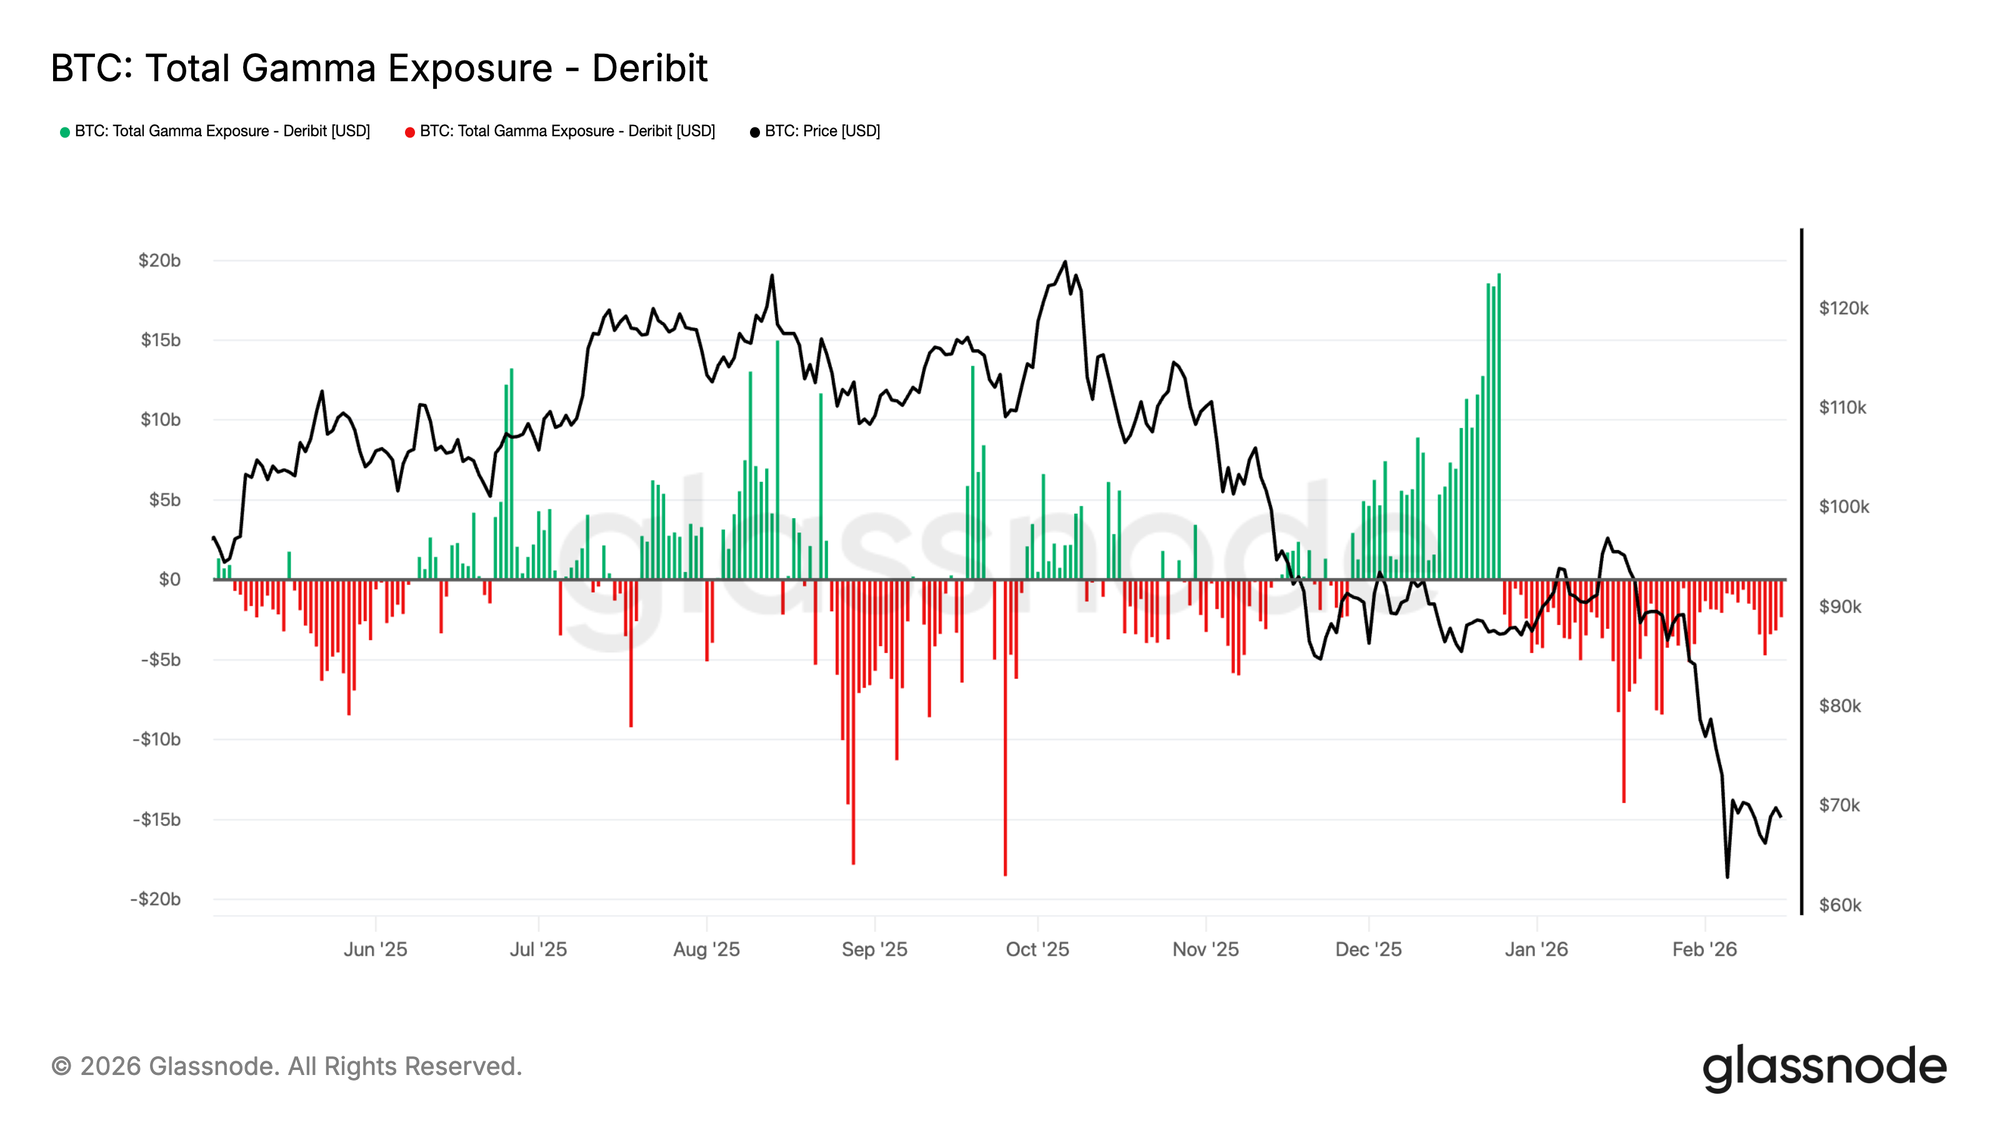
Total GEX Over Time shows whether market-makers are net long or short gamma, serving as a critical regime indicator. In the chart below, we can clearly observe Bitcoin's aggregate gamma exposure evolution. Green bars represent positive total GEX (market-makers net long gamma), red bars represent negative total GEX (market-makers net short gamma), overlaid with spot price.

This gives a high-level regime read:

  • Positive regime (green): When total GEX is strongly positive, dealer hedging flows are net stabilizing. The market tends toward lower realized volatility, with hedging flows absorbing shocks. This often coincides with consolidation phases or range-bound trading.
  • Negative regime (red): When total GEX is negative, dealer flows amplify moves. Realized volatility tends to expand, breakouts become more decisive, and price can "gap" through levels more easily.
  • Regime transitions: The moments when total GEX crosses zero, flipping from positive to negative or vice versa, often mark inflection points in volatility behavior. These transitions can precede breakouts, sudden volatility expansions, or the establishment of new trading ranges.
Visit Live Chart

Interpreting the Chart

Looking at the example above, we see:

  1. August-November 2025: Predominantly negative GEX (red) corresponds with the price decline from 120k to ~80k, indicating amplifying dealer flows that reinforced downward momentum.
  2. December 2025-January 2026: Shift toward positive GEX (green) as price bottomed and consolidated, showing stabilizing flows that supported range formation.
  3. Late January 2026: Return to negative GEX during renewed weakness, suggesting the market remained structurally positioned for volatility expansion.

Conclusion

Whether you are a discretionary trader looking for sticky support levels, or a systematic fund utilizing our API to detect volatility regimes, the GEX Strike Heatmap provides a new dimension of market clarity. By visualizing the changing landscape of dealer incentives, you can better identify when the market is primed to consolidate, and when it is ready to explode.

If you want to learn more about our options data and metric offer, or gain access to these metrics, contact our dedicated team today.


  • Follow us on X for timely market updates and analysis
  • Join our Telegram channel for regular market insights
  • For on-chain metrics, dashboards, and alerts, visit Glassnode Studio

Disclaimer: This report is for informational and educational purposes only. The analysis represents a limited case study with significant constraints and should not be interpreted as investment advice or definitive trading signals. Past performance patterns do not guarantee future results. Always conduct thorough due diligence and consider multiple factors before making investment decisions.

Domande pertinenti

QWhat is Gamma Exposure (GEX) and how does it influence market volatility?

AGamma Exposure (GEX) measures how options dealers' hedging flows respond to price movements. When dealers are net long options (positive GEX), they act as volatility dampeners by selling as prices rise and buying as prices fall, creating stable price action. When dealers are net short options (negative GEX), they act as volatility accelerators by buying as prices rise and selling as prices fall, amplifying price movements and potentially causing liquidity cascades.

QHow does the Gamma Exposure Strike Heatmap differ from traditional gamma dashboards?

ATraditional gamma dashboards show only a single snapshot of gamma exposure at a specific time, while the Gamma Exposure Strike Heatmap tracks the distribution of gamma exposure across strike levels over time. This allows traders to see how dealer positioning shifts as the market moves, including how gamma concentrations emerge, strengthen, weaken, or expire, providing a dynamic view of market structure.

QWhat do persistent green bands on the Gamma Exposure Heatmap indicate?

APersistent green bands on the heatmap indicate gamma 'walls' where dealers are heavily incentivized to suppress volatility. These bands suggest price levels where choppy, range-bound conditions are expected. Key characteristics to note include the width of the band (indicating the size of the stabilization zone), its duration (longer persistence means greater structural significance), and proximity to spot price.

QWhat trading implications are associated with expanding red zones on the heatmap?

AExpanding red zones indicate a short-gamma environment where dealer hedging flows can reinforce downside pressure and volatility expansion. In such conditions, traders should reduce leverage, widen stops, or position for momentum trades. Mean-reversion strategies become riskier, while trend-following and volatility-long positions are favored. Negative zones approaching spot price or below support levels are particularly significant warning signs.

QHow does Total GEX Over Time function as a volatility regime indicator?

ATotal GEX Over Time shows whether market-makers are net long or short gamma across all strikes, serving as a critical regime indicator. Positive total GEX (green) indicates a stabilizing regime with lower realized volatility and shock-absorbing flows, often during consolidation phases. Negative total GEX (red) indicates an amplifying regime with expanded realized volatility and more decisive breakouts. Transitions between these regimes often mark inflection points in market volatility behavior.

Letture associate

Has Hook Summer Really Arrived? sato, Lo0p, FLOOD Ignite the New Narrative of Uniswap v4

"Hook Summer" Arrives? Sato, Lo0p, FLOOD Ignite Uniswap v4 Narrative Amidst a slight market recovery, attention within the Ethereum ecosystem has shifted to Meme coins built on Uniswap v4's Hook protocol. Following ASTEROID, tokens like sato, sat1, Lo0p, and FLOOD have become market focal points, with market caps ranging from millions to tens of millions, bringing concentrated liquidity to a narrative-dry market. Uniswap v4 Hooks are "plugin smart contracts" that allow developers to inject custom logic at key points in a liquidity pool's lifecycle (initialization, adding/removing liquidity, swaps, etc.), making the AMM programmable. Recent representative projects include: * **sato**: Market cap peaked over $38M; uses a v4 curve mechanism for minting/burning, locking ETH as reserve. * **sat1**: Market cap briefly exceeded $10M, positioning as an "optimized sato," but later declined significantly. * **Lo0p**: Market cap neared $6.6M; a "lending AMM protocol" allowing users to borrow ETH against deposited LO0P tokens without immediate selling pressure. * **FLOOD**: Market cap approached $6M; channels trading reserves into Aave v3 to generate yield, which is retained in the pool. The emergence of these Hook-based tokens could drive long-term growth for the Uniswap ecosystem by attracting users and liquidity to v4 pools. Combined with Uniswap's activated fee switch (partially used to burn UNI), the long-term outlook for UNI appears positive. However, short-term UNI price appreciation is not directly guaranteed. Factors include the sustainability and lifecycle of these new tokens, their price volatility, overall market conditions, and regulatory pressures. Currently, Uniswap v4's TVL ($595M) lags behind v3 and v2, indicating Hook adoption still requires time to mature. In summary, the Hook ecosystem serves as "long-term nourishment" for UNI, but acts more as a "catalyst" than a direct "booster" in the short term. Note: These are early-stage experimental tokens and may carry unknown risks.

marsbit18 min fa

Has Hook Summer Really Arrived? sato, Lo0p, FLOOD Ignite the New Narrative of Uniswap v4

marsbit18 min fa

Has Hook Summer Truly Arrived? sato, Lo0p, FLOOD Ignite the New Uniswap v4 Narrative

With the broader market showing signs of recovery, a new wave of interest has emerged around Ethereum-based meme coins. Following ASTEROID, tokens like sato, sat1, Lo0p, and FLOOD, built upon the Uniswap v4 Hook protocol, are capturing market attention. Their market capitalizations range from millions to tens of millions of dollars, injecting much-needed focused liquidity into a market lacking narratives. This article explores whether this trend signifies an incoming "Hook Summer" and its potential impact on UNI's price. Hooks are essentially plug-in smart contracts for Uniswap v4 liquidity pools, allowing developers to inject custom logic at key points in a pool's lifecycle (like initialization, adding/removing liquidity, swaps). This transforms the AMM into programmable building blocks. Key highlighted projects include: * **sato**: Peaked over $38M market cap. It utilizes a v4 curve for minting/burning; buying locks ETH as reserve to mint new tokens, while selling redeems ETH from the reserve and burns tokens. * **sat1**: Market cap briefly exceeded $10M, promoted as an "optimized sato," but later declined significantly. * **Lo0p**: Reached nearly $6.6M. It's a lending AMM protocol where buying LO0P tokens locks them as collateral, allowing users to borrow ETH from the pool reserve at 40% LTV, aiming to improve capital efficiency for idle ETH in LPs. * **FLOOD**: Peaked near $6M. Its mechanism directs asset reserves from buys into Aave v3 to generate yield, with fees and interest retained in the pool to potentially influence the token's price long-term. In the long term, the development of the Hook ecosystem can attract users and liquidity to Uniswap v4, benefiting UNI's fundamentals—especially combined with the recent activation of the protocol fee switch, where a portion of fees is used to burn UNI. However, in the short term, these Hook-based tokens are unlikely to directly drive significant UNI price appreciation. Their impact is moderated by factors like token sustainability, price volatility, and broader market and regulatory conditions. Currently, Uniswap v4's TVL ($595M) still trails behind v2 and v3, indicating adoption and growth will take time. The article concludes that while the Hook ecosystem provides long-term "nourishment" for UNI, its short-term role is more of a "catalyst" than a "booster." Readers are cautioned that these are early-stage experimental tokens and may carry unknown risks.

Odaily星球日报30 min fa

Has Hook Summer Truly Arrived? sato, Lo0p, FLOOD Ignite the New Uniswap v4 Narrative

Odaily星球日报30 min fa

Interview with Michael Saylor: I Did Say I Would Sell Bitcoin, But Never a Net Sale

Interview with Michael Saylor: I Said We'd Sell Bitcoin, But Never Be a Net Seller In a recent podcast, MicroStrategy Executive Chairman Michael Saylor clarified the company's stance on potentially selling Bitcoin. Following MicroStrategy's earnings call statement about being prepared to sell BTC to fund dividends for its STRC (Strategic) credit product, Saylor emphasized the distinction between selling and being a "net seller." Saylor explained the core business model: MicroStrategy sells credit instruments like STRC and uses the proceeds to buy Bitcoin, which is viewed as "digital capital" expected to appreciate around 30-40% annually. A portion of these capital gains can then be used to pay the dividends on the credit products. He stressed that even if the company sells some Bitcoin for dividends, it simultaneously buys much more with new credit issuance. For example, after raising $3.2 billion from STRC sales in April, the dividend obligation was only $80-90 million, making the company a net buyer. The clarification aims to counter market narratives questioning the value of Bitcoin on MicroStrategy's balance sheet if it were never sold, and to dismiss claims of a "Ponzi scheme." Saylor reiterated his personal philosophy for investors: "Don't be a net seller of bitcoin" and ensure your Bitcoin holdings increase each year. Saylor also discussed Bitcoin's role as the foundation for "digital credit," noting that STRC has become the largest and most liquid preferred stock issue in the U.S., offering high risk-adjusted returns (Sharpe ratio). He highlighted Bitcoin's deep liquidity, stating that even large purchases by MicroStrategy do not move the market significantly, which is driven by macro factors, geopolitical tensions, and capital flows from ETFs and credit products. Finally, Saylor reflected on his early inspiration from sci-fi books, which motivated his path to MIT, and maintained his fundamental thesis on Bitcoin remains unchanged: it is superior digital capital enabling superior digital credit.

链捕手35 min fa

Interview with Michael Saylor: I Did Say I Would Sell Bitcoin, But Never a Net Sale

链捕手35 min fa

Beaten SK Hynix Employees in China: Year-end Bonus Less Than 5% of Korean Staff's

"SK Hynix Chinese Staff Hit Hard: Bonuses Less Than 5% of Korean Counterparts" Driven by the AI boom, South Korea's SK Hynix is experiencing record performance, with media reports predicting massive year-end bonuses for its employees, making them highly desirable in the matchmaking market. However, this prosperity starkly contrasts with the situation for the company's Chinese employees. According to reports, SK Hynix operates under a rule allocating 10% of operating profit for employee bonuses. While projections suggest Korean employees could receive bonuses reaching millions of RMB, a Chinese employee with over a decade of technical experience revealed the disparity: "If they get 3 million, Chinese staff get less than 5% of that." After adjustments based on KPI ratings, this employee's highest bonus was slightly over 100,000 RMB. Bonuses are paid annually in Korea but semi-annually in China. During the industry downturn in 2023-2024, Chinese employees received no bonus at all. The gap extends beyond bonuses. Recruitment posts for SK Hynix's Chinese factories (in Wuxi, Dalian, Chongqing) show engineer monthly salaries ranging from 10,000 to 35,000 RMB, with a 13th-month salary promised. Chinese employees also receive standard benefits like annual leave but lack stock incentives, which are reportedly unavailable to them. Furthermore, management positions in China are predominantly held by Korean personnel, though industry observers note a gradual increase in local middle managers over time. SK Hynix has confirmed the 10% bonus rule but cautioned that specific future bonus amounts remain unpredictable. The company forecasts strong demand for HBM and other high-value enterprise products for the next 2-3 years, driven by AI infrastructure investment. This focus on business-to-business markets may continue to constrain supply for consumer products, potentially prolonging price increases for components like memory.

链捕手48 min fa

Beaten SK Hynix Employees in China: Year-end Bonus Less Than 5% of Korean Staff's

链捕手48 min fa

Trading

Spot
Futures
活动图片