Tracking Volatility Regimes: Gamma Exposure Heatmap

insights.glassnodePubblicato 2026-02-24Pubblicato ultima volta 2026-02-24

Introduzione

Glassnode introduces a new Gamma Exposure (GEX) Strike Heatmap, a proprietary tool designed to track how dealer hedging flows influence crypto market volatility over time. Unlike static snapshots, this visualization shows how gamma exposure shifts across strike prices as markets move, helping traders identify volatility regimes are likely to change. GEX measures whether dealers are net long (positive GEX) or short (negative GEX) gamma. Positive GEX acts as a volatility dampener, leading to range-bound conditions, while negative GEX accelerates price moves, often causing liquidity cascades. The heatmap reveals key features like persistent positive gamma “walls” that stabilize price and expanding negative zones that signal potential breakouts. An accompanying chart tracks total GEX over time, indicating whether the market is in a high or low volatility regime based on dealer positioning. Available for BTC, ETH, XRP, and SOL in Glassnode Studio, this tool offers systematic and discretionary traders deeper insight into how options flows affect short-term price action.

As crypto options markets continue to grow, dealer hedging flows are becoming a more relevant driver of short-term price behavior. Knowing where those flows may absorb movement or reinforce it can materially improve volatility context.

Building on our foundational work in gamma exposure, Glassnode is proud to introduce a sophisticated new metric: the Gamma Exposure (GEX) Strike Heatmap.

Unlike a single snapshot view, this feature tracks the distribution of gamma exposure across strike levels over time, showing how dealer positioning shifts as the market moves.

This is a proprietary visualization methodology available exclusively on Glassnode, designed to give systematic traders and volatility professionals a temporal edge in understanding how options positioning influences price action.

Explore the live metrics in Glassnode Studio. Now available for BTC, ETH, XRP, and SOL to all Professional plan users.

Visit metrics

What is Gamma Exposure and Why it Matters

Gamma Exposure (GEX) measures how options dealers' hedging flows respond to price movements. When markets move, option deltas shift (this is gamma), forcing dealers to rebalance their positions by trading futures or spot. These flows create structural feedback loops that either dampen or amplify price action.

  • Long Gamma (Positive GEX): When dealers are net long options, they act as volatility dampeners. To stay neutral, they must sell as prices rise and buy as prices fall. This counter-cyclical trading creates resistance to large moves, often resulting in a "rangy" or stable price action.
  • Short Gamma (Negative GEX): When dealers are net short options, they act as volatility accelerators. To stay neutral, they must buy as prices rise and sell as prices fall. This pro-cyclical trading adds fuel to the fire, turning small moves into liquidity cascades.

We have developed an internal methodology to estimate dealer gamma exposure using a taker-flow approach. For a detailed explanation, refer to this article.

Why the Gamma Exposure Heatmap?

Most gamma dashboards in the industry show only a single snapshot in time. A current GEX snapshot tells you where dealer hedging pressure exists right now, but it doesn’t show how that pressure shifts. And markets are dynamic.

As price moves:

  • Strikes that are heavily gamma-positive today can fall out of the money tomorrow;
  • New gamma concentrations emerge;
  • Gamma “walls” strengthen or weaken as open interest builds or decays.

As time passes:

  • Expirations cause GEX to collapse or redistribute.

The GEX Strike Heatmap captures these changes, showing how GEX evolves.
Visit Live Chart

Gamma Exposure Heatmap Case Study

The GEX Heatmap provides a clear narrative of market sentiment that spot price alone cannot convey.

Persistent positive bands (green):

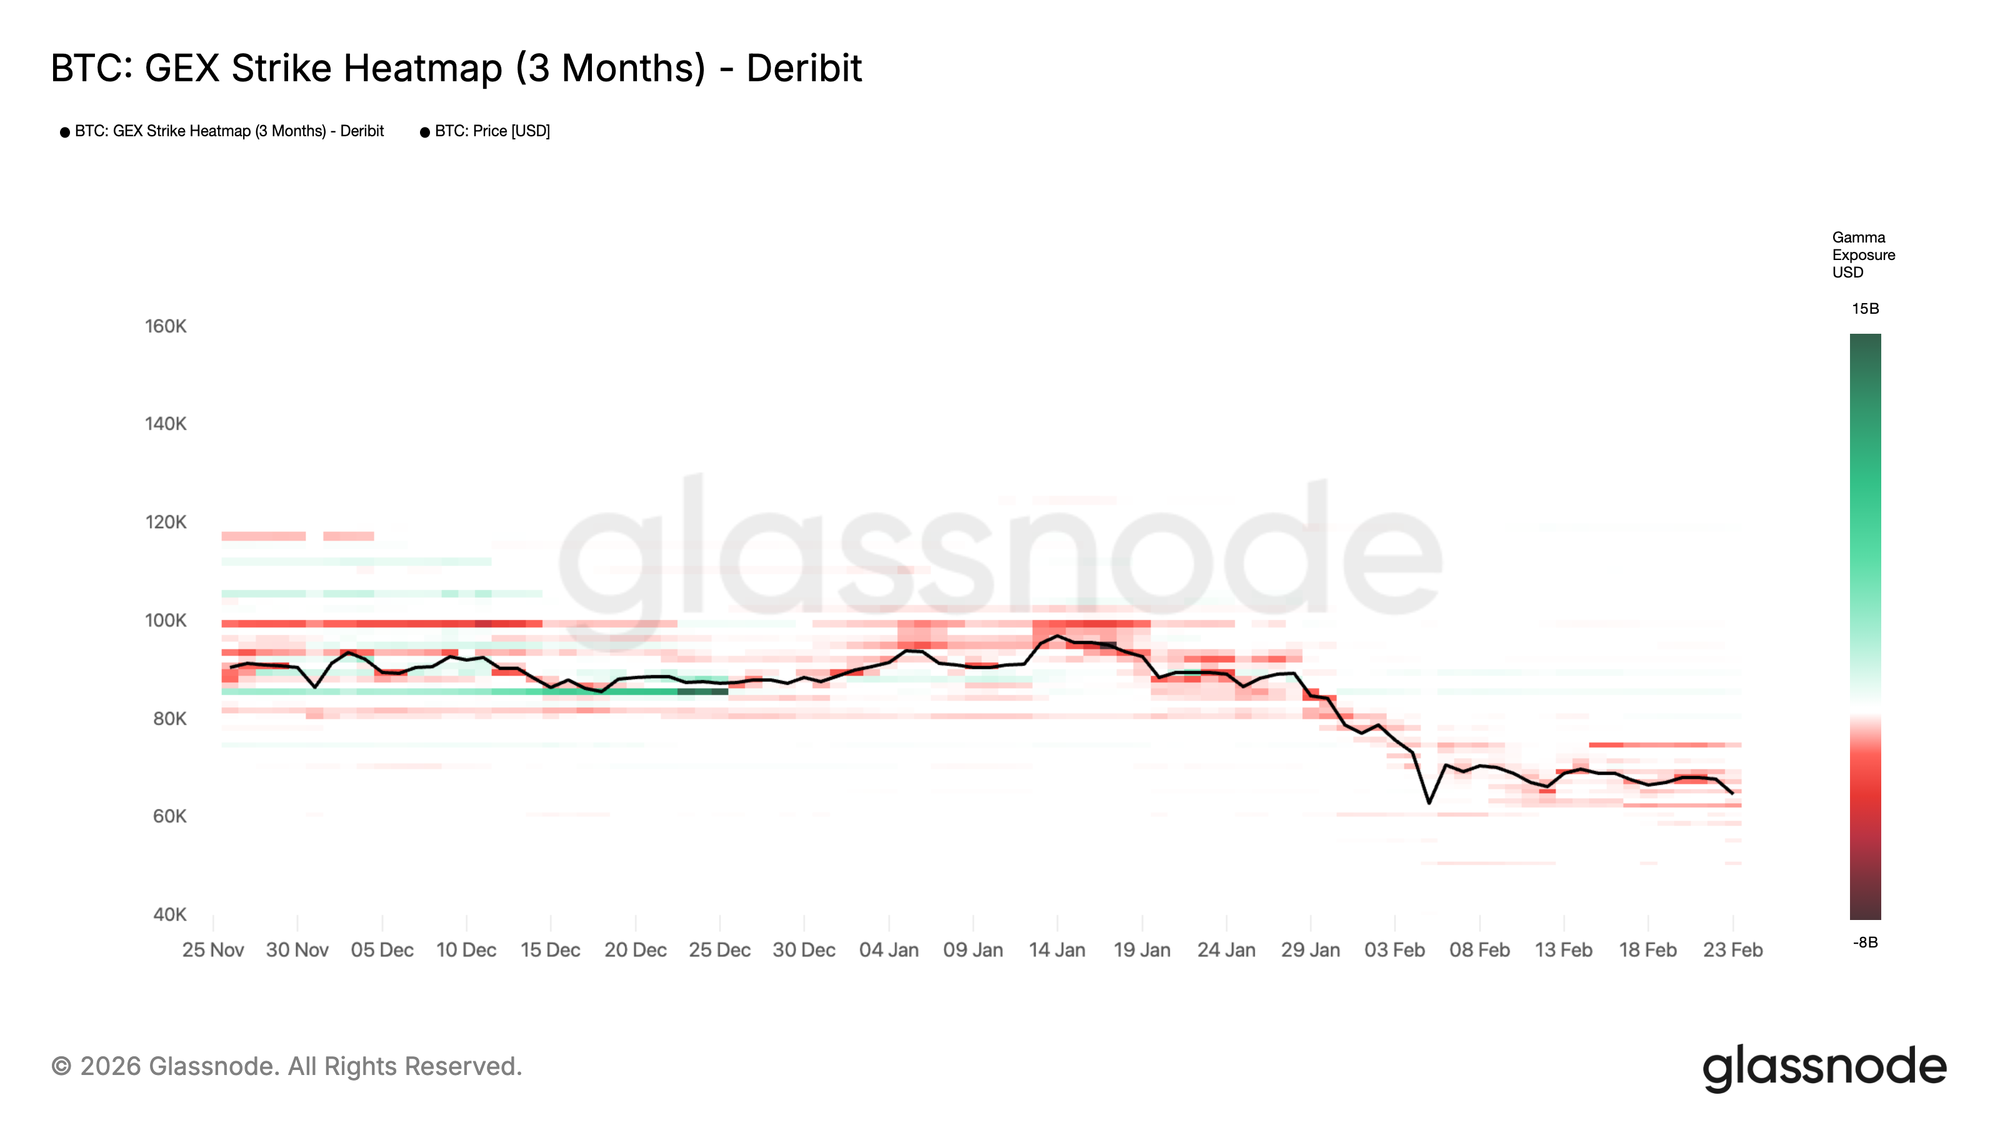
In the heatmap above, distinct green horizontal bands around 85k mid-December 2025 acted as gamma “walls”. These are price levels where dealers are heavily incentivized to suppress volatility. As long as price remains pinned here, we expect choppy, range-bound conditions.

What to look for:

  • Width of the band: Wider bands suggest a broader range of strikes with positive GEX, indicating a larger stabilization zone;
  • Duration: Bands that persist over days/weeks are more structurally significant than fleeting concentrations;
  • Proximity to spot: When price trades within a positive band, expect choppy, range-bound conditions.

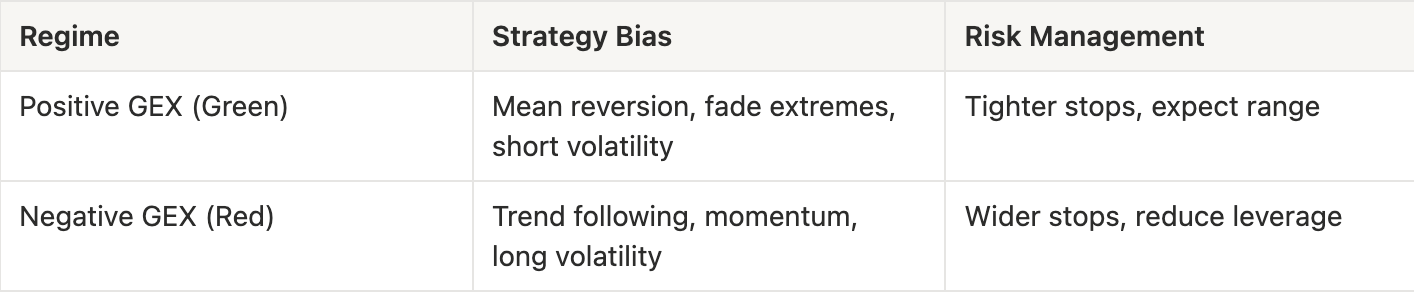
Trading implications: Mean-reversion strategies tend to work well. Fading rallies and buying dips into these zones aligns with dealer hedging flows. Breakout attempts often fail or produce false breaks.

Expanding negative zones (red):

In the recent down-leg (January-February 2026), the heatmap shifts toward stronger red bands around and below spot, while aggregate GEX turns more negative. This is consistent with a short-gamma environment, where hedging flows can reinforce downside pressure and volatility expansion.

What to look for:

  • Negative zones approaching spot: This is a warning sign for volatility expansion;
  • Increasing intensity (darker red): Growing short gamma concentration amplifies the potential for acceleration;
  • Negative zone below support levels: If price breaks into these zones, hedging flows will reinforce downside.

Trading implications: Reduce leverage, widen stops, or position for momentum trades. Mean-reversion becomes riskier. This environment favors trend-following and volatility-long positions.
Total GEX Over Time: A Volatility Lens

While the strike heatmap reveals where GEX concentrates, a natural question emerges: What is the net positioning across all strikes? Is the market, on aggregate, in a long-gamma or short-gamma regime? This is where Total GEX Over Time completes the picture.

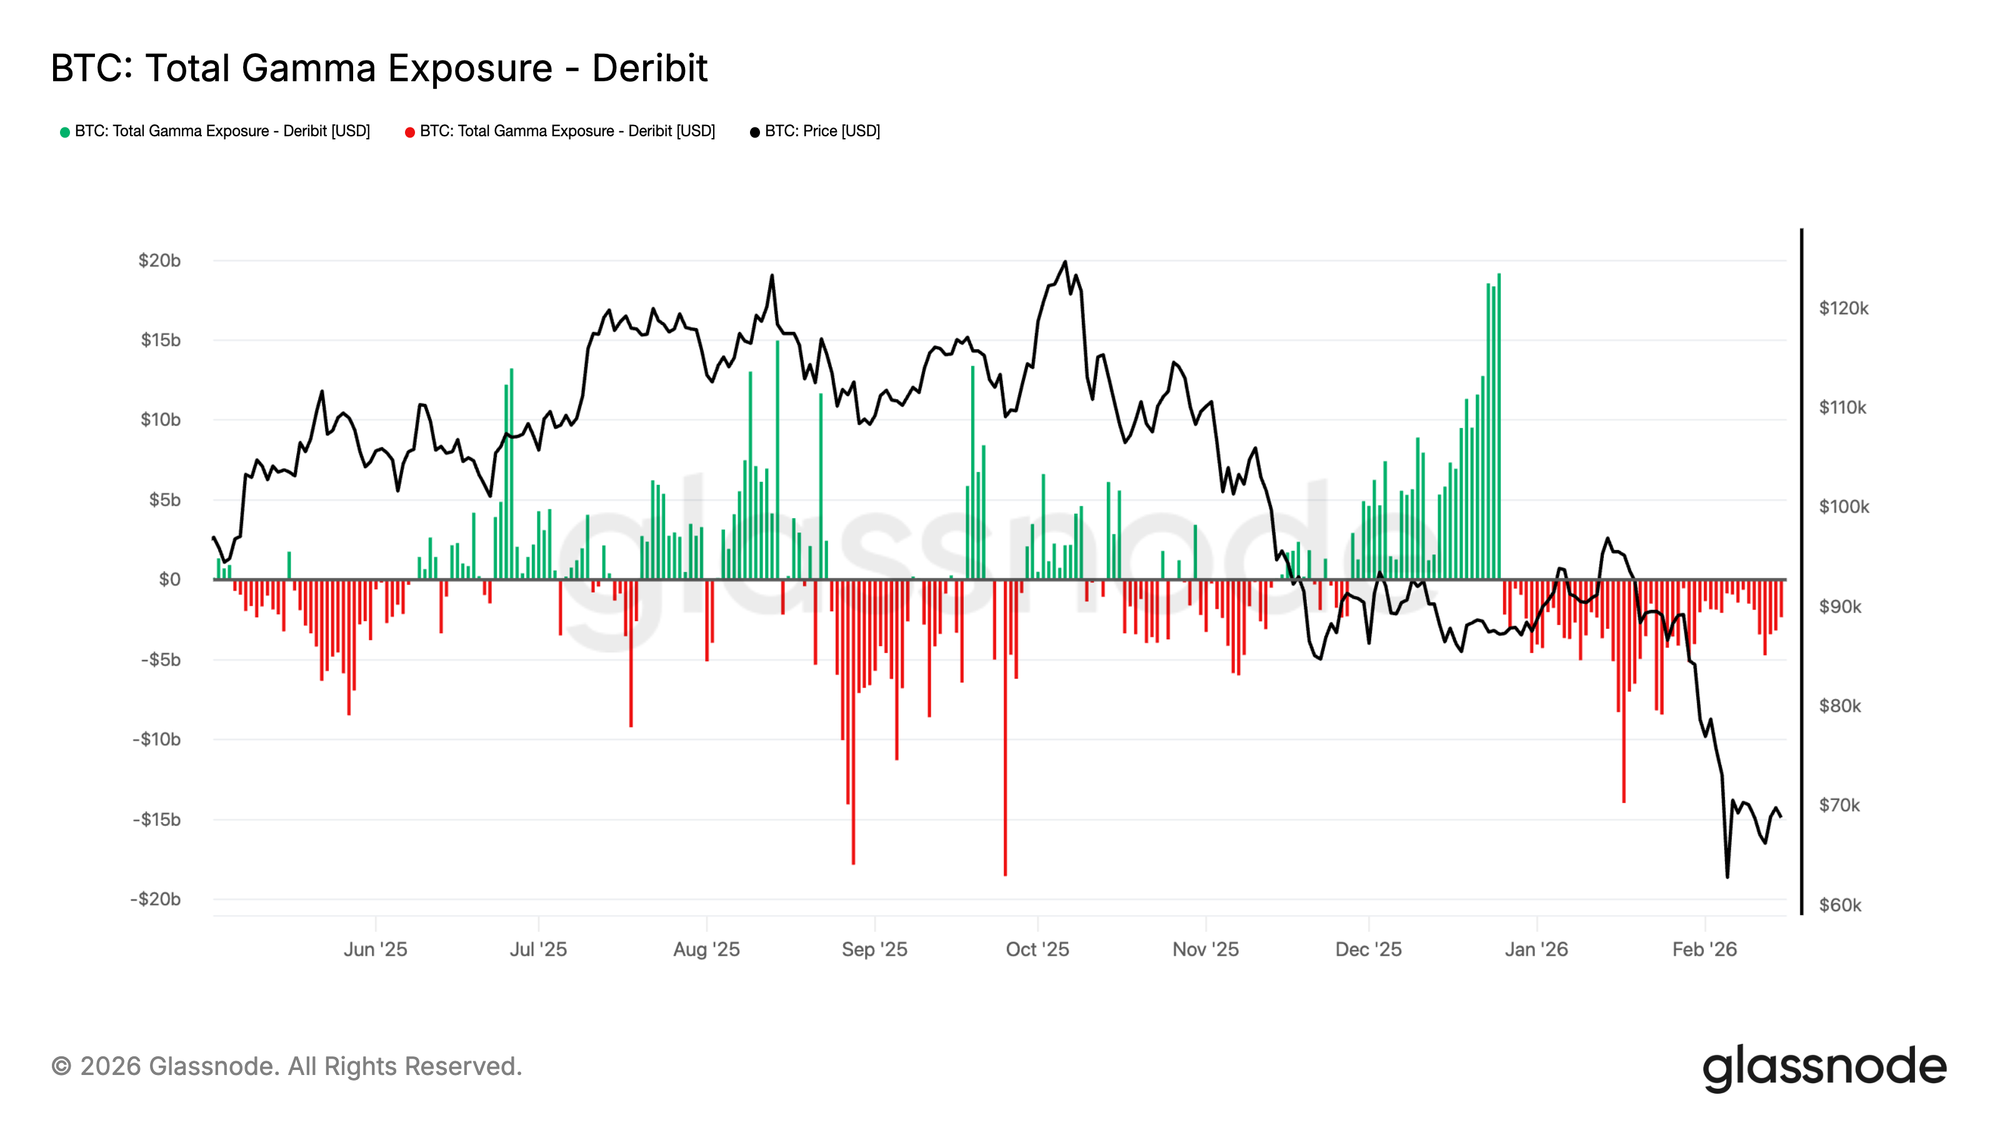
Total GEX Over Time shows whether market-makers are net long or short gamma, serving as a critical regime indicator. In the chart below, we can clearly observe Bitcoin's aggregate gamma exposure evolution. Green bars represent positive total GEX (market-makers net long gamma), red bars represent negative total GEX (market-makers net short gamma), overlaid with spot price.

This gives a high-level regime read:

  • Positive regime (green): When total GEX is strongly positive, dealer hedging flows are net stabilizing. The market tends toward lower realized volatility, with hedging flows absorbing shocks. This often coincides with consolidation phases or range-bound trading.
  • Negative regime (red): When total GEX is negative, dealer flows amplify moves. Realized volatility tends to expand, breakouts become more decisive, and price can "gap" through levels more easily.
  • Regime transitions: The moments when total GEX crosses zero, flipping from positive to negative or vice versa, often mark inflection points in volatility behavior. These transitions can precede breakouts, sudden volatility expansions, or the establishment of new trading ranges.
Visit Live Chart

Interpreting the Chart

Looking at the example above, we see:

  1. August-November 2025: Predominantly negative GEX (red) corresponds with the price decline from 120k to ~80k, indicating amplifying dealer flows that reinforced downward momentum.
  2. December 2025-January 2026: Shift toward positive GEX (green) as price bottomed and consolidated, showing stabilizing flows that supported range formation.
  3. Late January 2026: Return to negative GEX during renewed weakness, suggesting the market remained structurally positioned for volatility expansion.

Conclusion

Whether you are a discretionary trader looking for sticky support levels, or a systematic fund utilizing our API to detect volatility regimes, the GEX Strike Heatmap provides a new dimension of market clarity. By visualizing the changing landscape of dealer incentives, you can better identify when the market is primed to consolidate, and when it is ready to explode.

If you want to learn more about our options data and metric offer, or gain access to these metrics, contact our dedicated team today.


  • Follow us on X for timely market updates and analysis
  • Join our Telegram channel for regular market insights
  • For on-chain metrics, dashboards, and alerts, visit Glassnode Studio

Disclaimer: This report is for informational and educational purposes only. The analysis represents a limited case study with significant constraints and should not be interpreted as investment advice or definitive trading signals. Past performance patterns do not guarantee future results. Always conduct thorough due diligence and consider multiple factors before making investment decisions.


Domande pertinenti

QWhat is Gamma Exposure (GEX) and how does it influence market volatility?

AGamma Exposure (GEX) measures how options dealers' hedging flows respond to price movements. When dealers are net long options (positive GEX), they act as volatility dampeners by selling as prices rise and buying as prices fall, creating stable price action. When dealers are net short options (negative GEX), they act as volatility accelerators by buying as prices rise and selling as prices fall, amplifying price movements and potentially causing liquidity cascades.

QHow does the Gamma Exposure Strike Heatmap differ from traditional gamma dashboards?

ATraditional gamma dashboards show only a single snapshot of gamma exposure at a specific time, while the Gamma Exposure Strike Heatmap tracks the distribution of gamma exposure across strike levels over time. This allows traders to see how dealer positioning shifts as the market moves, including how gamma concentrations emerge, strengthen, weaken, or expire, providing a dynamic view of market structure.

QWhat do persistent green bands on the Gamma Exposure Heatmap indicate?

APersistent green bands on the heatmap indicate gamma 'walls' where dealers are heavily incentivized to suppress volatility. These bands suggest price levels where choppy, range-bound conditions are expected. Key characteristics to note include the width of the band (indicating the size of the stabilization zone), its duration (longer persistence means greater structural significance), and proximity to spot price.

QWhat trading implications are associated with expanding red zones on the heatmap?

AExpanding red zones indicate a short-gamma environment where dealer hedging flows can reinforce downside pressure and volatility expansion. In such conditions, traders should reduce leverage, widen stops, or position for momentum trades. Mean-reversion strategies become riskier, while trend-following and volatility-long positions are favored. Negative zones approaching spot price or below support levels are particularly significant warning signs.

QHow does Total GEX Over Time function as a volatility regime indicator?

ATotal GEX Over Time shows whether market-makers are net long or short gamma across all strikes, serving as a critical regime indicator. Positive total GEX (green) indicates a stabilizing regime with lower realized volatility and shock-absorbing flows, often during consolidation phases. Negative total GEX (red) indicates an amplifying regime with expanded realized volatility and more decisive breakouts. Transitions between these regimes often mark inflection points in market volatility behavior.

Letture associate

In Conversation with Ray Dalio: We Are Currently in an AI Bubble, with 1% of My Portfolio in Bitcoin

Ray Dalio, founder of Bridgewater Associates, warns in an interview that the current AI boom shows classic bubble characteristics, which could lead to significant economic downturns as seen in past cycles like 1929 or 2000. He explains that speculative enthusiasm, fueled by debt and overvaluation, often precedes a crash when rising rates or taxation force asset sales, causing widespread losses and recession. Dalio also outlines his "Big Cycle" theory, describing an approximate 80-year pattern where widening wealth gaps, massive government deficits, and shifting geopolitical power (like China's rise) create internal conflict and global instability. He emphasizes that we are in a late-cycle, transitional phase where traditional powers like the US and UK face decline. For personal wealth protection, Dalio advises diversification beyond cash into assets like stocks, bonds, real estate, and particularly gold, which he prefers over Bitcoin. While he holds about 1% of his portfolio in Bitcoin as a non-printable hard asset, he views gold as more secure from technological or governmental threats. Regarding AI's impact, Dalio believes it will disproportionately benefit capital owners, worsening inequality by replacing both physical and cognitive labor. He suggests that human intuition and emotional intelligence, combined with AI, will be key for future workers. On taxation, Dalio argues that wealth taxes are impractical and risk triggering asset sell-offs, reducing productive investment. He points to the UK as a cautionary example of debt, low productivity, and political strife. Geopolitically, Dalio foresees a more regionalized world, with the US showing weakness in prolonged conflicts like with Iran, akin to past imperial declines. The ideal outcome, he suggests, is coexisting powerful blocs (e.g., Americas, China-Asia Pacific) without major war.

marsbit2 h fa

In Conversation with Ray Dalio: We Are Currently in an AI Bubble, with 1% of My Portfolio in Bitcoin

marsbit2 h fa

Daily 7.2 Trillion KRW: Foreign Capital's Record Net Buying on Friday! Wall Street Says Headwinds for Korean Stock Fund Flows Have Subsided

South Korean stock market sees a dramatic shift in fund flows. On July 31, foreign investors made a record net purchase of approximately KRW 7.2 trillion in KOSPI stocks, marking a fundamental reversal from the persistent large-scale net outflows seen in previous months. This contributed to a significant narrowing of foreign net selling in July to KRW 9.8 trillion, down sharply from KRW 48.4 trillion in June and KRW 44.5 trillion in May. Simultaneously, domestic institutional pressure eased. South Korean pension funds and asset managers turned to a net buying position in July, purchasing KRW 1.0 trillion worth of KOSPI shares, contrasting with net sales in May and June. Market volatility is expected to be dampened by new financial regulations. Effective July 31, the Financial Services Commission tightened access for retail investors to single-stock leveraged ETFs by raising the minimum cash deposit requirement. Trading volumes for these products subsequently dropped to about 50% of their monthly average. Citigroup Research maintains its year-end KOSPI target of 10,000 points. The firm cites several supportive factors: the substantial easing of headwinds from capital outflows, a robust fundamental outlook for the semiconductor sector, historically low market valuations, strong economic fundamentals, and the potential for policy support from financial authorities if needed.

marsbit2 h fa

Daily 7.2 Trillion KRW: Foreign Capital's Record Net Buying on Friday! Wall Street Says Headwinds for Korean Stock Fund Flows Have Subsided

marsbit2 h fa

Thanks to Dice Rolls, Bitcoin Keys Are Stored Offline, But Not Everyone Will Do It

The article discusses using dice rolls to generate secure Bitcoin wallet seeds, providing entropy independent of potentially flawed hardware random number generators. It explains that each fair dice roll offers about 2.585 bits of entropy, with around 50 rolls needed for a standard 12-word seed phrase and 99+ recommended for higher security. This method gained attention after a vulnerability was revealed in some Coldcard hardware wallets, where a faulty firmware RNG (dating back to 2021) compromised generated keys. The analysis notes that while a dice-generated main seed was safe from this specific flaw, other Coldcard functions (like creating paper wallets, backup keys, or passwords) could still be vulnerable if they used the defective RNG. The piece argues that while dice-based entropy is technically robust, the manual process is error-prone, tedious, and unrealistic for most new users, who might make mistakes in recording or inputting rolls. It concludes that while manual entropy generation should remain an option for advanced users, the long-term goal is to develop reliable, user-friendly hardware and software that securely generates randomness without requiring specialized knowledge. Coldcard users are advised to check their firmware version and replace any secondary secrets (like paper wallet keys) created with vulnerable devices, while also considering multi-signature setups with devices from different manufacturers for added security.

cryptonews.ru7 h fa

Thanks to Dice Rolls, Bitcoin Keys Are Stored Offline, But Not Everyone Will Do It

cryptonews.ru7 h fa

Trading

Spot
活动图片




