The 'True and False Prosperity' of Perpetual Contracts: Have You Seen Through It?

比推Pubblicato 2026-02-11Pubblicato ultima volta 2026-02-11

Introduzione

The article "Perpetual Contracts: Real or Illusory Boom?" examines the explosive growth of perpetual futures (perps) markets, arguing that trading volume alone is a misleading metric. While perps have become dominant—growing from 44% to 75% of DEX spot volume since February 2025—this surge doesn't necessarily reflect meaningful capital deployment. Key insights include: - Total perp volume doubled to $14 trillion in just six months, even as crypto market cap fell 40%. - Open Interest (OI), which measures unrealized risk exposure, only grew ~50% in that period, indicating much of the volume is from rapid capital recycling rather than new committed capital. - The OI/Volume ratio (a measure of capital efficiency) rose from 0.33x to 0.49x over the past year, but with significant volatility, including a sharp drop after a major liquidation event in October. - Protocol-level analysis shows Hyperliquid leads in capital efficiency (OI/Vol >45%) and fee generation (~3.2 bps take rate), while others like Aster prioritize capital retention over fees. The conclusion: True market health is best read by combining volume with OI and fee data. Sustainable platforms will be those that optimize for "conviction" (long-term capital) rather than just incentivized volume.

Author: Prathik Desai

Original Title: Reading Perps Beyond Volume

Compiled and Edited by: BitpushNews


Just when you think finance is getting boring, it always has a way of surprising you. Lately, it seems like everyone is restructuring the financial system in ways few foresaw, even those from the entertainment and media industries.

Take Jimmy Donaldson (aka "MrBeast" on YouTube) for example. He not only has a snack empire but also acquired a banking app recently, aiming to promote financial literacy and money management among teenagers and young adults. Why? Perhaps nothing is more direct than monetizing his 466 million subscriber base with financial products.

This summer, the CME Group, the world's largest derivatives exchange, will launch single-stock futures, allowing users to trade futures on over 50 top U.S. stocks including Alphabet, NVIDIA, Tesla, and Meta.

These restructurings show us how people's ways of engaging with finance are changing. And nothing illustrates this better than the explosion of the Perpetual Markets (Perps) market over the past few years.

Perpetual Futures (or Perps) are a type of financial derivative contract that allows market participants to speculate on the price of an asset without an expiration date. Perps also allow people to express views on assets quickly and cheaply. They are more captivating than traditional markets because they offer instant access and leverage. Unlike traditional markets, they don't require broker onboarding processes, jurisdictional paperwork, or follow "traditional" market hours.

Furthermore, on-chain perpetual markets allow any asset (whether traditional or crypto) to be traded in a permissionless, highly leveraged manner. This makes speculation fun, especially when humans can't resist博弈 the trajectory of volatile assets outside traditional trading hours. This allows risk to be priced in real-time.

Think about what happened two weeks ago. When traditional and crypto markets crashed simultaneously, traders flocked to Hyperliquid, driving perpetual gold and silver trading into a frenzy. On January 31st, Hyperliquid alone accounted for 2% of the global daily trading volume in its Silver perpetual contract market, which had been live for less than a month.

This explains why dashboards of perpetual contract trading volume are increasingly dominating crypto communities and forums. Volume is an absolute value. It looks large, refreshes every few minutes, and is perfect for leaderboards. But it misses a key nuance: volume might reflect movement that lacks meaning. A market's high volume could be due to depth, but it could also be due to rewards and incentives encouraging higher frequency activity. This activity is often recursive and not very meaningful.

This week, I delved into other metrics of the perpetual trading market. When used in conjunction with volume, these metrics add more dimensions and tell a completely different story than volume alone.

Let's begin.

A Few Data Points

The user-friendly interface of perpetual markets makes them a low-barrier, default interface for expressing views across various markets and global assets. The wide selection of highly leveraged derivative trading on both traditional and crypto assets on a single platform has led to perpetual contract volumes surpassing spot trading volumes on decentralized exchanges. From 44% in February 2025, the share of perpetual contract volume has soared to around 75% today (relative to spot volume).

This growth has been particularly pronounced in the past few months:

  • As of July 31, 2025, the four-year cumulative perpetual trading volume across all platforms was $6.91 trillion.

  • In just the past six months, this volume has doubled, reaching $14 trillion.
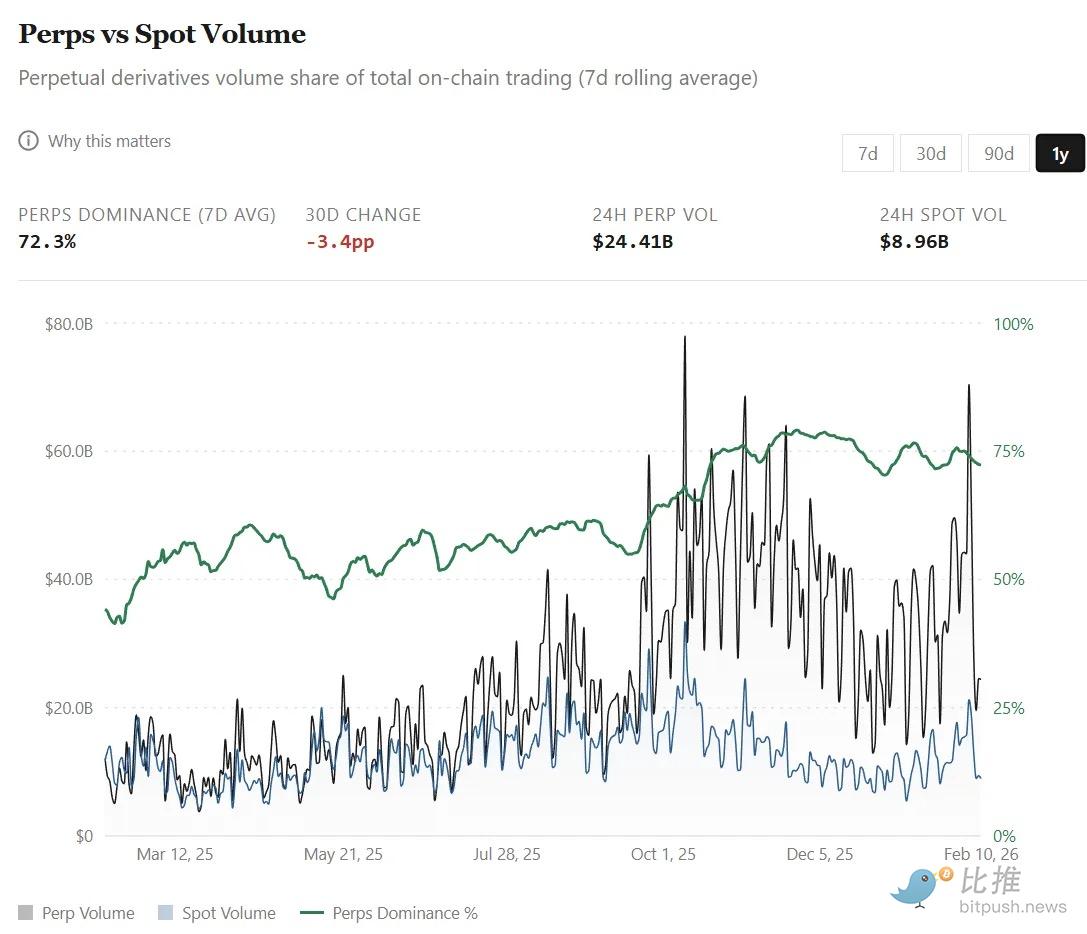
All this growth occurred against the backdrop of the total cryptocurrency market capitalization shrinking by nearly 40% between August 1, 2025, and February 9, 2026. This activity suggests traders are increasingly leaning towards derivative trading, hedging, and short-term positioning, especially when spot markets become highly volatile and bearish.

But there's a catch. With such massive activity, it's easy to misread volume metrics. Especially because perpetual trading isn't just about buying and holding assets long-term; it involves repeatedly adjusting bet sizes using leverage over shorter time frames.

So, when market turnover speeds up, a question inevitably arises: Do record-breaking volumes reflect more capital flowing in, or the same capital cycling faster?

This is where observing Open Interest (OI) becomes meaningful. If volume reflects capital flow, then OI measures outstanding risk exposure. On perpetual exchanges, OI refers to the total dollar value of active, unsettled long and short contracts held by traders.
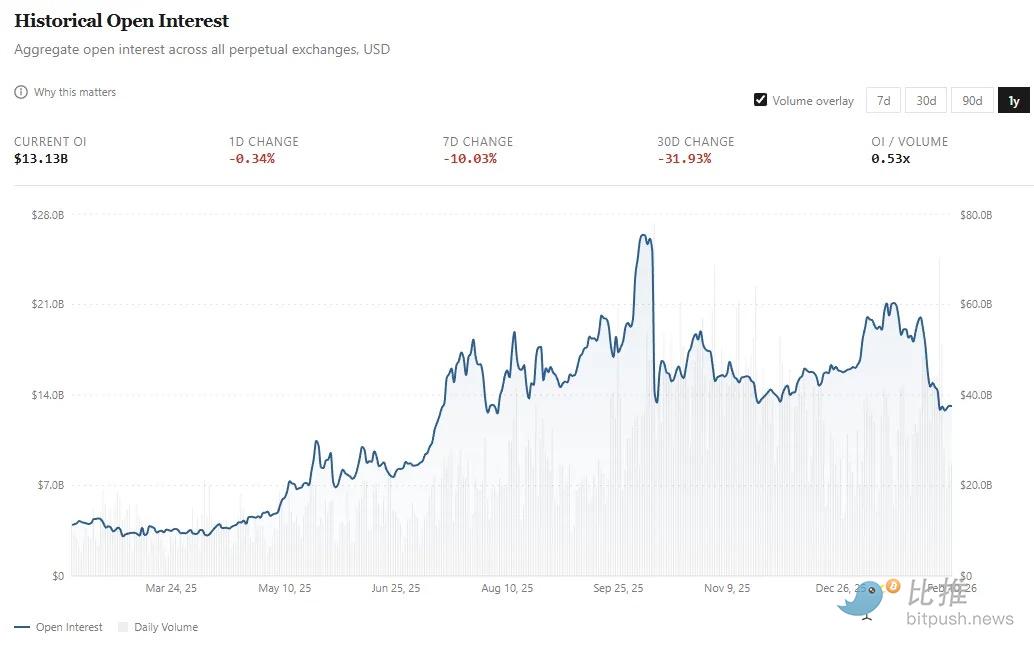
If perpetual trading is being adopted by the mass market, we would hope to see not only larger capital flows but also proportionally growing outstanding exposure.

  • Last February, OI averaged around $4 billion;

  • Now that number has more than tripled, to around $13 billion. In fact, the average for the entire month of January was around $18 billion before dropping about 30% in the first week of February.

While perpetual trading volume doubled in the past five months, OI grew by about 50% (from $13B to ~$18B, then back to ~$13B). To better understand this, I looked at the trend of Capital Efficiency (i.e., OI as a percentage of daily volume) over the past year.
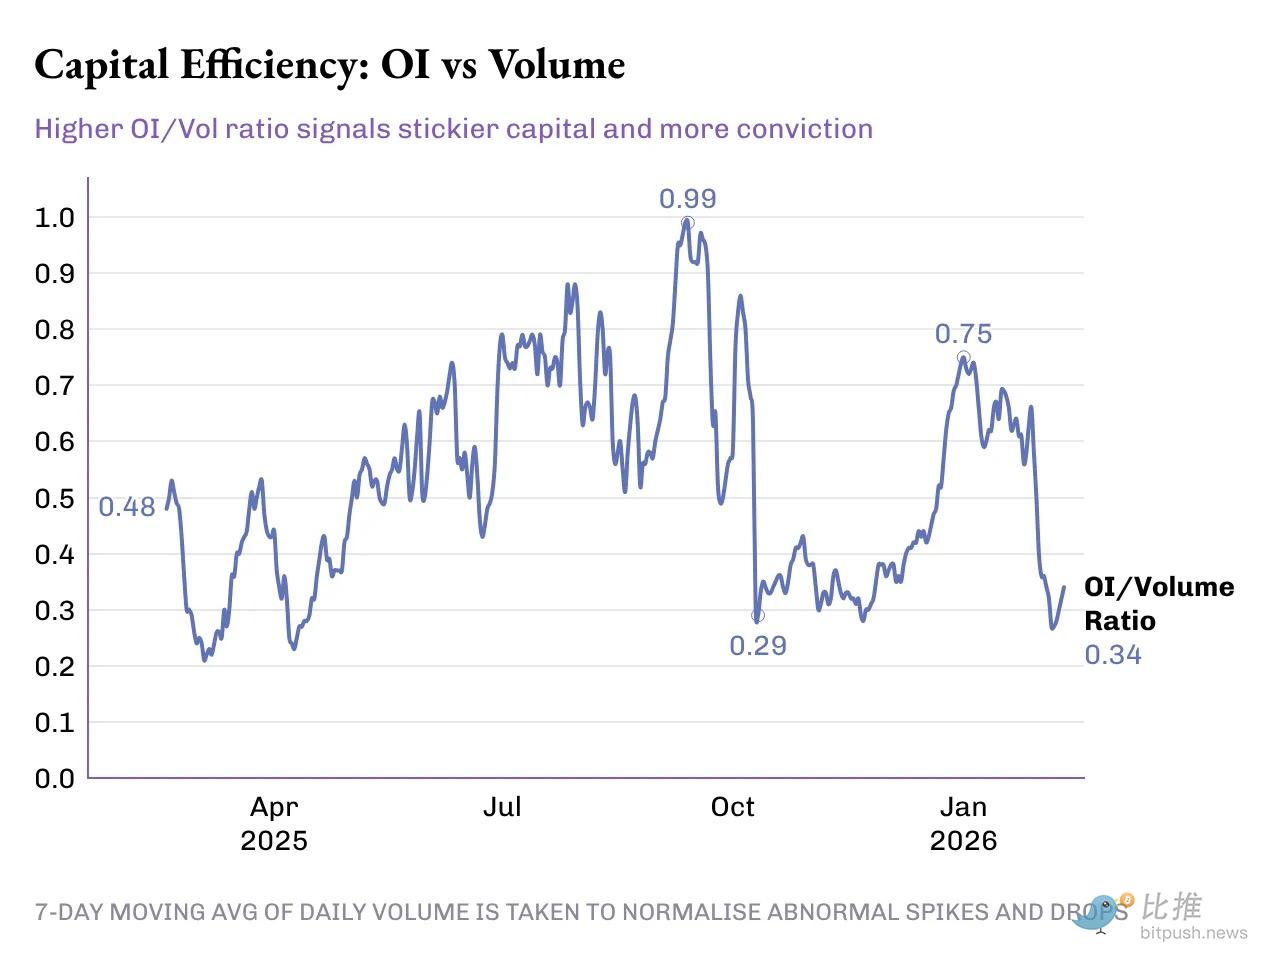
The OI/Volume ratio jumped 50% from 0.33x last year to 0.49x today. But this progress wasn't smooth; the 50 basis point growth in this ratio went through multiple peaks and troughs:

  1. Phase 1 (Feb-May 2025): Dormancy. The OI/Volume ratio averaged ~0.46x, with average OI of ~$4.8B and average daily volume of ~$11.5B.

  2. Phase 2 (June - Mid-Oct): Leap. The ratio averaged ~0.72x. During this period, average OI rose to $14.8B, and average daily volume was $23B. This marked not only record volume but also increased risk exposure and greater capital commitment to these derivatives.

  3. Phase 3: Market Reversal. This phase began around the massive liquidation on October 10th, which wiped out over $19B in leveraged positions within 24 hours. From mid-October to late December, the OI/Volume ratio fell to ~0.38x, driven primarily by volume growth while open interest largely stagnated. October, November, and December saw the highest three-month trading volumes of 2025, averaging over $1.2 trillion per month. Over the same period, OI averaged around $15B, slightly below the previous three-month average.

Protocol Level

Here, I want to add more dimensions at the protocol level for perpetual markets. This helps us understand how efficiently perpetual exchanges convert trading activity into "sticky capital" and revenue.

As of February 10th, here's how the top 5 perpetual exchanges by 24-hour volume performed:

  • Hyperliquid: Its OI to 7-day average daily volume ratio exceeds 45%, able to convert a large share of volume into lasting positions. This indicates that for every $10 traded on the platform, $4.5 is投入 (invested) in active positions. This is important because high OI rates lead to narrower spreads, deeper liquidity, and confidence in scaling trades without slippage.

    • Hyperliquid's fee revenue reinforces this story. Its Take Rate is ~3.2 basis points (bps), converting the largest share of 24-hour volume into fee income.

  • Aster: Currently ranked second, it maintains a decent capital efficiency (OI/Vol) of 34%, despite having almost half the volume of Hyperliquid. However, its monetization capability is notable – with a lower take rate (~1.6 bps), Aster clearly prioritizes capital retention on its platform over fee revenue maximization.
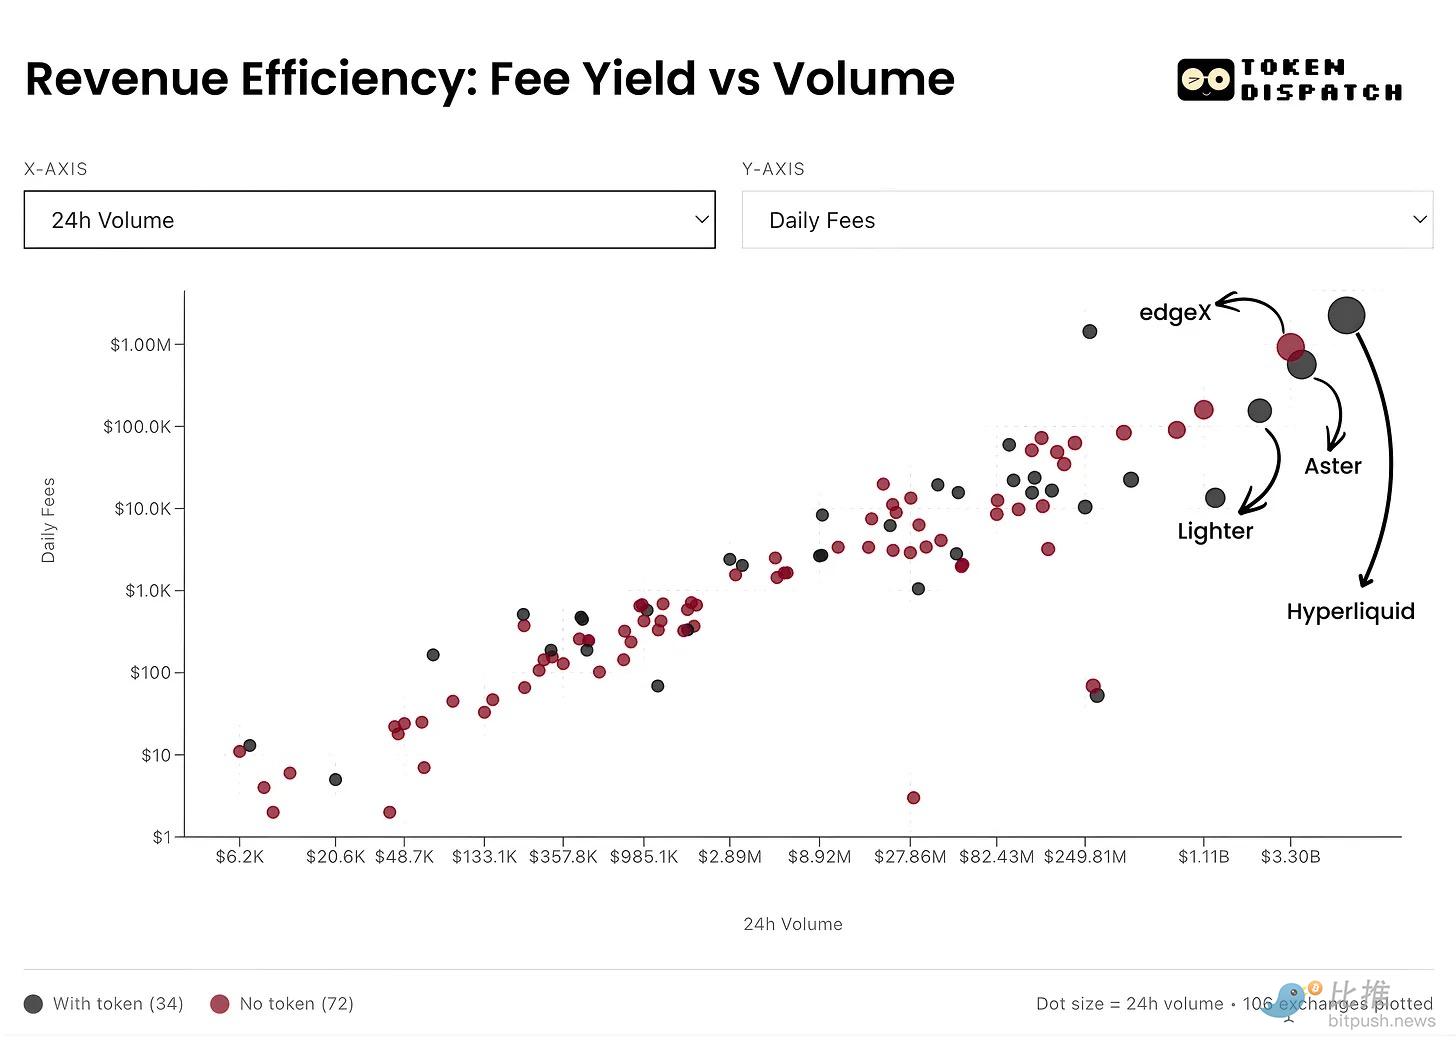

  • edgeX & Lighter: Both perform similarly on the capital efficiency ladder, with OI/Vol at 21%. However, edgeX's fee monetization is comparable to Hyperliquid's at 2.8 bps.

Summary

It's remarkable that the perpetual contract market today is no longer a simple growth story; it requires a nuanced reading of multiple metrics. At the macro level, volume has exploded: the growth in cumulative perpetual trading volume in six months exceeded the total of the previous four years. But the picture only becomes clear when OI and volume are read together.

A clearer victory lies in the growth of the OI/Volume ratio. This is a direct signal that "patient capital" is willing to trust and bet on the various products and markets emerging on perpetual trading exchanges.

What's even more值得关注 (worth watching) in the future is how individual players will evolve from here and what they choose to optimize. Over time, exchanges that can optimize for "Conviction" and achieve sustainable monetization will be far more important than those that merely rely on rewards and incentives to dominate volume leaderboards.


Twitter:https://twitter.com/BitpushNewsCN

Bitpush TG Discussion Group:https://t.me/BitPushCommunity

Bitpush TG Subscription: https://t.me/bitpush

Original article link:https://www.bitpush.news/articles/7611212

Domande pertinenti

QWhat are perpetual futures (Perps) and how do they differ from traditional futures contracts?

APerpetual futures (Perps) are financial derivative contracts that allow market participants to speculate on the price of an asset without an expiration date. Unlike traditional futures, they do not require broker onboarding, jurisdictional paperwork, and are not bound by traditional market hours. They also provide instant access and leverage, enabling fast and cheap expression of views on assets.

QAccording to the article, what key metric should be observed alongside trading volume to better understand the health of the perpetuals market?

AThe article states that Open Interest (OI) should be observed alongside trading volume. While volume reflects capital flow, OI measures the amount of outstanding, unsettled risk exposure (the total dollar value of active long and short contracts).

QWhat significant event in October 2025 caused a major shift in the OI/Volume ratio, and what was the consequence?

AA massive liquidation event on October 10, 2025, wiped out over $19 billion in leveraged positions within 24 hours. This event marked the start of a phase where the OI/Volume ratio dropped to ~0.38x, driven by growth in trading volume while open interest largely stagnated.

QWhich perpetual exchange, as of February 10th, had the highest capital efficiency (OI/Volume ratio) and what was its approximate ratio?

AAs of February 10th, Hyperliquid had the highest capital efficiency with an OI to 7-day average daily volume ratio of over 45%.

QWhat does the article suggest is a more important long-term goal for perpetual exchanges than simply topping volume leaderboards?

AThe article suggests that a more important long-term goal is for exchanges to optimize for 'trading conviction' and achieve sustainable monetization, rather than just relying on rewards and incentives to dominate volume rankings.

Letture associate

Global Market Share Survey: Japanese Firms Lead in Semiconductor Materials

Global Market Share Survey: Japanese Firms Lead in Semiconductor Materials According to the 2025 "Major Goods and Services Market Share Survey" by Nikkei, Japanese companies maintain strong positions in semiconductor-related materials. In silicon wafers, Shin-Etsu Chemical ranks first with a 26.3% share, followed by SUMCO at 17.8%. Together, they hold 44.1% of the market, widening their lead over competitors from Taiwan, Germany, and South Korea. In photoresists, Tokyo Ohka Kogyo, JSR, and Shin-Etsu Chemical occupy the top three spots, with a combined share of 60.5%. Despite their strength in materials, Japanese firms have a weaker presence in core semiconductor segments like DRAM and NAND flash memory, where South Korean and U.S. companies dominate. For instance, SK Hynix and Samsung lead in DRAM, while China’s CXMT doubled its share to 6% in 2025. The semiconductor market is projected to grow rapidly, with WSTS forecasting a 90% increase to $1.5112 trillion by 2026. Major players like Samsung, SK Hynix, and Micron are making massive investments to expand capacity. To maintain their edge in materials, Japanese companies must similarly commit to large-scale, risk-taking investments. In contrast, Japan’s automotive sector shows stagnation. Toyota remains the global leader but with only a slight share increase to 12.3%, while Japanese brands are absent from the top five in the EV market. In shipbuilding, Imabari Shipbuilding rose to third place globally with a 7.2% share, benefiting from large container ship deliveries. However, Chinese and South Korean firms dominate the sector, holding the top two positions. Japan aims to revitalize its shipbuilding industry through government and corporate efforts, targeting a near doubling of output by 2035. Addressing labor shortages and adopting advanced technologies like physical AI will be critical for competitiveness.

marsbit17 min fa

Global Market Share Survey: Japanese Firms Lead in Semiconductor Materials

marsbit17 min fa

STRC Major De-pegging's First Financial Report, How Will Strategy Repair Its Capital Flywheel?

Bitcoin treasury company Strategy released its Q2 2026 earnings report on July 31. Despite a 6.9% year-over-year revenue increase to $122 million, the company recorded a net loss of $8.22 billion, largely due to $8.32 billion in unrealized losses from Bitcoin price fluctuations. As of quarter-end, Strategy holds 843,775 BTC with an average cost of $75,000 per coin, and Bitcoin per share increased. The report highlights a critical shift in Strategy's capital model following the de-pegging of its key financing tool, STRC (Strategic Coin), which fell below its $100 target. Management's top priority is restoring STRC to its target value, aiming for a recovery by September 8. They rule out discounted STRC issuances and plan to maintain its dividend yield at 12%, instead focusing on bolstering its $3.75 billion cash reserve. Strategy has moved from a one-way "buy-and-hold" Bitcoin strategy to active capital management. This new approach, part of its "Digital Credit Capital Framework," involves flexibly managing its balance sheet across four elements: BTC, USD cash, common stock (MSTR), and digital credit securities like STRC. This allows for BTC monetization (having sold $218.4 million in BTC so far), strategic repurchases of discounted securities, and debt optimization, as seen with a $1.5 billion convertible bond buyback. The company's future hinges on two key tests: successfully re-pegging STRC to restore market confidence in its digital credit system, and a long-term recovery in Bitcoin's price to ultimately support its growth thesis.

marsbit1 h fa

STRC Major De-pegging's First Financial Report, How Will Strategy Repair Its Capital Flywheel?

marsbit1 h fa

STRC's First Financial Report Post-Depegging, How is Strategy Restoring the Capital Flywheel?

On July 31, 2026, Bitcoin treasury company Strategy released its Q2 financial report. Despite a 6.9% year-over-year increase in revenue to $122 million, the company recorded a substantial net loss of $8.22 billion, primarily due to $8.32 billion in unrealized losses from Bitcoin holdings. While Strategy's core Bitcoin strategy remains intact—its holdings grew 11% to 843,775 BTC—the company is undergoing a fundamental shift in its capital model. Following the de-pegging of its key financing tool, the STRCoin (STRC), from its $100 target in May, Strategy has pivoted from a one-directional "raise funds, buy Bitcoin" cycle to a more dynamic, multi-asset capital management approach. A key part of this new framework is the "Monetization Program," through which Strategy has sold approximately $218.4 million worth of BTC to bolster liquidity. The company's top priority is repairing STRC's peg, committing not to issue discounted shares until it returns to its target range. It has initiated a $1 billion buyback program for discounted digital credit securities, having repurchased $28.9 million face value of STRC so far. Management aims to restore the peg around September 8, 2026. Strategy now actively manages a matrix of assets: Bitcoin (for accumulation or strategic sales), USD cash reserves (now at $3.75 billion), common stock (MSTR), and digital credit securities like STRC. This allows for tactical moves like repurchasing discounted debt or equity to capture value. The future success of Strategy's "capital flywheel" hinges on two factors: the short-term ability to successfully re-peg STRC to restore market confidence in its digital credit system, and the long-term price trajectory of Bitcoin, upon which its entire investment thesis ultimately depends.

Odaily星球日报1 h fa

STRC's First Financial Report Post-Depegging, How is Strategy Restoring the Capital Flywheel?

Odaily星球日报1 h fa

Trading

Spot
活动图片