Solana Price Struggles Below $100, But This Level Changes Everything

bitcoinistPubblicato 2026-06-04Pubblicato ultima volta 2026-06-04

Introduzione

Solana (SOL) has broken below a critical historical support level, which previously triggered its 2022-2023 bull run. With SOL struggling below $100, analyst Crypto Tice outlines two potential scenarios. If SOL reclaims the lost level, it could reignite bullish momentum toward $250. However, if the breakdown is sustained, the price risks falling to new lows. Another analyst, Crypto Patel, notes SOL has printed eight consecutive red monthly candles, a first in its history. He suggests a potential sharp rebound to the $500-$1,000 range could follow after a potential ninth red candle forms a bottom. SOL is currently trading near $75.

A crypto analyst has announced that the Solana price has just broken below a critical support level that had previously triggered an explosive bull run in the last market cycle. With SOL currently struggling below $100 and facing persistent bearish pressure, the analyst has outlined two possible scenarios that could determine the cryptocurrency’s next moves.

Analyst Predicts Two Possible Scenarios For The Solana Price

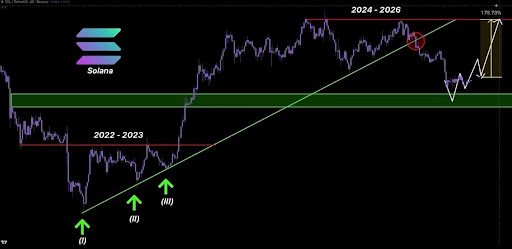
In a recent X post, market expert Crypto Tice said that the Solana price now has only two possible paths after slipping below a key support level that drove its 2022-2023 bull rally. At the time, SOL’s price had held onto the level before exploding to new all-time highs.

The analyst noted that the same pattern appeared to be forming again almost perfectly during this cycle. However, instead of holding the key level as it did in the past cycle, SOL deviated from the historic chart pattern by slipping below it. Against this backdrop, Crypto Tice has projected Solana’s next moves.

According to the analyst, if Solana manages to reclaim the broken historic level, it could reignite its bullish momentum and drive its price toward $250. Such a move would signal that buyers are stepping back in to regain control and that the market has resumed following the historic path seen during the 2022-2023 cycle. Based on Solana’s current price near $75, a rally to $250 would represent a gain of more than 233%, offering significant upside if the bullish scenario plays out as expected.

Source: Chart from Crypto Tice on X

On the flip side, Crypto Tice warns that if the recent breakdown is accepted and Solana fails to reclaim the support level, the cryptocurrency’s price could crash to new lows. In this case, bulls could be trapped for an extended period as a larger correction potentially unfolds. With SOL’s price already down 10% this past week and over 5% in the past 24 hours, a continued decline could intensify selling pressure and deepen its weakness.

At the same time, Crypto Tice has warned that the next candle will be critical in deciding SOL’s short-term direction. He said he is now closely watching price action for any signs of recovery or further weakness.

SOL Continues Heavy Bearish Streak

Despite many analysts keeping a positive outlook on Solana, the cryptocurrency remains in a strong bearish trend. Market analyst Crypto Patel noted that Solana has just printed eight consecutive red monthly candles, indicating a prolonged slump.

He called this move historical, noting it’s the first time Solana has faced such a long bearish streak since its launch. During the 2021 cycle, SOL had around nine red monthly candles, but they were not consecutive. Patel added that after the previous bearish phase ended and the price hit a bottom, Solana surged quickly to near its all-time high of $295.

Based on this pattern, Crypto Patel suggested that if history repeats, Solana could see a sharp rebound after the ninth red candle, potentially climbing to the $500 – $1,000 range once it prints a ninth red candle and it hits a bottom.

SOL trading at $75 on the 1D chart | Source: SOLUSDT on Tradingview.com

Domande pertinenti

QAccording to analyst Crypto Tice, what are the two possible scenarios for Solana's price after breaking below a key support level?

AThe two scenarios are: 1) If Solana reclaims the broken historic support level, it could reignite bullish momentum and potentially rally towards $250. 2) If the breakdown is accepted and Solana fails to reclaim the support level, the price could crash to new lows, trapping bulls in a larger correction.

QWhat is significant about Solana's current price action according to Crypto Patel's analysis?

ACrypto Patel noted that Solana has printed eight consecutive red monthly candles, which is a historical bearish streak it hasn't seen since its launch. This indicates a prolonged slump.

QWhat potential price target does analyst Crypto Patel suggest if Solana's historical pattern repeats after its current bearish streak?

ABased on the pattern observed after a similar bearish phase in 2021, Crypto Patel suggests that after printing a potential ninth red candle and hitting a bottom, Solana could see a sharp rebound potentially into the $500 – $1,000 range.

QWhat is the price of Solana (SOL) mentioned in the article as its current struggling point?

AThe article states that Solana is struggling below $100, and its current price is specifically mentioned to be near $75.

QAccording to Crypto Tice, why is the next candle critical for Solana's price action?

ACrypto Tice states that the next candle will be critical in deciding SOL's short-term direction, as he is closely watching for any signs of recovery or further weakness.

Letture associate

STRC Breaks Below $95: Why Does It Continue to Depeg? Is There Default Risk?

"STRC Falls Below $95: Why the Persistent Depegging and Is There Default Risk?" The article discusses the recent decline in the price of STRC, a perpetual preferred stock issued by Strategy (MSTR) designed to trade around a $100 par value. As of publication, STRC traded at $94.65, raising market concerns. STRC is described as a high-yield cash flow product, offering an 11.50% annual dividend paid monthly. Its "preferred" status grants it priority over common stock for dividends and in liquidation. Key reasons cited for the price depegging include: 1. **Bitcoin's Price Drop:** MSTR's assets are heavily tied to Bitcoin (BTC), which fell over 21% from its recent high, pressuring all Strategy-related products. 2. **Competitive Pressure:** Rival Strive Asset Management's similar product, SATA, offers daily dividends and has maintained its $100 par value with a ~13% yield. In response, Strategy has proposed changing STRC's dividend frequency from monthly to bi-weekly, pending shareholder vote. 3. **Technical Selling:** A break below $100 may have triggered algorithmic selling and stop-losses, exacerbating the decline. Regarding default risk, the analysis suggests it is currently low. Strategy founder Michael Saylor confirmed the June 2026 dividend rate remains at 11.50% with no cuts or suspensions. The company's massive reserve of 843,706 BTC provides a significant backstop for its obligations. Industry opinions are mixed. Some analysts view the BTC holdings as reliable support for dividends, while critics like Peter Schiff warn of potential dividend cuts leading to price crashes and lawsuits. Others highlight inflation risk and the company's ability to reduce dividends without a formal default. In summary, STRC's drop is attributed to BTC volatility, competition, and technical factors. While immediate default risk appears contained, the product faces challenges from market conditions and competitive dynamics.

marsbit1 h fa

STRC Breaks Below $95: Why Does It Continue to Depeg? Is There Default Risk?

marsbit1 h fa

AI Trading Cools, South Korean Stocks Plunge 1.8%, Spot Gold Rises 1%, Bitcoin Dives

A sell-off in AI-related stocks, triggered by Broadcom's disappointing earnings forecast, sent shockwaves through global markets. South Korea's KOSPI led Asia's decline, plunging 1.8% as the risks from concentrated chip stock gains and surging leveraged investments came to the fore. The tech-heavy Nasdaq 100 futures fell 0.5% following Broadcom's 14% after-hours plunge, which signaled a slower-than-expected transition to AI clients. This pullback extended Wall Street's weakness, halting the S&P 500's nine-day rally amid hawkish Fed signals and renewed Middle East tensions. South Korean authorities convened an emergency meeting, pledging "immediate measures" against market volatility and warning of record-high stock margin debt. The adjustment rippled across assets: Bitcoin fell to around $64,000, its lowest since February, while safe-haven gold rose 1% on bargain hunting. Oil prices dipped on Middle East ceasefire news. Market analysts noted the sell-off was driven by profit-taking after massive gains, particularly in chip stocks like Samsung and SK Hynix, which now dominate the KOSPI. Wall Street banks are divided on Korea's outlook, with Goldman Sachs raising its target while Citigroup and others warn of overvaluation and a potential bubble. Bridgewater's Ray Dalio noted that great technological shifts often create bubbles. Meanwhile, Fed officials' hints at potential future rate hikes added to the cautious mood ahead of key U.S. jobs data.

华尔街日报1 h fa

AI Trading Cools, South Korean Stocks Plunge 1.8%, Spot Gold Rises 1%, Bitcoin Dives

华尔街日报1 h fa

Trading

Spot
Futures
活动图片