Soaring Oil Prices No Longer Drive Up Interest Rates, What Is the Market Afraid Of?

marsbitPubblicato 2026-03-31Pubblicato ultima volta 2026-03-31

Introduzione

Oil prices surged nearly 60% in March 2026—the steepest monthly rise since Brent crude's inception in 1988—after the Strait of Hormuz closed, cutting off 17.8 million barrels per day of oil flow. Historically, such spikes pushed inflation expectations and bond yields higher, but this time, the 10-year Treasury yield fell sharply from 4.44% to 3.92% in late March, signaling a decoupling. This divergence reflects a market shift: growth risks now outweigh inflation concerns. Bond markets are betting on recession rather than persistent inflation. Historical oil shocks—like those in 1973, 1979, 1990, and 2008—often preceded economic downturns. The sole exception was the 2022 spike, which triggered severe inflation instead. Market expectations pivoted rapidly. Earlier, traders anticipated rate cuts, but by late March, weak consumer confidence and manufacturing data drove bets toward Fed dovishness. Chair Powell emphasized monitoring whether the supply shock is temporary, but the bond market has already priced in recession risks. If stagflation emerges—as during 1973–1982—real assets like gold and commodities may outperform, while stocks and bonds could suffer. The 60/40 portfolio would be particularly vulnerable. Analysts project Brent could average $115–125 in April, with a peak of $150 possible if the Strait remains closed. The bond market’s verdict is clear: fear of recession dominates.

Since the closure of the Strait of Hormuz on March 2, approximately 17.8 million barrels per day of global oil flow have been cut off. In March alone, Brent crude surged nearly 60%, while WTI rose about 53%. This marks the steepest monthly gain for the Brent contract since its inception in 1988, surpassing the 46% record set during the 1990 Gulf War.

Conventionally, soaring oil prices drive up inflation expectations, and bond yields should follow suit. For most of the past two decades, oil prices and the 10-year U.S. Treasury yield have indeed been positively correlated. But this time, they moved in opposite directions.
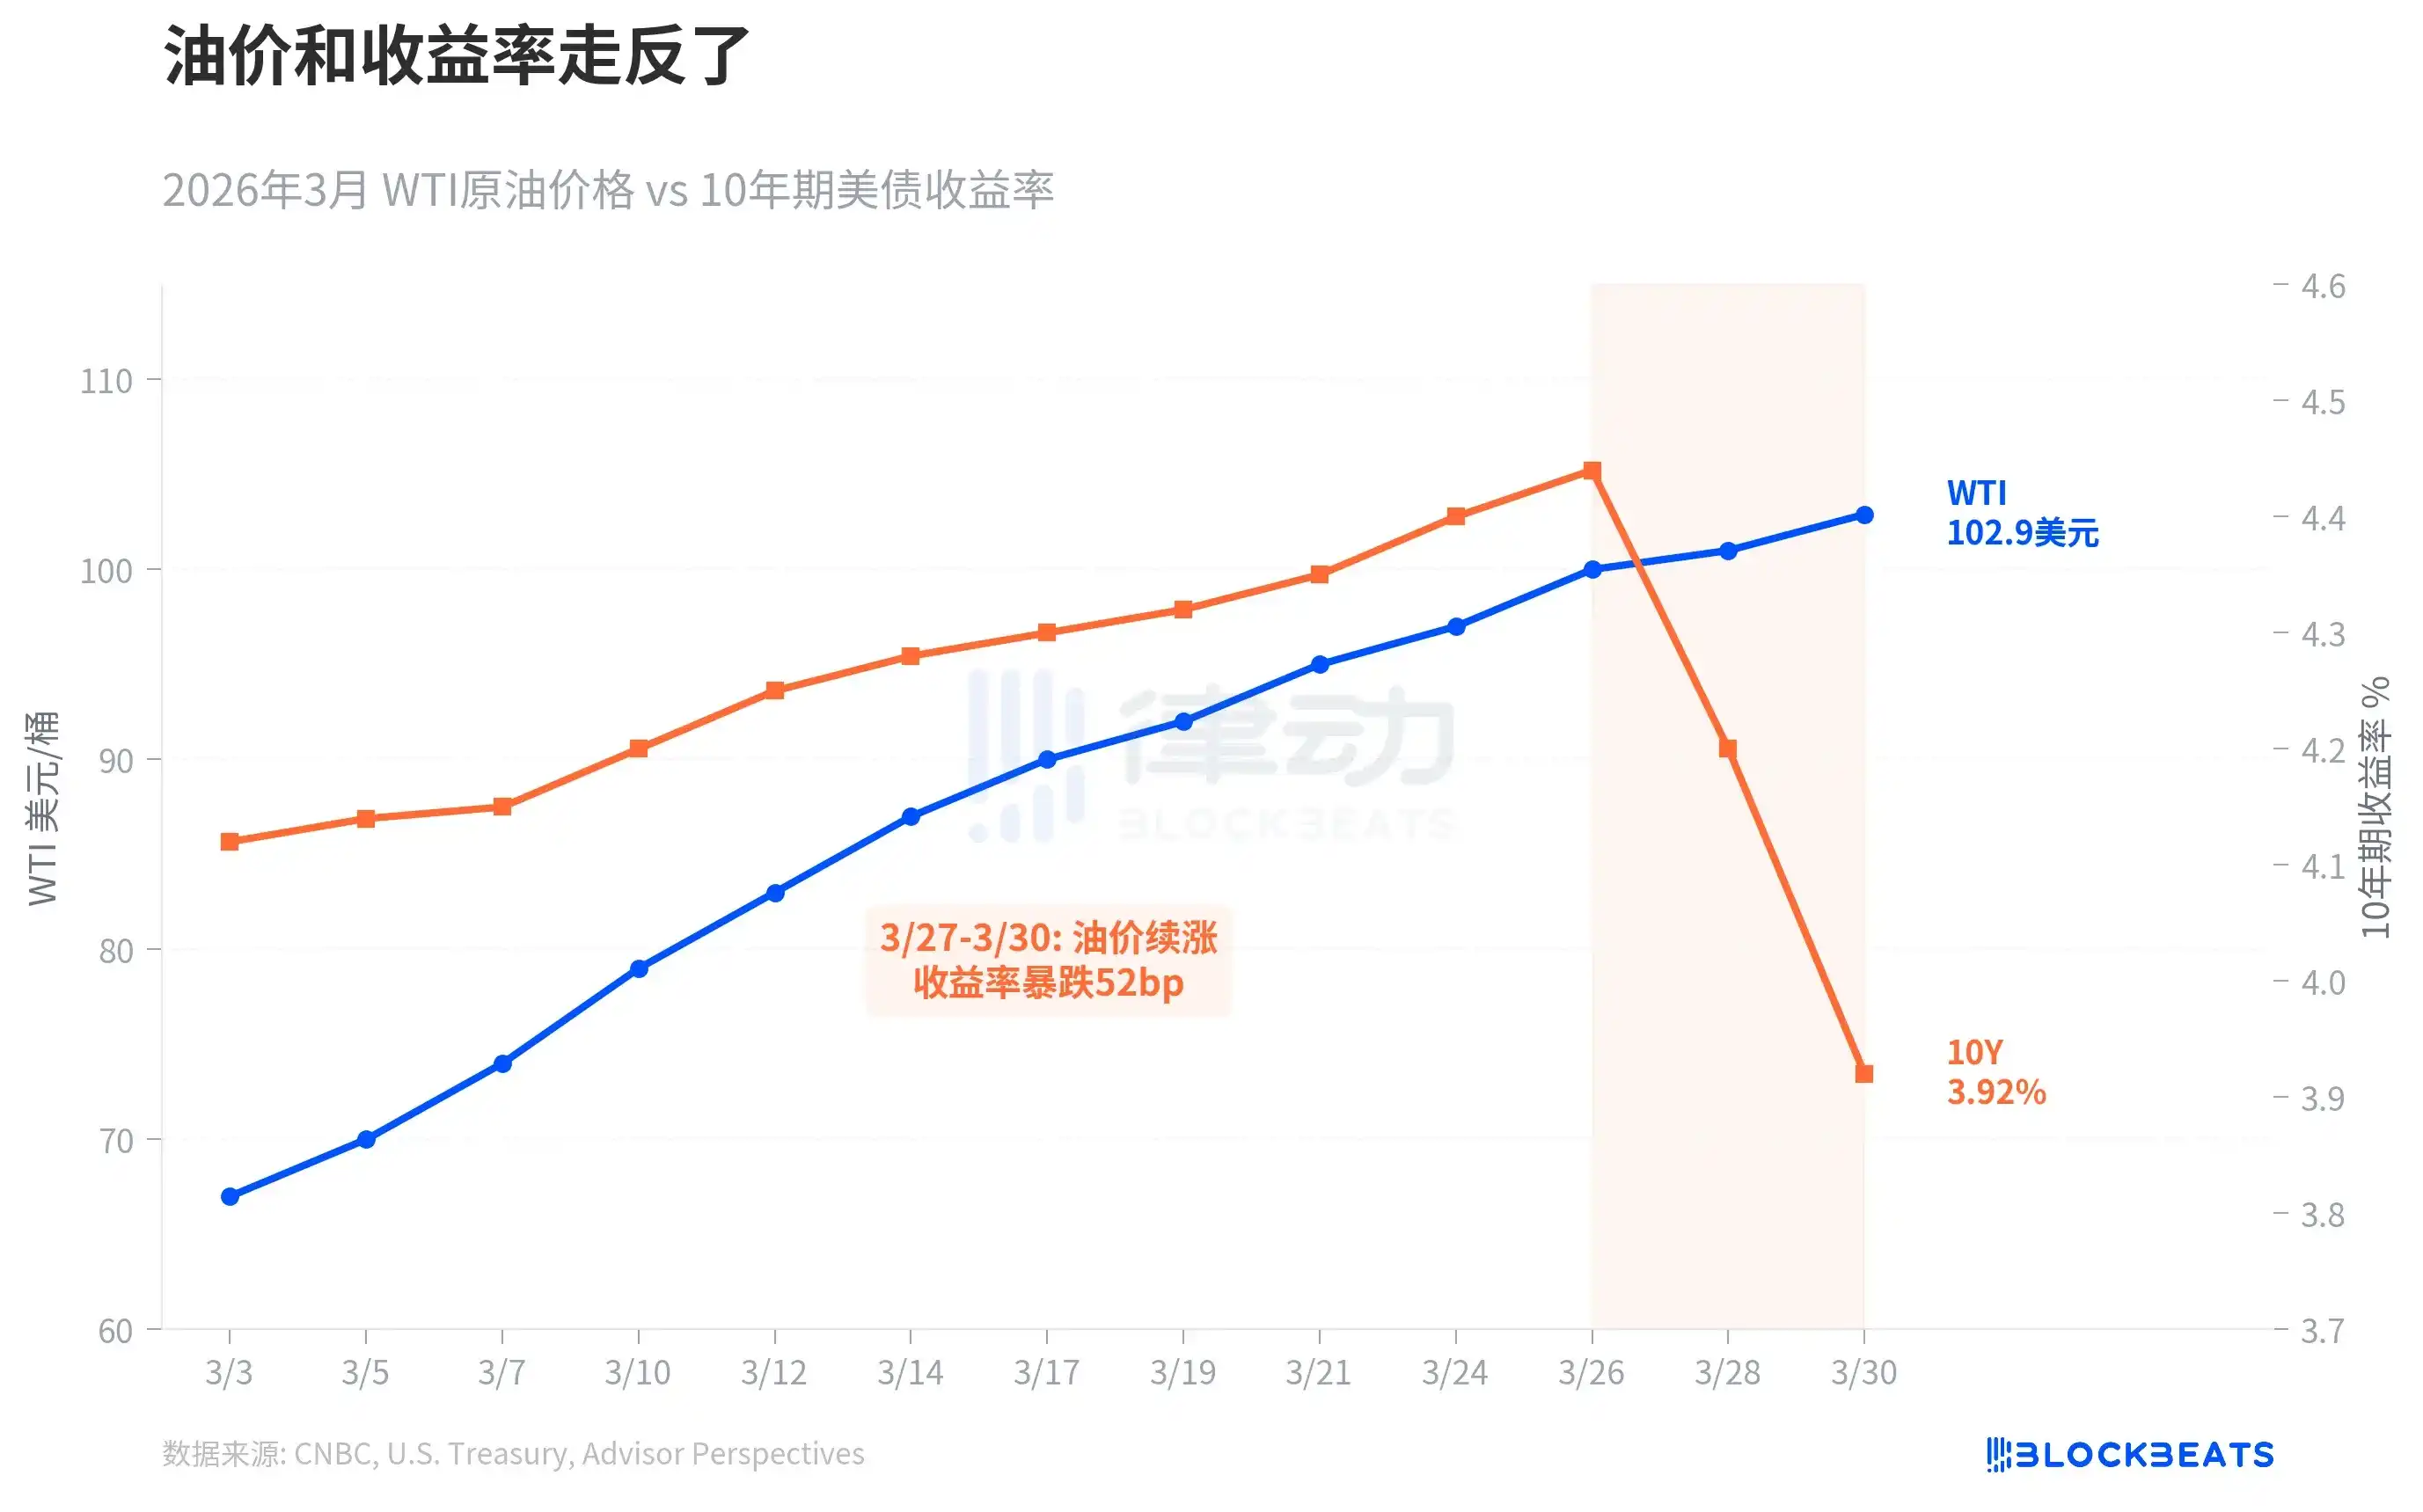
In the first three weeks of March, the two were still moving upward in sync. WTI rose from $67 to $100, while the 10-year yield climbed from 4.15% to 4.44%. The turning point occurred between March 27 and 30: oil prices continued to surge, but the yield plummeted from 4.44% to 3.92%, dropping 52 basis points in three trading sessions and breaking through the psychologically significant 4% level.

This was a classic "flight to safety," with the bond market making a judgment: growth risks have now outweighed inflation risks. As the economic firm Oxford Economics put it, "growth risks began to outweigh inflation risks." In other words, the market is not unafraid of inflation; it is more afraid of a recession.

This decoupling is not common, but whenever it occurs, the subsequent story tends to be unfavorable.
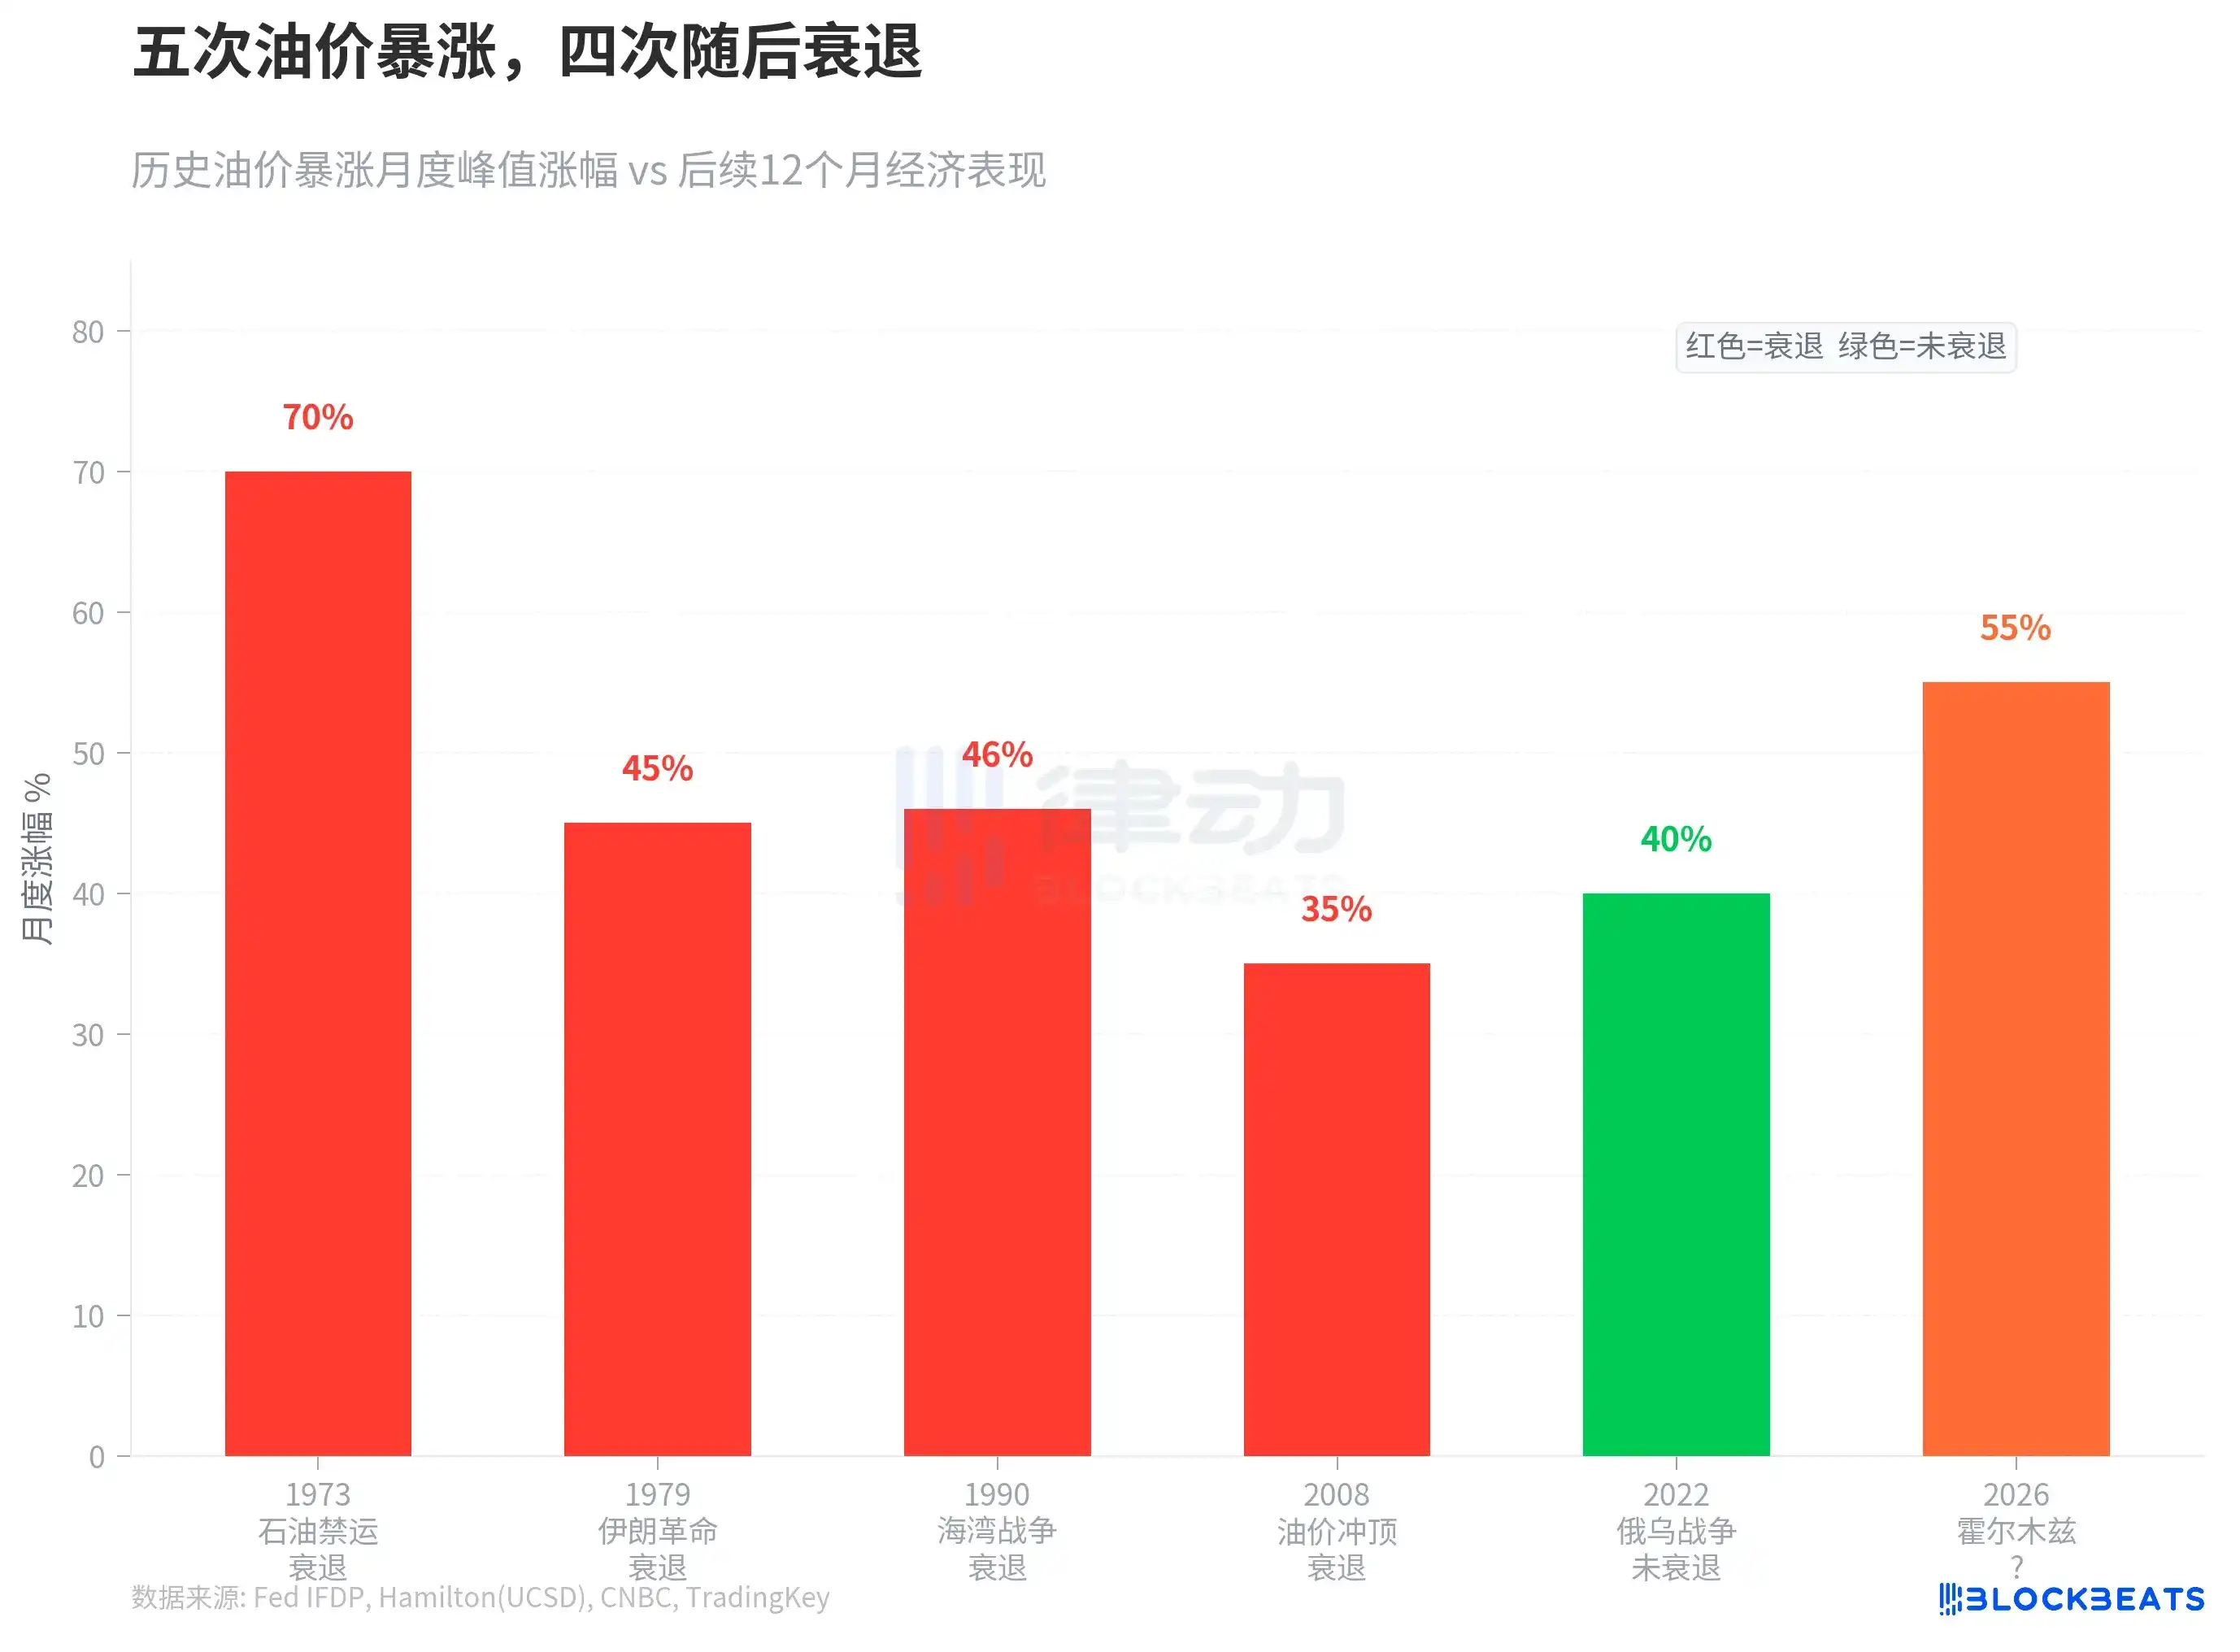
Over the past half-century, there have been five instances where oil prices surged more than 35% in a short period. During the 1973 oil embargo, U.S. GDP subsequently fell by 4.7%. The 1979 Iranian revolution caused global GDP to deviate from trend growth by 3 percentage points. The 1990 Gulf War led to a brief U.S. recession. In 2008, oil prices peaked at $147; although the primary cause of that recession was the financial crisis, the oil price shock accelerated the economic downturn. The only exception was the oil price surge driven by the 2022 Russia-Ukraine war, which did not trigger a recession but came at the cost of the most severe inflation in 40 years.

The surge in March 2026 exceeded all the above cases. According to research by Federal Reserve economist James Hamilton, there is no mechanical link between oil price shocks and recessions, but "the greater the net increase in oil prices, the more significant the suppression of consumption and investment." Goldman Sachs has raised the probability of a U.S. recession to 30%, while consulting firm EY-Parthenon puts the figure at 40%.

The market's reaction speed was also unusually fast.
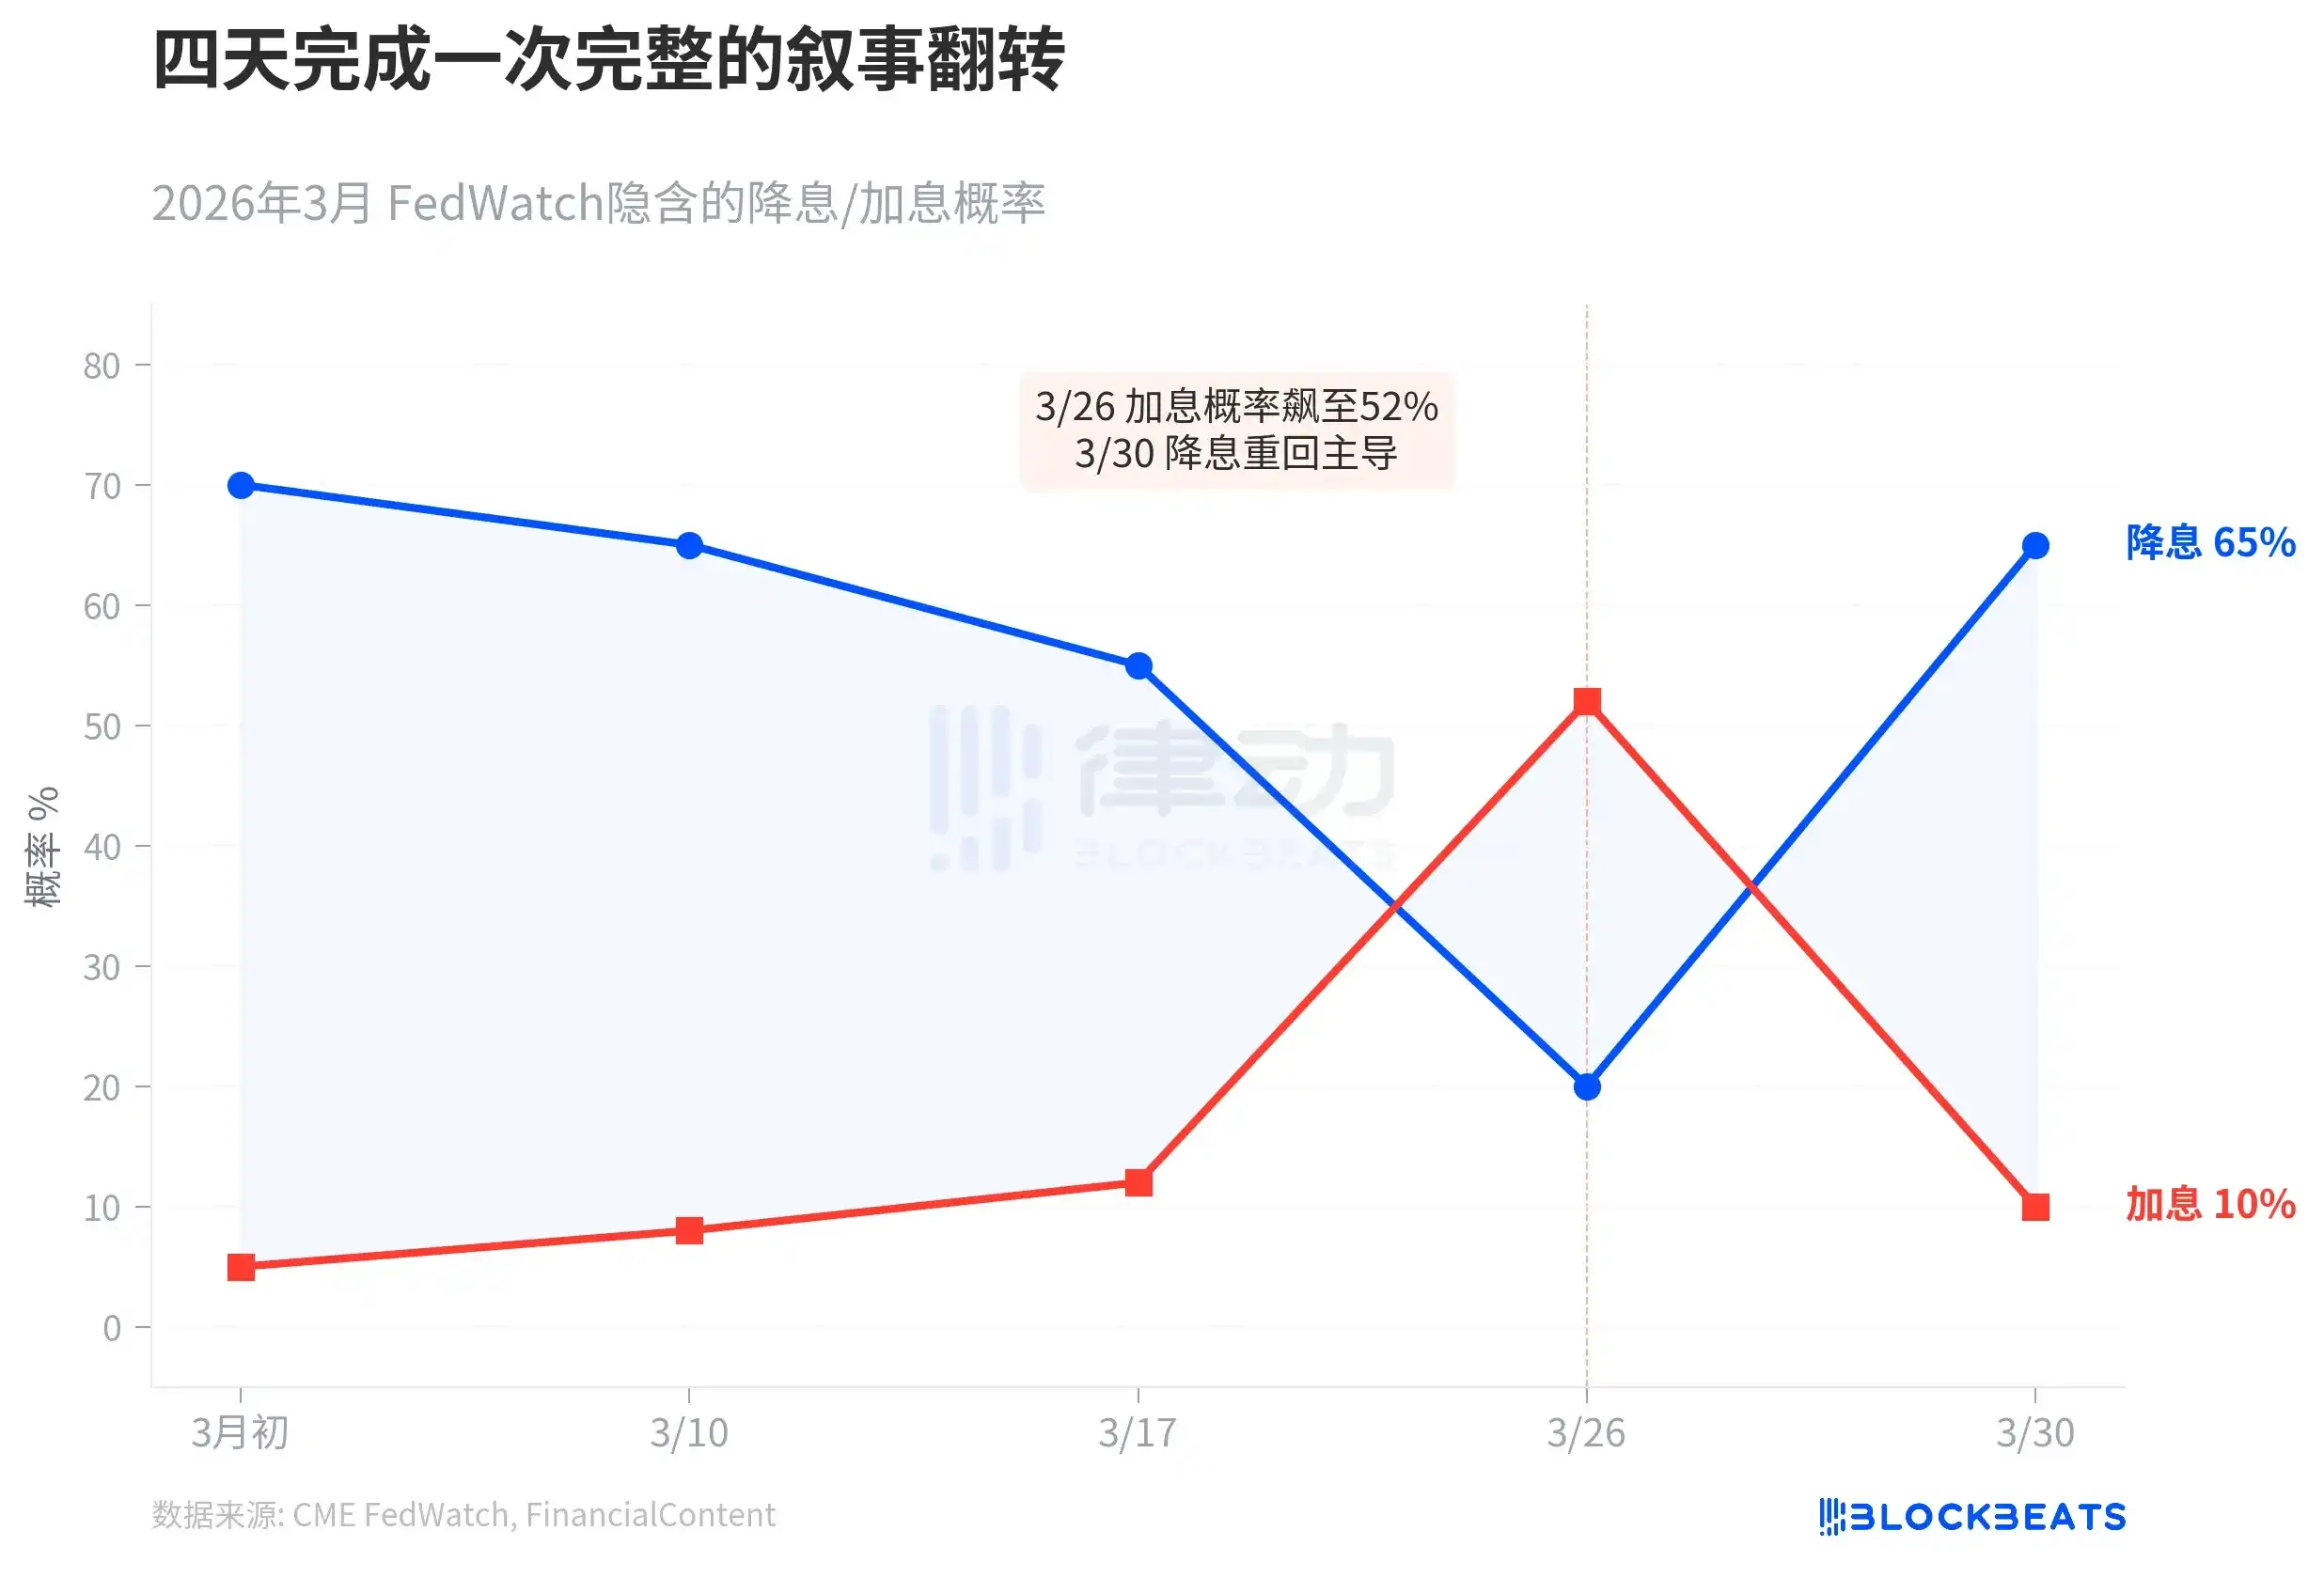
In early March, CME FedWatch showed the market expected three rate cuts for the year, with a 70% probability of a cut in June. Then, as oil prices continued to climb, the U.S. import price index jumped 1.3% on March 26, and incoming Fed Chair Kevin Warsh hinted that the neutral rate might be higher. That day, the probability of a rate hike within the year soared to 52%, and the 10-year yield touched 4.35%. FinancialContent defined this day as "The Great Hawkish Pivot."

Four days later, the narrative completely flipped. On March 30, consumer confidence data fell sharply, manufacturing unexpectedly contracted, and the 10-year yield plummeted to 3.92%. According to FinancialContent, market bets on a dovish pivot by the Fed in May rose to 65%. Goldman Sachs said the market had bet wrong on the direction of rate hikes. That same day, Powell told undergraduates at Harvard that the Fed "has not yet reached the moment where it must decide whether to look through the war shock," but emphasized that "the anchoring of inflation expectations is key."

According to Axios, Powell's remarks were interpreted by the market as: the Fed neither wants to raise rates to fight inflation nor is it in a hurry to cut rates to save the economy. Instead, it is waiting to see whether this supply shock is temporary or persistent. But the bond market can wait no longer.

If history is any guide, Citi strategist McCormick put it most bluntly: what lies ahead is stagflation, which is bad for bonds and bad for stocks.
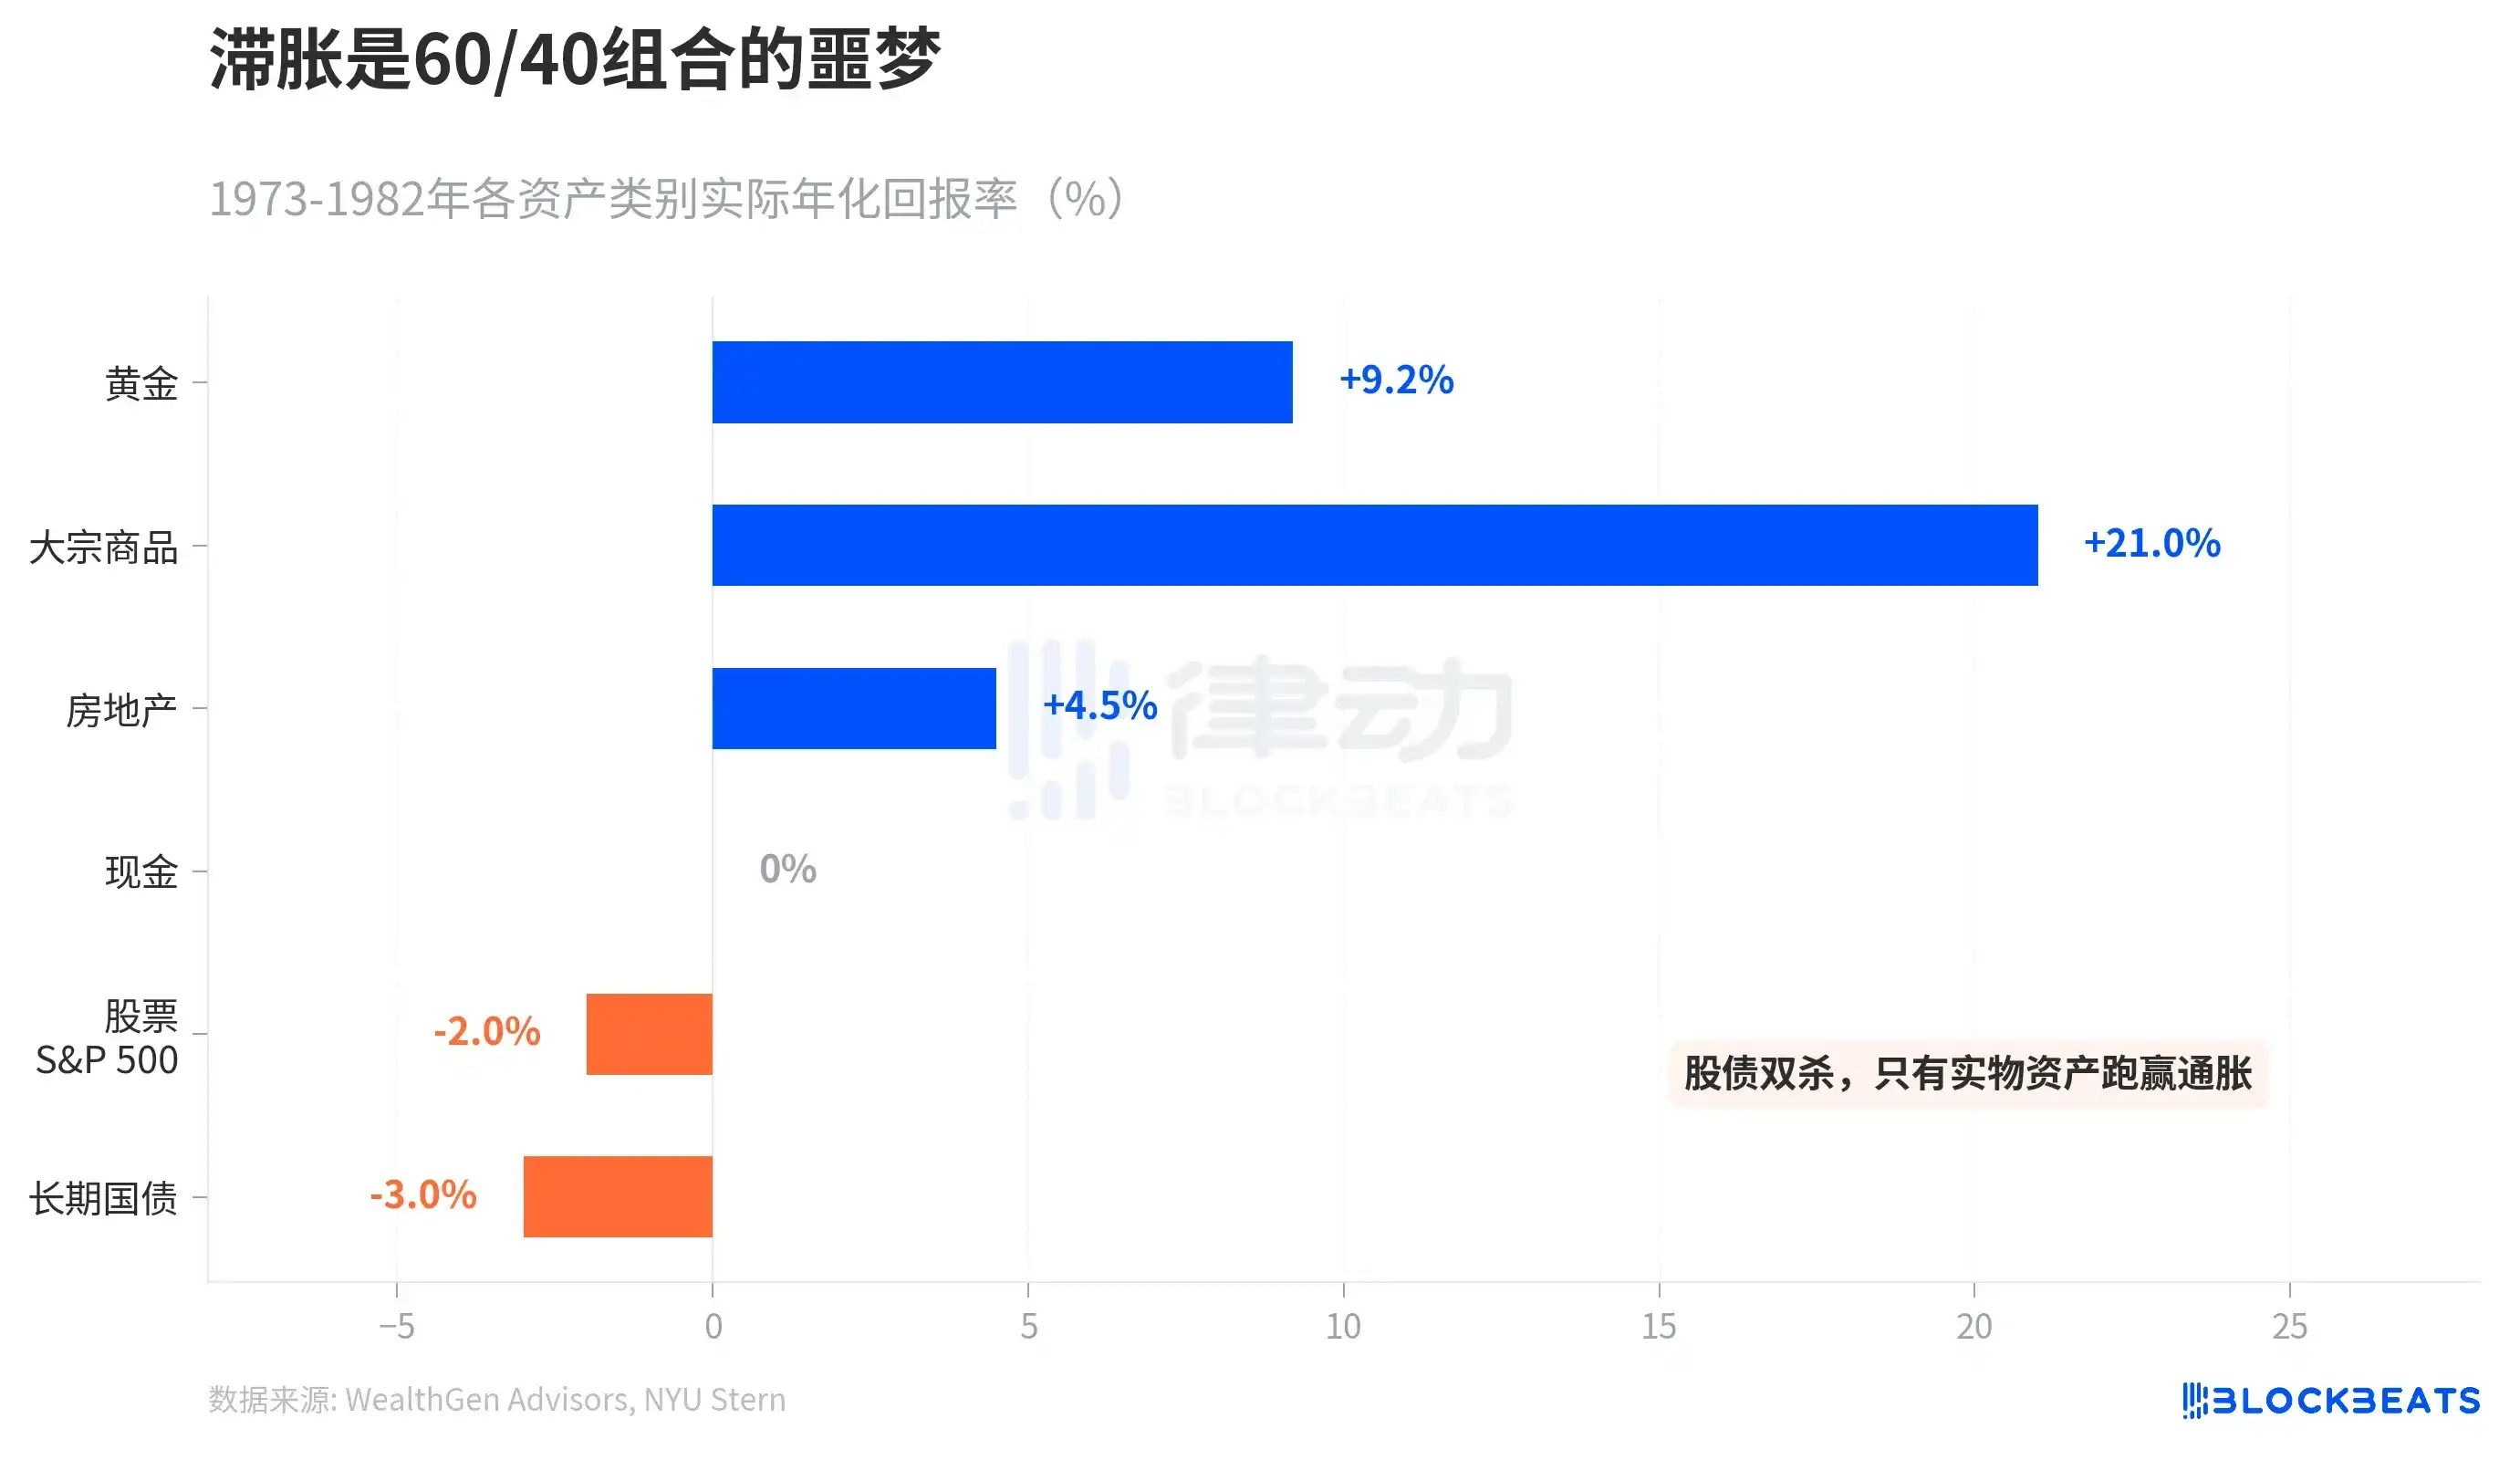
The Great Stagflation from 1973 to 1982 delivered a report card on asset returns. Gold delivered an actual annualized return of +9.2%, the commodities index (S&P GSCI) surged 586% over the decade, and real estate gained +4.5%. In contrast, the S&P 500's actual annualized return was -2%, and long-term Treasuries returned -3%. According to NYU Stern historical data, long-term Treasuries suffered a -8.6% loss in 1979 alone.

The traditional 60/40 investment portfolio (60% stocks + 40% bonds) was caught in a squeeze during stagflation. Only physical assets outperformed inflation. Société Générale predicts Brent will average $125 in April, with a "credible peak" of $150. Goldman Sachs is slightly more moderate, forecasting an April average of $115, but assuming the Strait of Hormuz reopens within six weeks, falling to $80 by year-end.

The bond market has already made a choice for everyone: between inflation and recession, it is betting on recession.


Domande pertinenti

QWhy did the 10-year Treasury yield fall sharply despite the surge in oil prices in late March 2026?

AThe bond market experienced a 'flight to safety', with growth risks (fear of recession) beginning to outweigh inflation risks, causing investors to rush into bonds and push yields down.

QWhat historical precedent suggests about the economic outcome following such a sharp oil price increase?

AHistorical cases (1973, 1979, 1990, 2008) show that sharp oil price surges of over 35% were often followed by economic recessions or significant slowdowns, with the exception of the 2022 Ukraine war spike which caused high inflation instead.

QHow did the market's expectation for Federal Reserve policy change dramatically within a few days?

AOn March 26, market pricing indicated a 52% probability of a rate hike due to inflation concerns, but by March 30, it had flipped to a 65% probability of a dovish pivot and rate cuts due to weak consumer confidence and manufacturing data.

QWhat is the potential worst-case macroeconomic scenario feared by the market, according to a Cit strategist?

ACit strategist McCormick stated that the worst-case scenario ahead is stagflation, which is bad for both bonds and stocks.

QWhich asset classes historically performed well during the 1973-1982 stagflation period, according to the article?

ADuring the 1973-1982 stagflation, gold delivered a +9.2% real annualized return, the S&P GSCI commodity index rose 586% cumulatively, and real estate returned +4.5%. In contrast, stocks and long-term bonds had negative real returns.

Letture associate

In Conversation with Ray Dalio: We Are Currently in an AI Bubble, with 1% of My Portfolio in Bitcoin

Ray Dalio, founder of Bridgewater Associates, warns in an interview that the current AI boom shows classic bubble characteristics, which could lead to significant economic downturns as seen in past cycles like 1929 or 2000. He explains that speculative enthusiasm, fueled by debt and overvaluation, often precedes a crash when rising rates or taxation force asset sales, causing widespread losses and recession. Dalio also outlines his "Big Cycle" theory, describing an approximate 80-year pattern where widening wealth gaps, massive government deficits, and shifting geopolitical power (like China's rise) create internal conflict and global instability. He emphasizes that we are in a late-cycle, transitional phase where traditional powers like the US and UK face decline. For personal wealth protection, Dalio advises diversification beyond cash into assets like stocks, bonds, real estate, and particularly gold, which he prefers over Bitcoin. While he holds about 1% of his portfolio in Bitcoin as a non-printable hard asset, he views gold as more secure from technological or governmental threats. Regarding AI's impact, Dalio believes it will disproportionately benefit capital owners, worsening inequality by replacing both physical and cognitive labor. He suggests that human intuition and emotional intelligence, combined with AI, will be key for future workers. On taxation, Dalio argues that wealth taxes are impractical and risk triggering asset sell-offs, reducing productive investment. He points to the UK as a cautionary example of debt, low productivity, and political strife. Geopolitically, Dalio foresees a more regionalized world, with the US showing weakness in prolonged conflicts like with Iran, akin to past imperial declines. The ideal outcome, he suggests, is coexisting powerful blocs (e.g., Americas, China-Asia Pacific) without major war.

marsbit24 min fa

In Conversation with Ray Dalio: We Are Currently in an AI Bubble, with 1% of My Portfolio in Bitcoin

marsbit24 min fa

Daily 7.2 Trillion KRW: Foreign Capital's Record Net Buying on Friday! Wall Street Says Headwinds for Korean Stock Fund Flows Have Subsided

South Korean stock market sees a dramatic shift in fund flows. On July 31, foreign investors made a record net purchase of approximately KRW 7.2 trillion in KOSPI stocks, marking a fundamental reversal from the persistent large-scale net outflows seen in previous months. This contributed to a significant narrowing of foreign net selling in July to KRW 9.8 trillion, down sharply from KRW 48.4 trillion in June and KRW 44.5 trillion in May. Simultaneously, domestic institutional pressure eased. South Korean pension funds and asset managers turned to a net buying position in July, purchasing KRW 1.0 trillion worth of KOSPI shares, contrasting with net sales in May and June. Market volatility is expected to be dampened by new financial regulations. Effective July 31, the Financial Services Commission tightened access for retail investors to single-stock leveraged ETFs by raising the minimum cash deposit requirement. Trading volumes for these products subsequently dropped to about 50% of their monthly average. Citigroup Research maintains its year-end KOSPI target of 10,000 points. The firm cites several supportive factors: the substantial easing of headwinds from capital outflows, a robust fundamental outlook for the semiconductor sector, historically low market valuations, strong economic fundamentals, and the potential for policy support from financial authorities if needed.

marsbit24 min fa

Daily 7.2 Trillion KRW: Foreign Capital's Record Net Buying on Friday! Wall Street Says Headwinds for Korean Stock Fund Flows Have Subsided

marsbit24 min fa

Thanks to Dice Rolls, Bitcoin Keys Are Stored Offline, But Not Everyone Will Do It

The article discusses using dice rolls to generate secure Bitcoin wallet seeds, providing entropy independent of potentially flawed hardware random number generators. It explains that each fair dice roll offers about 2.585 bits of entropy, with around 50 rolls needed for a standard 12-word seed phrase and 99+ recommended for higher security. This method gained attention after a vulnerability was revealed in some Coldcard hardware wallets, where a faulty firmware RNG (dating back to 2021) compromised generated keys. The analysis notes that while a dice-generated main seed was safe from this specific flaw, other Coldcard functions (like creating paper wallets, backup keys, or passwords) could still be vulnerable if they used the defective RNG. The piece argues that while dice-based entropy is technically robust, the manual process is error-prone, tedious, and unrealistic for most new users, who might make mistakes in recording or inputting rolls. It concludes that while manual entropy generation should remain an option for advanced users, the long-term goal is to develop reliable, user-friendly hardware and software that securely generates randomness without requiring specialized knowledge. Coldcard users are advised to check their firmware version and replace any secondary secrets (like paper wallet keys) created with vulnerable devices, while also considering multi-signature setups with devices from different manufacturers for added security.

cryptonews.ru5 h fa

Thanks to Dice Rolls, Bitcoin Keys Are Stored Offline, But Not Everyone Will Do It

cryptonews.ru5 h fa

Trading

Spot
活动图片




