Editor's Note: This article argues that the global oil market has crossed a "tipping point." From now on, the issue is no longer whether oil prices will continue to rise, but how the actual supply gap will manifest—whether through accelerated declines in crude oil inventories, shortages of refined products, or through policy measures to suppress demand.
The core logic of the article is built on an underestimated variable in the market: time mismatch. Even if the Strait of Hormuz resumes navigation in the short term, the delays in tanker turnover caused by previous transportation disruptions will continue to erode onshore inventories for weeks to come. This means that supply issues will not be immediately resolved with the "resumption of navigation" but will be reflected in inventories and the spot market with a lag.
Against this backdrop, refinery behavior becomes a key amplifier. The reduction in refinery utilization rates in Asia and Europe does not mean that end-user demand has weakened simultaneously. Instead, it will first compress refined product inventories, push up product prices, and then force refineries to resume operations, forming a self-reinforcing cycle: high oil prices → compressed margins → destocking → margin recovery → increased utilization. This mechanism makes it difficult for the market to achieve rebalancing through conventional supply-demand adjustments in the short term.
A more impactful judgment is that if the strait remains closed beyond April, traditional oil price frameworks will become ineffective. The market will no longer face cyclical price increases but an extreme scenario approaching "physical shortages"—in such a state, prices are no longer an effective regulatory tool, and price caps lose their reference value. What can truly bring the market back into balance is not the restoration of supply but "policy-driven demand suppression," similar to what occurred during the pandemic.
Therefore, $95 per barrel is far from sufficient to rebalance the oil market. Against the backdrop of escalating geopolitical conflicts, what deserves more attention in the future is not the oil price itself but changes in inventories, policy signals, and the pace of passive demand contraction.
Below is the original text:
Please read the article "The Tipping Point of the Oil Market."
Related reading: "Oil Prices Are Approaching a Tipping Point; What Will Happen in Mid-April?"
In our report released on March 25, we outlined several scenarios and pointed out that the oil market's tipping point would occur in mid-April. Now, that tipping point has passed.
From this moment on, the daily supply disruption of 11 to 13 million barrels will manifest in one of the following three forms:
1) A decline in crude oil inventories;
2) A decline in refined product inventories;
3) Demand destruction.
If you are unfamiliar with the logistics mechanisms or logic behind this, let me break it down for you.
The so-called "tipping point" in the oil market corresponds to the last batch of crude oil shipped from the Persian Gulf to end-users. Once these tankers complete unloading onshore and no further unloading is possible, onshore crude oil inventories will begin to be drawn down. (For more details on onshore inventory calculations, refer to our previous analysis.)
Currently, global refinery shutdowns exceed approximately 5 million barrels per day, with about 3 million barrels per day concentrated in the Middle East. Refineries in Asia and Europe are also reducing utilization rates, but refinery cuts do not mean that end-user demand has already declined.
The reduction in refinery utilization rates will accelerate the drawdown of refined product inventories, thereby pushing up product prices. This process, in turn, will improve refining margins and stimulate refineries to increase utilization rates.
This cycle will play out repeatedly in the coming weeks: rising crude oil prices → compressed refining margins → reduced refined product supply → declining refined product inventories → recovering refining margins → increased utilization rates → further rises in crude oil prices.
In the spot market, this "game" will unfold between traders holding inventories and refineries without inventories. Of course, this situation can only last until onshore crude oil inventories are depleted, and that point is not far off.
By the first week of May, the only countries in Asia with significant crude oil inventory buffers will be Japan and China. Other countries will have to scramble for spot crude oil. If the Strait of Hormuz remains closed by then, you will see refineries going to any lengths to secure the crude they need—because the alternative is shutdown.
For Europe, crude oil shortages will also emerge within the same timeframe. By then, U.S. crude oil exports will approach 5.5 million barrels per day, OECD crude oil inventories will fall to the minimum operating levels, and the remaining inventories will be concentrated mainly in the United States.
We estimate that by the end of July, U.S. commercial crude oil inventories will fall below about 400 million barrels, approaching the minimum operating level (approximately 370 to 380 million barrels). This estimate also includes the release of about 139 million barrels from the Strategic Petroleum Reserve (SPR).
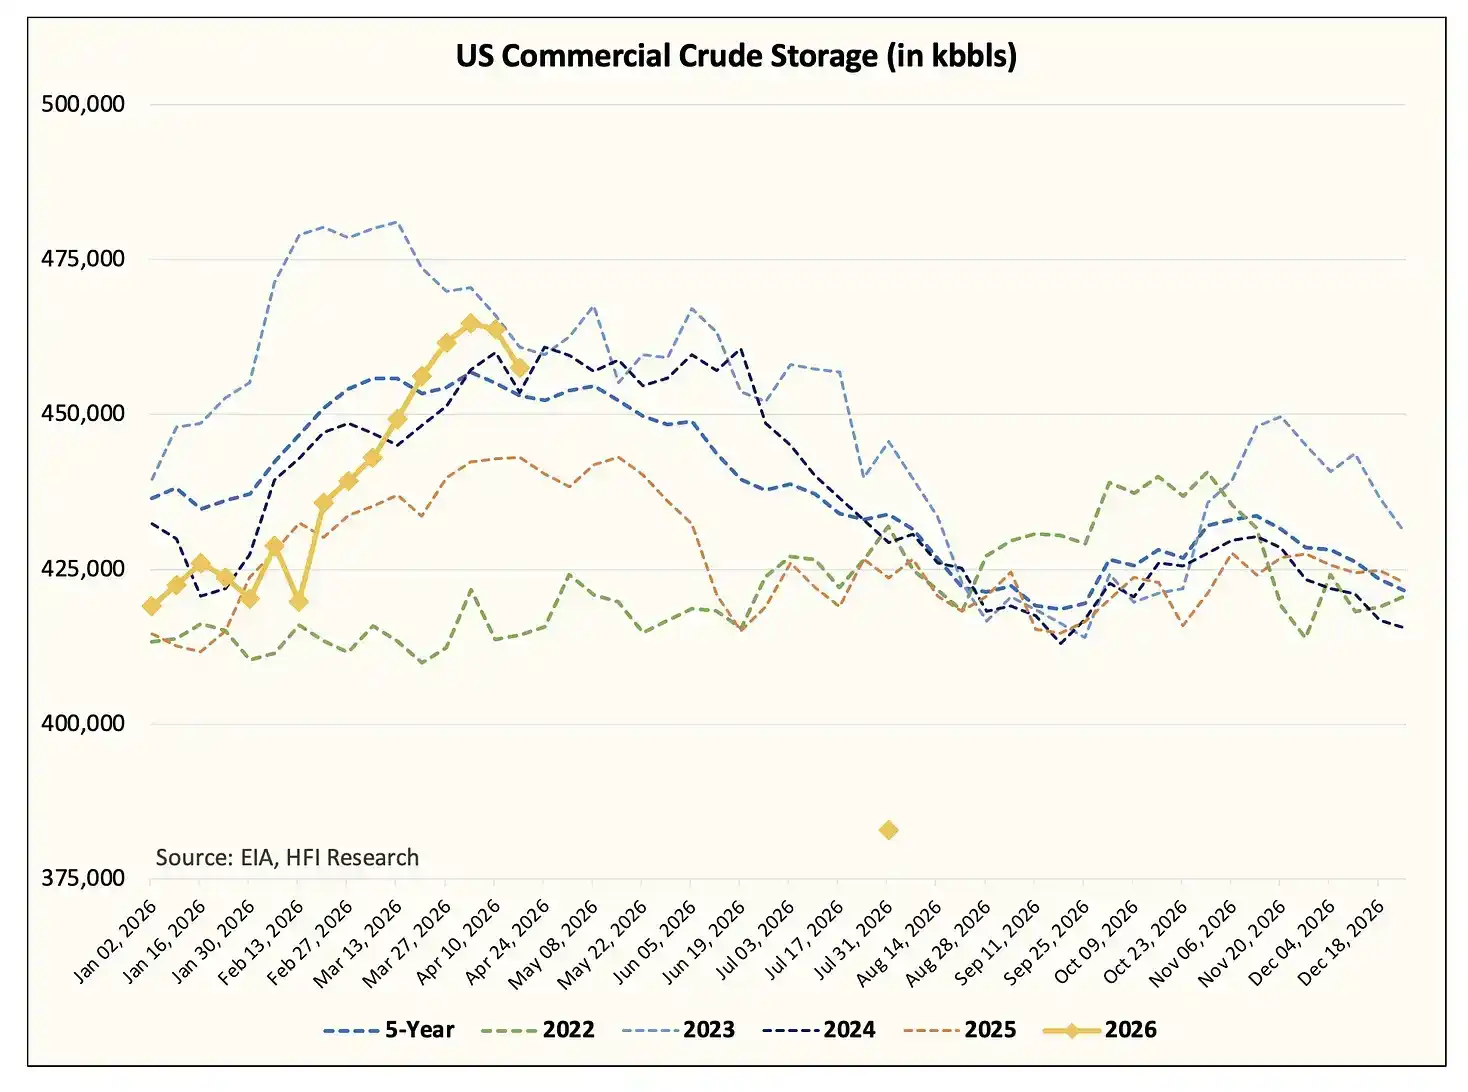
In the coming period, the Trump administration will likely have to impose restrictions on both crude oil and refined product exports. We judge that the Trump administration will most likely first restrict refined product exports; if U.S. refineries begin to reduce utilization rates due to compressed margins, crude oil exports may then be further restricted—which would be an extremely negative scenario for U.S. shale oil and Canadian oil producers (we will elaborate on this in subsequent analysis).
It is important to emphasize that all the above changes will occur regardless of whether the Strait of Hormuz reopens. Even if the U.S. and Iran reach an agreement and unconditionally resume navigation through the Strait of Hormuz, the drawdown of onshore crude oil inventories will still be inevitable.
Reiterating the Logic
Suppose a ceasefire is reached by this Tuesday, along with a long-term peace agreement.
The floating inventory in tankers at sea is currently about 160 million barrels, and this crude will begin unloading rapidly. However, it will take 30 to 40 days for these tankers to complete transportation and unloading; after that, the journey back will take an additional 20 days or so.
At the same time, there are about 70 VLCCs (Very Large Crude Carriers) heading to the U.S. to load crude oil and transport it to Asia. The loading cycle for these tankers is about 6 to 8 weeks, transportation to Asia takes 45 to 50 days, and unloading and returning through the Strait of Hormuz takes another 20 to 25 days. In other words, this fleet will not be able to form effective return capacity for at least the next 3 months.
To alleviate the current backlog of onshore inventories in the Middle East, at least 100 VLCCs would need to be involved in transportation. The current onshore inventory is about 600 million barrels, and for oil-producing countries to resume production, inventories need to be reduced by at least about 200 million barrels. However, given the existing transport capacity, this is physically impossible to achieve until at least mid-to-late June.
After onshore crude oil inventories are gradually released, a stable flow of tankers through the Strait of Hormuz for loading is still needed. At that stage, oil-producing countries such as Saudi Arabia, the UAE, Kuwait, Qatar, Iraq, and Bahrain can gradually resume production. This process will take several more weeks, which almost guarantees that supply shortages will persist.
According to our estimates in the March 25 "Tipping Point" report, the cumulative inventory loss due to the strait closure has reached about 1 billion barrels; by the end of April, it will expand to 1.2 billion barrels; by the end of May, 1.59 billion barrels; and by the end of June, it will approach 1.98 billion barrels.
There is not enough commercial crude oil in the market to fill a supply gap of this magnitude. Therefore, the only way to avoid systemic imbalance is through "demand destruction."
This is not a matter of judgment but simple mathematics.
The Geopolitical Issue
I have never liked geopolitics—it is full of uncertainty, lacks safety margins, is rife with gray areas, and rarely offers clear black-and-white distinctions. But on the issue of the Iran conflict, the situation seems to be heading toward an extreme of "either-or."
My friend PauloMacro recently recommended that I read the research of Professor Robert Pape, author of "The Escalation Trap." I have systematically read his related views over the past two months. He recently published an article, "Why the Ceasefire Keeps Failing," which is worth reading.
From my personal observation, everything that happened this weekend seemed almost straight out of a horror movie.
Since the conflict broke out at the end of February, most tankers have chosen to stay put and wait. There was a previous market narrative that the Strait of Hormuz was shut down due to insurance失效. I agreed with this assessment early in the conflict, but as events unfolded, especially everything that happened this weekend, I was shocked.
The Islamic Revolutionary Guard Corps (IRGC) effectively enforced a blockade by force, directly threatening tankers with firing. We see this clearly from tanker activity. Since we began tracking tanker movements, this is the first time we have seen such a large-scale collective U-turn of tankers. In the past, there were occasional one or two tankers changing course, but nothing on the scale seen this weekend.
In my view, this sends two signals: First, the IRGC has firmly taken control of the Strait of Hormuz; second, this conflict is likely to get worse before it gets better. Judging from the conditions set by the IRGC and Iran, it is almost impossible for the U.S. to accept them, so there is extremely limited room for maneuver in reality. To fundamentally resolve this issue, it恐怕 can only be "truly resolved"—you should understand what I'm暗示. I fear the worst is yet to come, and I say this not to be alarmist.
Scenarios for the Oil Market
In the previous article discussing the oil market's "tipping point," we pointed out that if the Strait of Hormuz could resume navigation by the end of April, Brent crude prices would "fall back" to $110 per barrel; today it is trading at $95.
But as I have already explained, the oil market has crossed the tipping point. The large-scale inventory drawdown that follows will jolt the market awake. I suspect that only when financial market participants亲眼 see actual crude oil shortages occurring will they realize that this supply disruption is not an illusion. Until then, most people will be unable to accept this reality.
That's the fact.
If the Strait of Hormuz reopens after April, we will no longer be able to provide accurate oil price predictions. Because by then, the market will have crossed a point of no return. This would become the largest supply disruption in the history of the oil market, roughly four times the size of previous records. In such a scenario, traditional fundamental pricing theories lose meaning, as "absolute shortage" cannot be measured by price. Once a market has no fuel available, it is simply "cut off."
At what price will that last marginal barrel of crude trade? I don't know, and I don't think anyone is smart enough to know the answer.
But what I do know is that demand destruction will inevitably arrive. For those watching oil, what will truly "kill" demand will be policy announcements. To balance the global supply disruption of about 11 to 13 million barrels per day, a demand slump on the scale of the pandemic lockdowns must occur.
And even in such an extreme scenario, the market would only barely achieve "balance," not shift into surplus. But at least it would mitigate the price shock. At that point, analysts like me, the "barrel counters," will be able to judge when the true fundamental turning point arrives.
So, to summarize in a few sentences: If the Strait of Hormuz remains closed after April, I don't know how high oil prices will go, but it certainly won't be $95 per barrel. Policy-driven demand destruction will rebalance the oil market, but it will only prevent inventories from deteriorating further.
We have established a market signal system to monitor when this turning point arrives.
Conclusion
The oil market's tipping point has arrived. Global onshore crude oil inventories will decline sharply, and the pace will be faster than ever seen before. U.S. crude oil inventories are the last to begin declining, and we will see this in next week's EIA inventory report. Once the market亲眼 sees a clear decline in onshore inventories, prices will quickly jump to new levels.
If the Strait of Hormuz does not resume navigation after the end of April, no one can tell you where the top for oil prices is. By then, the market will have彻底 crossed that line. The only way to rebalance oil prices is through demand destruction. Therefore, instead of obsessing over "how high oil prices will go," it is better to track those truly critical market signals.
But if there is only one takeaway from this article, it is this: The oil market absolutely cannot rebalance at $95 per barrel. Oil prices must rise enough to hedge against the daily supply disruption of about 11 to 13 million barrels. Governments will have to adopt mandatory demand compression policies, similar to those during the pandemic, to suppress demand. Even then, it will only offset the supply gap, not push the oil market back into surplus. From a geopolitical perspective, I fear the situation has entered a phase of "it will get worse before it gets better," as neither the U.S. nor Iran appears willing to让步.






