Author: The Microcosmic Perspective
Source: Morgan Stanley Greater China Semiconductors Research
Report Date: May 8, 2026
I. The Core Contradiction
Global AI capital expenditure is expanding beyond expectations, but compute supply is evolving from "NVIDIA's monopoly" to a three-track parallel of "GPU + ASIC + China's indigenous chips". The core contradiction is not whether demand is sufficient, but who can capture the share of this expansion cycle, and how fast non-AI semiconductors are being marginalized in this process.
II. Core Conclusions (Sorted by Trading Importance)
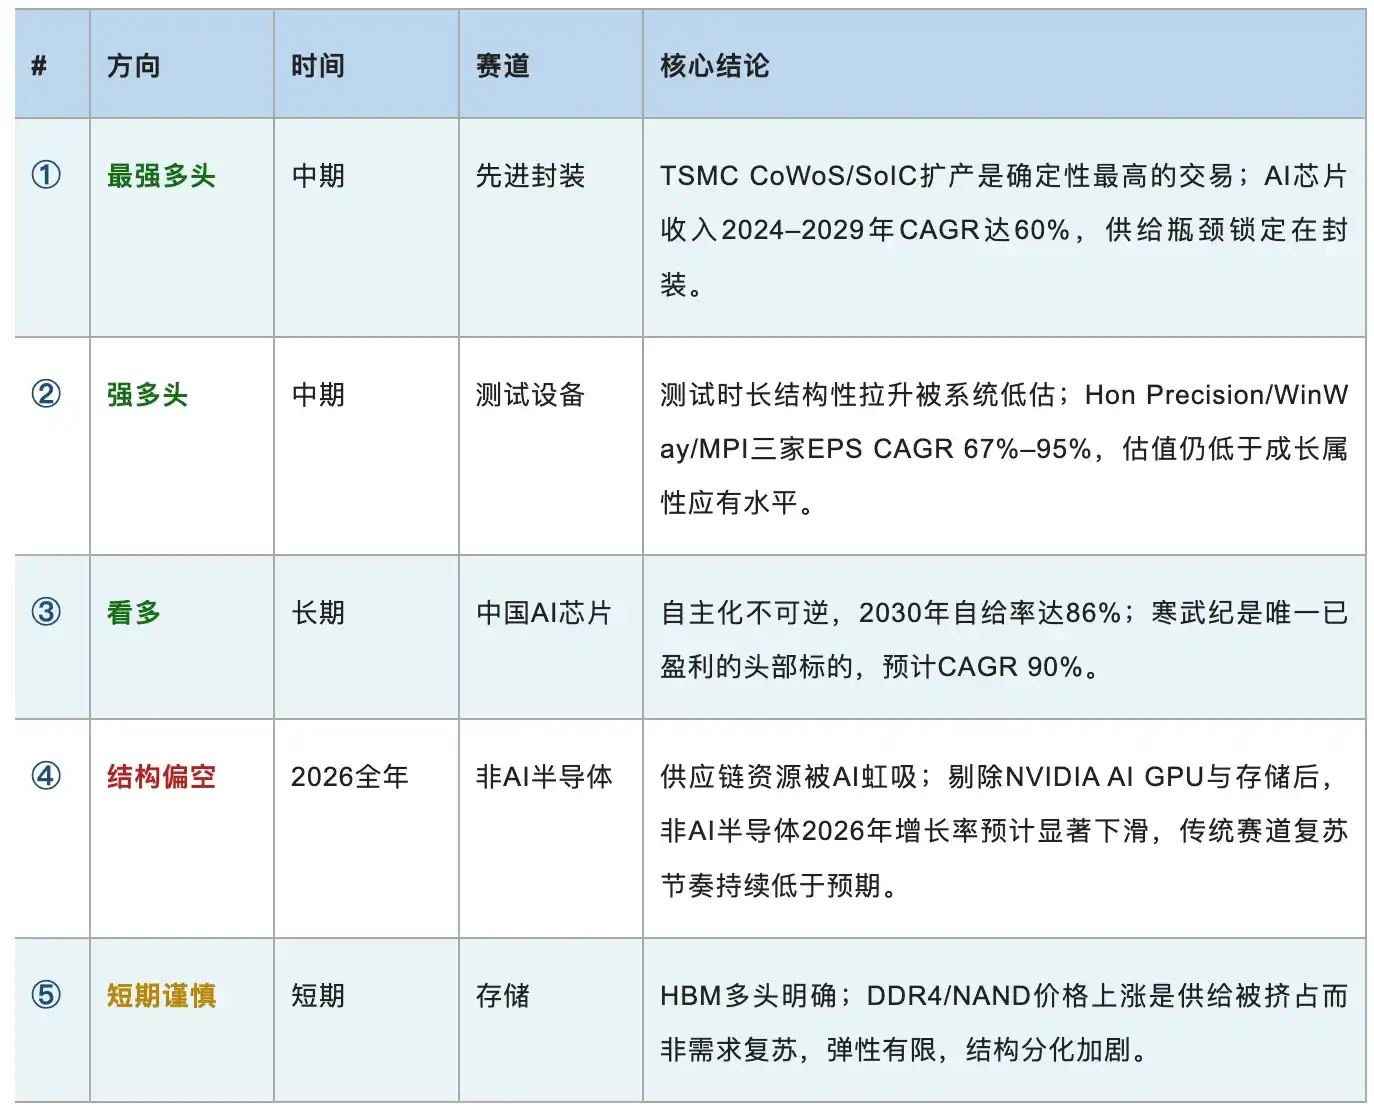
III. Deep Dive by Tracks
3.1 Advanced Packaging (CoWoS / SoIC) — The Strongest Certainty Play
Core Contradiction: Demand is exploding, but capacity is irreplaceable by anyone but TSMC; non-TSMC packaging (Amkor/ASE/UMC) faces share squeeze.
Key Driver: The four major cloud vendors' (AWS/Google/Microsoft/Meta) Q1 2026 capex increased 95% YoY; full-year cloud capex is projected to reach $685B, directly driving CoWoS/SoIC queuing demand for AI servers.
Key Data & Timeline:
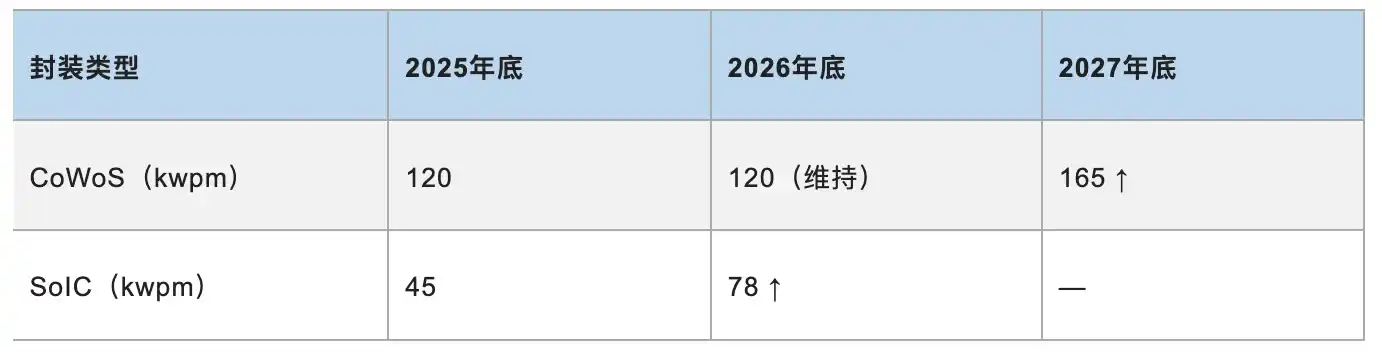
NVIDIA alone consumes ~59% of CoWoS capacity, Broadcom ~20%, AMD ~9%
·The total wafer consumption value for AI computing in 2026 is ~$27.2B, a historical peak.
·TSMC's AI chip revenue proportion CAGR from 2024–2029 reaches 60%; AI revenue exceeds 30% of total revenue in 2026.
Transmission Path:
Cloud Vendor Capex → NVIDIA/Broadcom/Google TPU orders → CoWoS/SoIC becomes bottleneck → TSMC's bargaining power increases → AI revenue proportion continues to expand.
Trading Implication:
TSMC is the main play within the main play, requires no timing, holding logic is clear. SoIC is the second growth curve starting 2025; monitor opportunities for OSAT suppliers (like ASE) entering SoIC assembly.
3.2 Test Equipment (Handler / Socket / Probe Cards) — Lowest Valuation, Most Certain Growth
【Core Contradiction】
Chip complexity is increasing, leading to a structural doubling+ of test time, but the market's revaluation of the Test Equipment TAM is severely lagging.
【Key Driver】
GPU chip test time per generation doubles (Hopper 350s → Blackwell 700-1000s → Rubin 1200-1400s → Next Gen 1800-2000s); test socket pin count jumps from mobile-level 1500 to AI/HPC-level 6000, and even next-gen 10000+.
Key Data for Three Core Stocks:
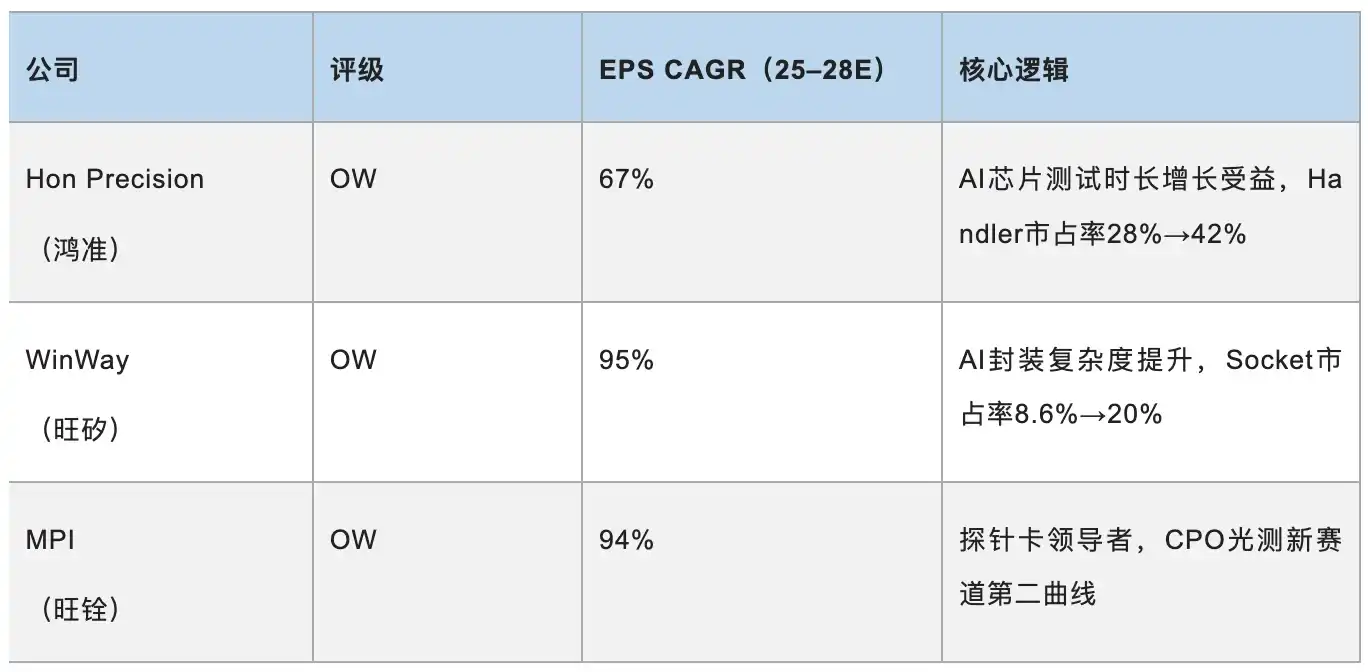
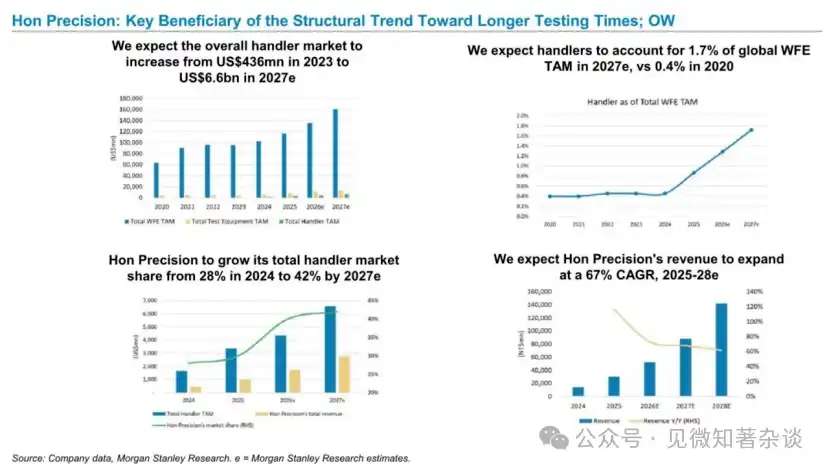
· Global Handler Market Size: $436M in 2023 → $6.6B in 2027, CAGR >35%
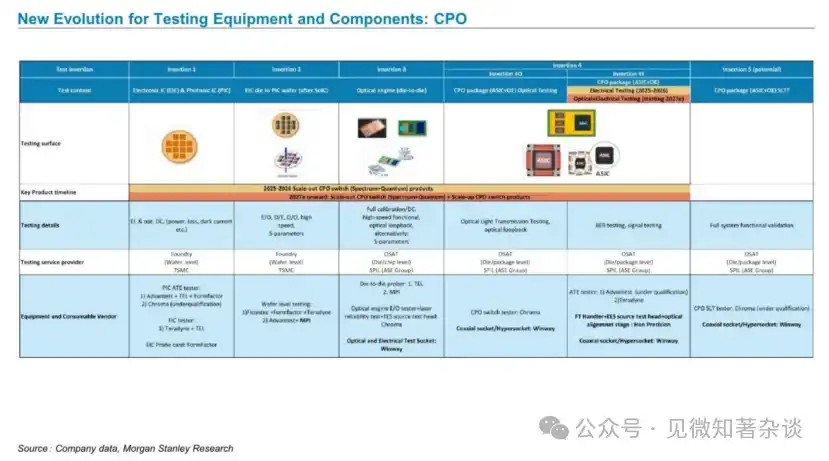
· CPO optical test demand scales from 2025, entering electrical+optical joint testing phase (Insertion 4i) in 2027.
【Transmission Path】
Chip size/layers/complexity increase → Test time increases → Handler/Socket volume and price rise → CPO optical test new demand adds on → Second growth curve initiates.
【Trading Implication】
These three companies represent the segment with the lowest valuation and highest growth certainty within the AI infrastructure chain, suitable for medium-term core allocation. Low market coverage and underpricing make this the most noteworthy value direction currently.
3.3 China AI Chips (Domestic GPU/ASIC) — Long-term Irreversible, Near-term Clear Divergence
【Core Contradiction】
Export controls are forcing domestic substitution demand, but domestic chip technology/production maturity varies widely; securing large customer orders is the core differentiator.
【Key Driver】
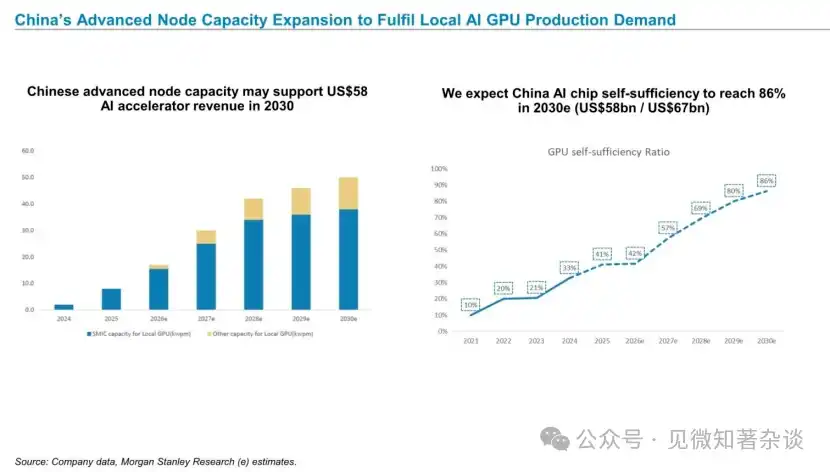
DeepSeek validates feasibility of low-cost inference → Domestic cloud vendors accelerate switching → SMIC 7nm capacity expansion supports volume production → Domestic chip TCO advantage (30-60% lower than NVIDIA) creates a positive feedback loop.
Market Size & Landscape:
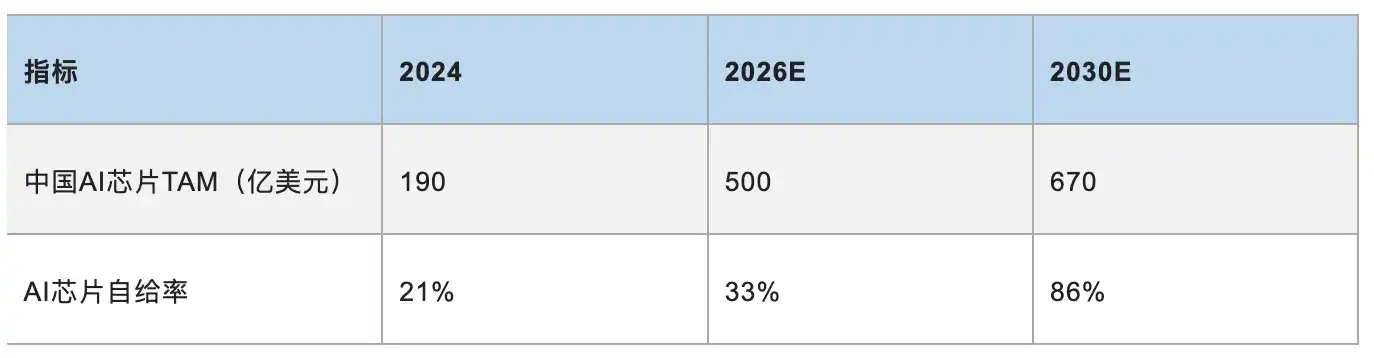
2026E Domestic Market Share: Huawei 62%, Cambricon 14%, Kunlun Xin 5%, T-Head 5%, Others 14%.
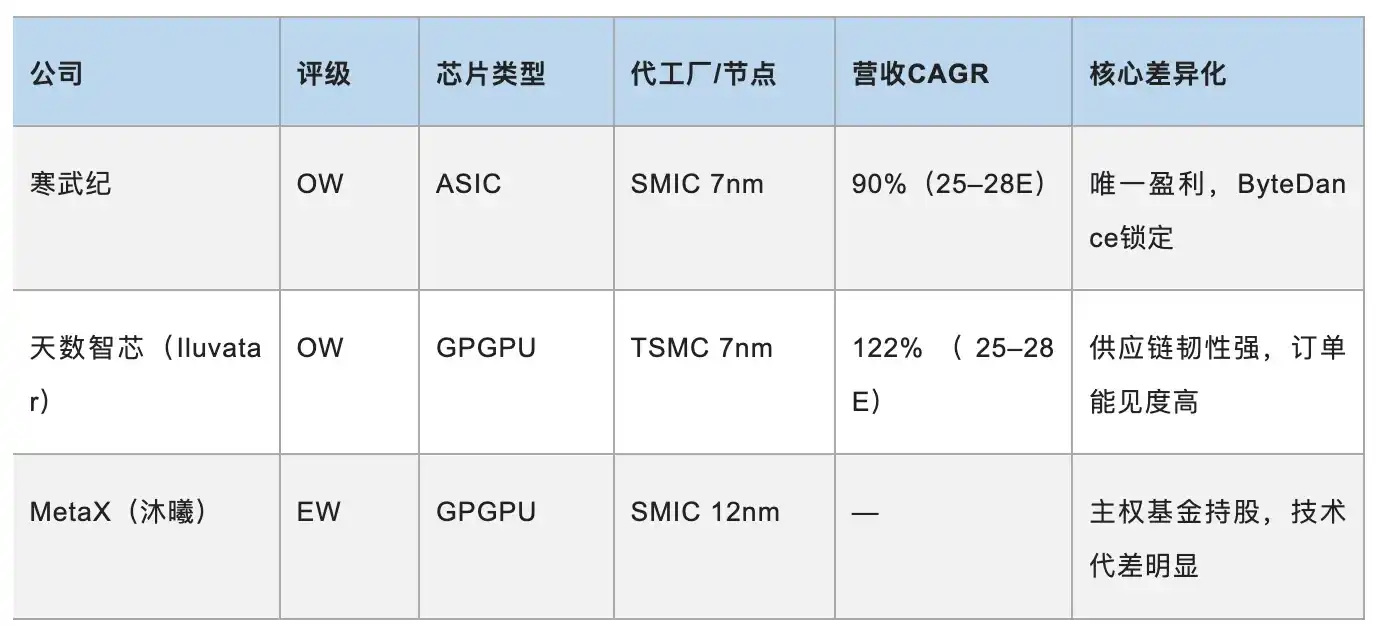
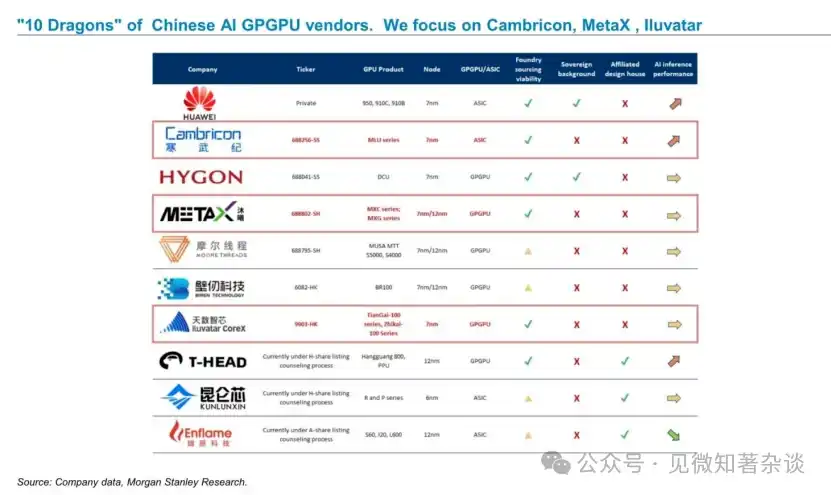
Comparison of Three Key Stocks among the "Ten Dragons":
【Transmission Path】
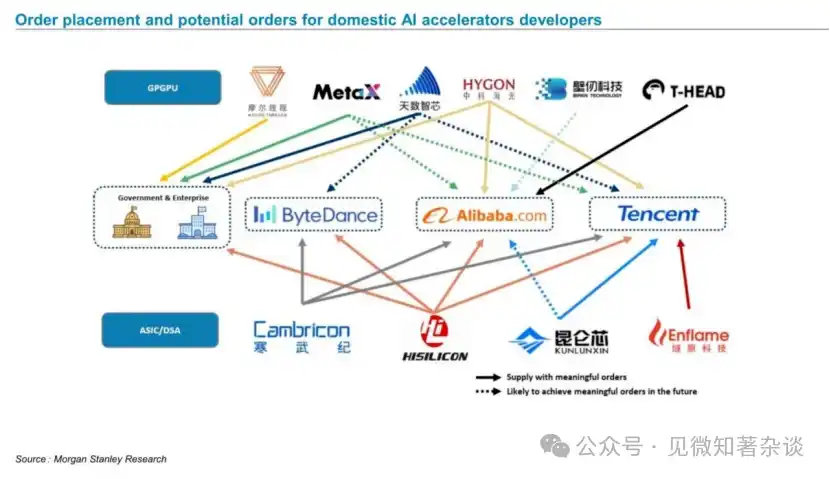
Export Controls → Domestic Substitution → SMIC 7nm Capacity Expansion → Huawei/Cambricon Volume Ramp → Local Cloud Vendors (ByteDance/Alibaba/Tencent) Switch Procurement → Inference Cost Decreases → More Applications Boom → New Round of Compute Demand.
【Trading Implication】
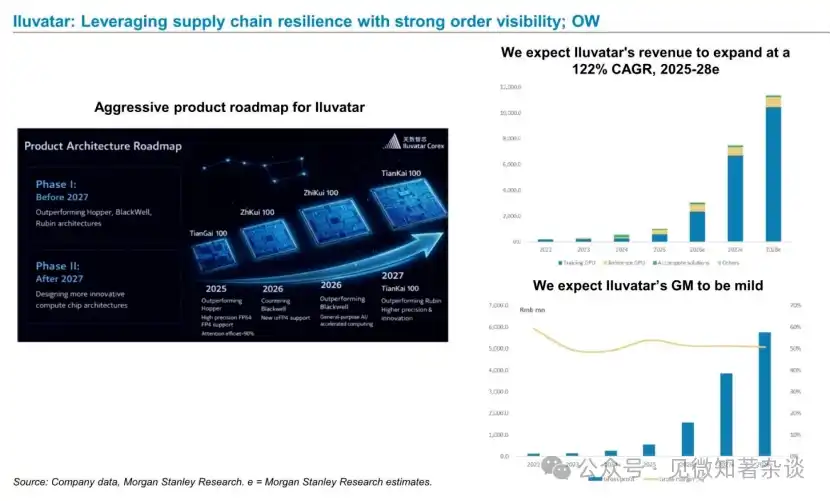
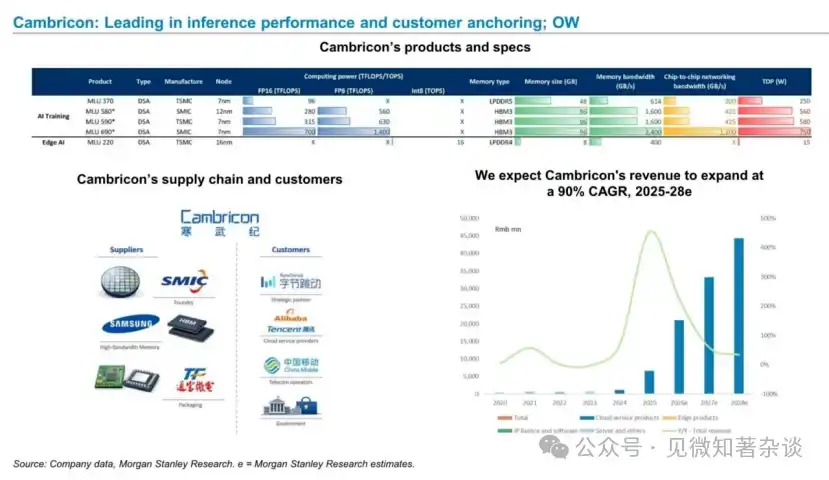
Highest certainty for Cambricon, making it the preferred pick; Iluvatar has the highest potential but is not yet profitable, carrying higher risk. Huawei (not listed) is the biggest competitive variable; its share growth indirectly pressures other domestic players, requiring continuous monitoring. Time Window: 2026–2027 is the critical transition period for domestic AI chips moving from backup to main force.
3.4 Non-AI Semiconductors (Consumer / Automotive / Industrial Control) — Structurally Bearish, Weak Recovery Not Strong Recovery
【Core Contradiction】
Supply chain resources are being systematically siphoned by AI; traditional semiconductor recovery pace continues to lag expectations, with the market overestimating rebound elasticity.
【Key Driver】
Foundry capacity/T-Glass substrates/memory all tilt toward AI; non-AI chips are queued later, wafer and OSAT costs rise; chip design companies face margin pressure.
· Excluding NVIDIA AI GPU and memory, non-AI semiconductor growth is expected to decline significantly in 2026.
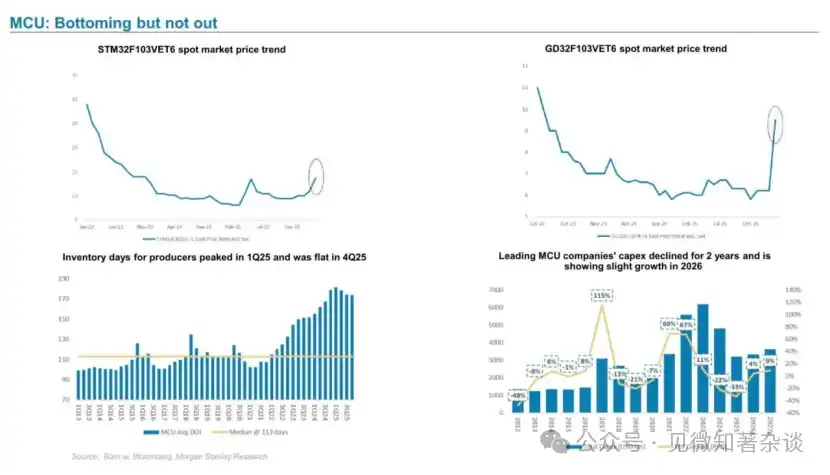
· MCU inventory days remain at historically high levels (flat in 4Q25 after 1Q25 peak); inventory digestion is slow for STM/GD and other major vendors.
· Logic foundry utilization expected to recover to 80% only in 2H26, recovery elasticity limited.
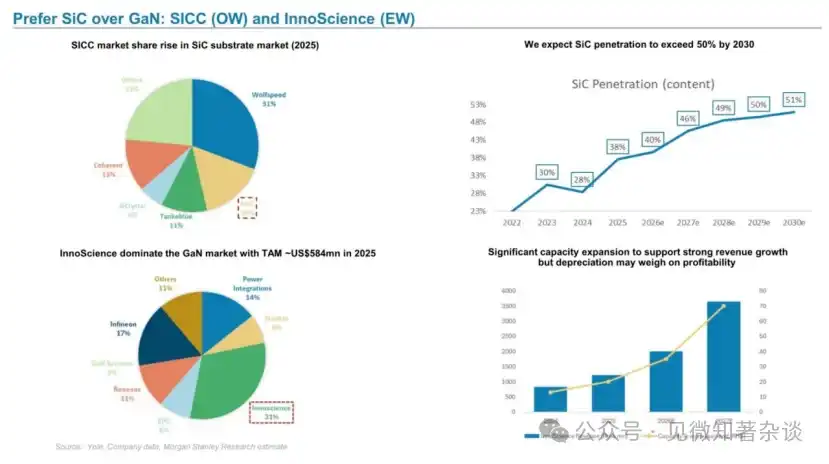
· SiC preferable to GaN: Recommend SICC (OW), SiC penetration expected to exceed 50% by 2030; Avoid InnoScience (EW), capacity expansion depreciation suppresses profit.
【Trading Implication】
Avoid pure traditional semiconductor exposure; MCU tracks have confirmed a bottom but are in a weak recovery, not recommended to heavily bet on a strong rebound. SiC is the only sub-segment worth attention in traditional tracks.
3.5 Memory (HBM / NAND / DDR4) — Severe Internal Divergence, Signals Require Scrutiny
【Core Contradiction】
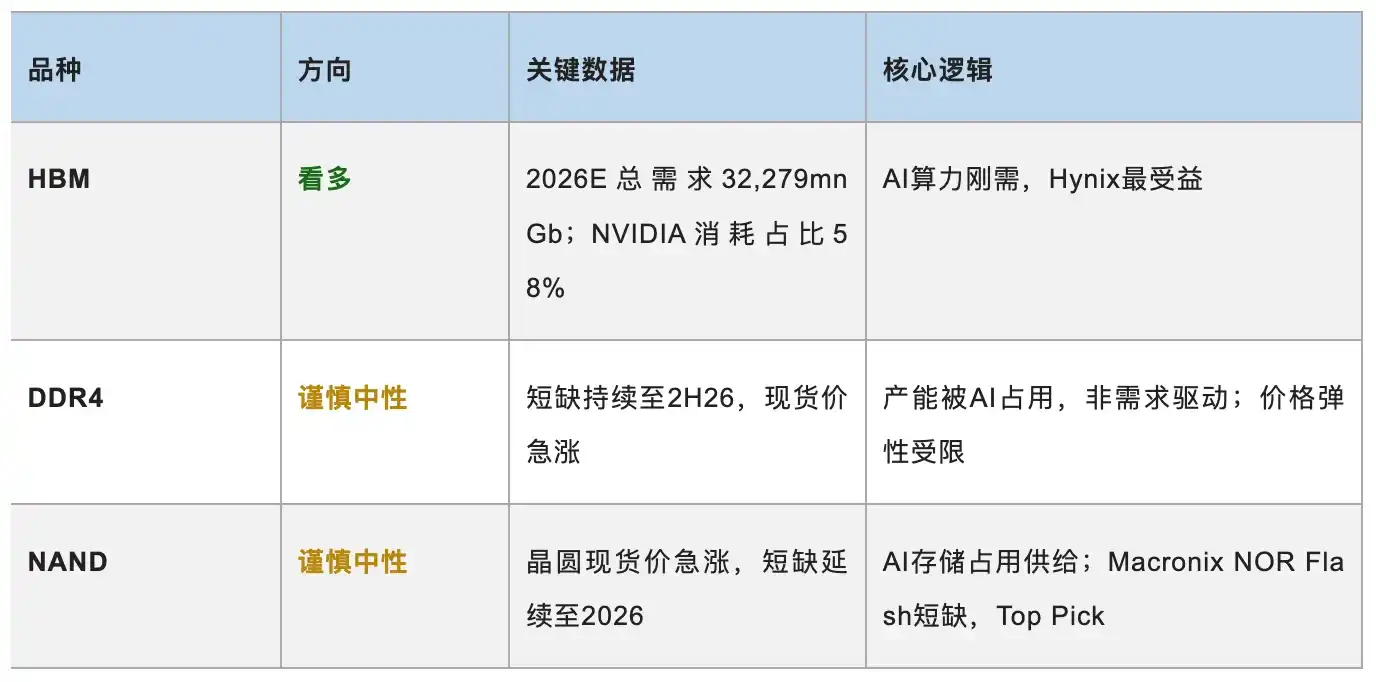
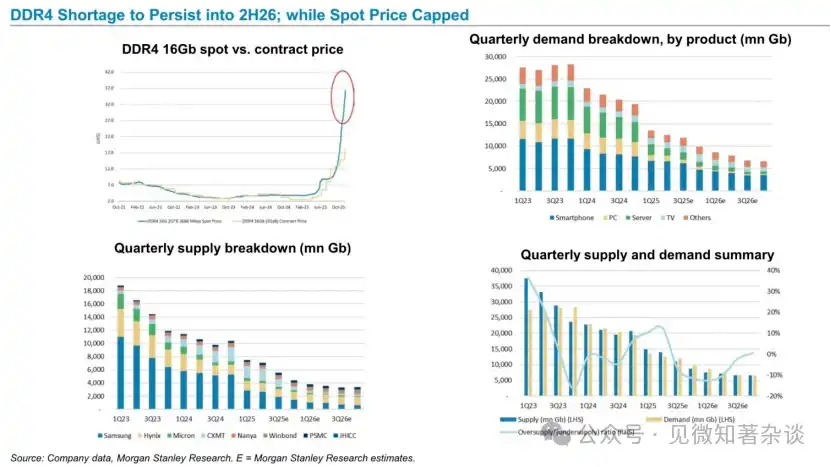
AI-driven HBM demand explosion is clear; DDR4/NAND price increases are due to supply squeezed by AI, not genuine demand recovery, signaling distortion, price elasticity limited.
【Trading Implication】
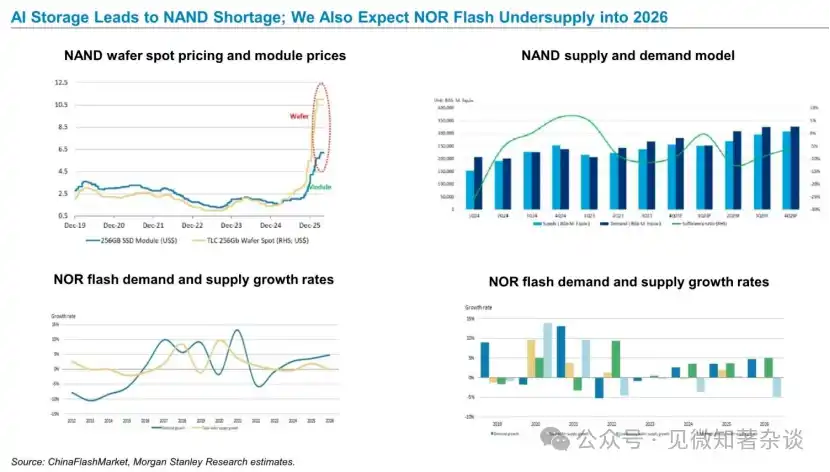
Firmly bullish on HBM, Hynix benefits most; Macronix (NOR Flash, Top Pick) benefits from shortage and reasonable valuation; NAND/DDR4 price rise ≠ demand improvement, beware of chasing rallies.
IV. Macro & Geopolitical Variables: As Explanatory Variables for Track Judgment
【Geopolitics】 Persistent tightening of export controls
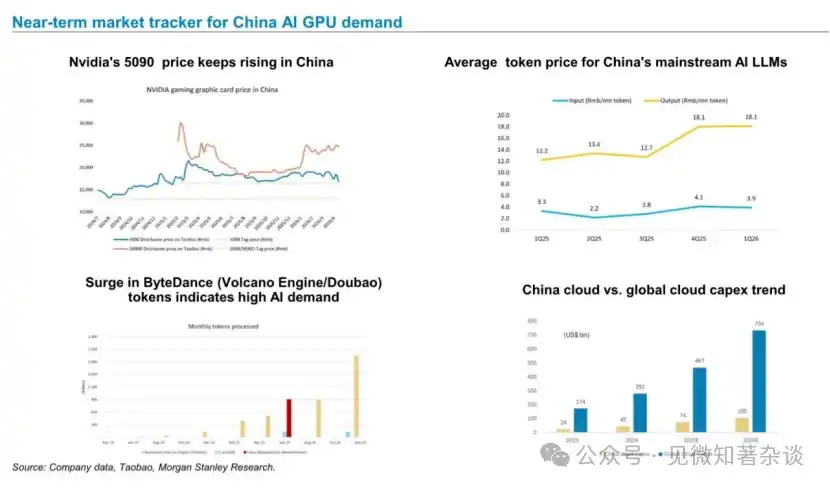
NVIDIA's restricted exports to China → Certainty of China's domestic AI chip substitution demand rises; China's cloud capex 2026E reaches $105B, quickly approaching 14% of global cloud capex.
【Macro】 Energy Constraints (US Side)
US data center power supply shortage is a potential ceiling for GPU demand growth, but not a substantial constraint in the near term (2026).
【Industry Structure】 AI Cannibalization Effect
The siphon effect of AI demand on non-AI supply chains (T-Glass, traditional DRAM, consumer foundry capacity) is the core explanatory variable for the persistently weaker-than-expected performance of non-AI semiconductors, not cyclical factors.
【Cost Side】 Tech Inflation
Comprehensive rise in wafer/OSAT/memory costs creates gross margin pressure for chip design companies (especially in non-AI tracks); bargaining power of foundries like TSMC continues to increase.
V. Recommended Portfolio & Trading Framework
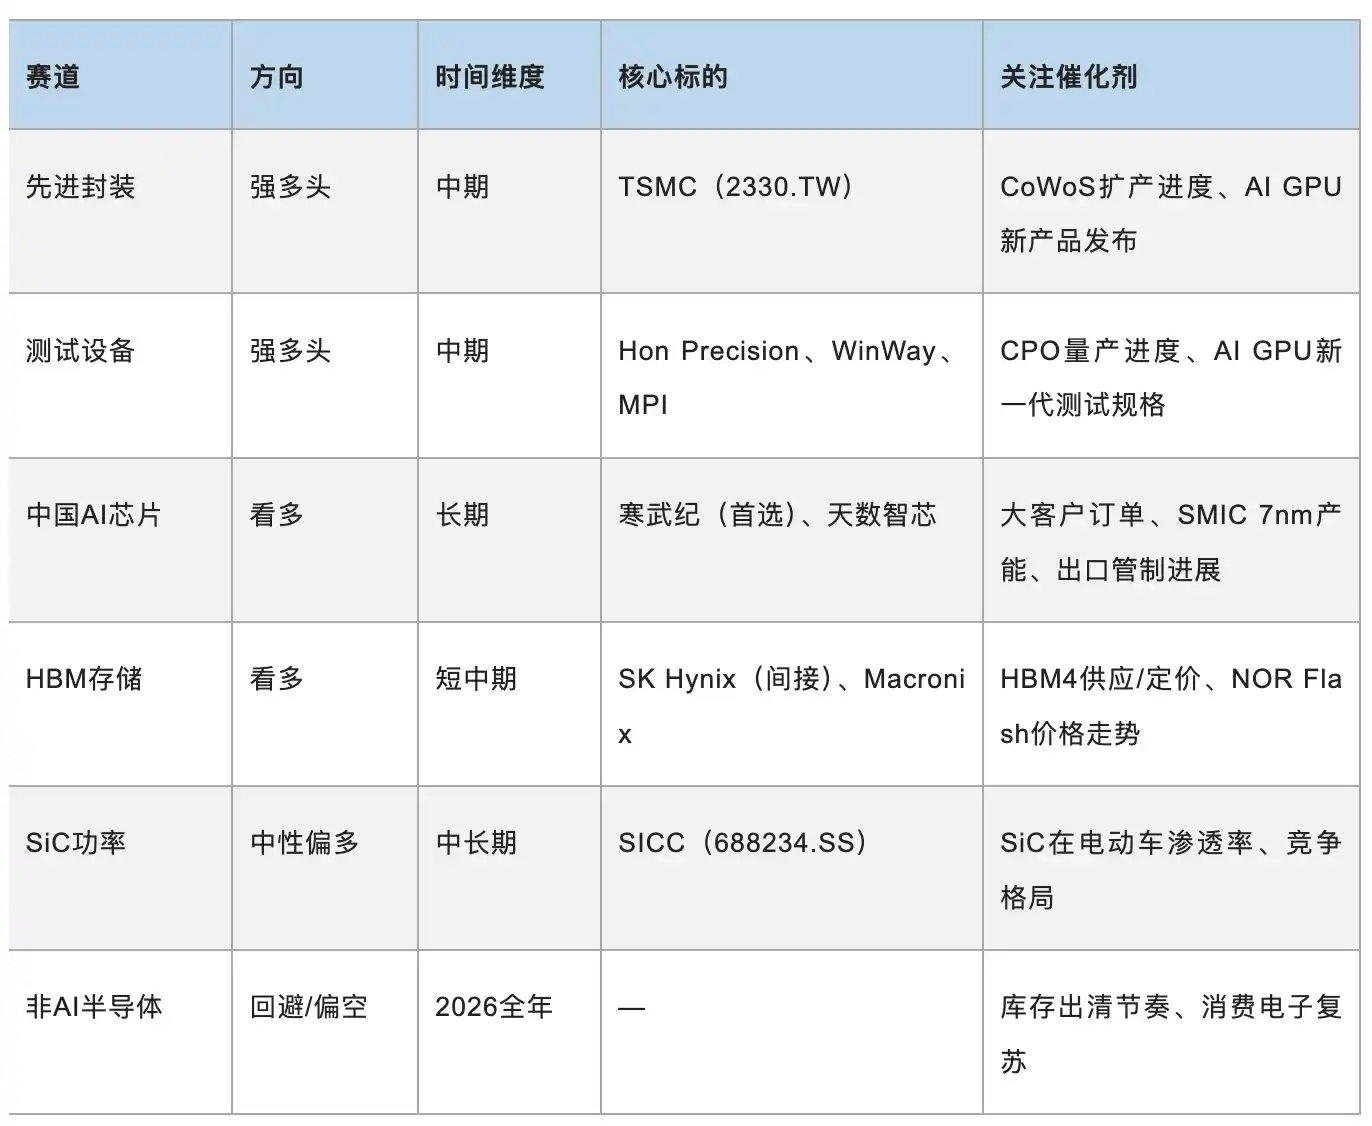
Based on judgments across tracks, construct the following trading framework:
VI. Summary in One Sentence
Buy Packaging (TSMC), buy test equipment (Hon Precision / WinWay / MPI), buy China AI chip leaders (Cambricon); avoid strong recovery expectations for non-AI semiconductors; within memory, go long HBM, neutral on traditional DRAM/NAND. The time window is 2026–2027, the AI capex cycle is far from over.
Risk Disclosure: This note is based on Morgan Stanley public research reports, for internal research reference only, and does not constitute any investment advice. Market uncertainties exist, actual outcomes may differ materially from forecasts, investors should make decisions cautiously.
Building Future AI Infrastructure — CPU, GPU, ASIC, Optical Modules & China Chips
Strong Outlook for AI Semiconductors
Morgan Stanley defines the AI semiconductor outlook as "Strong", with demand driven by three forces: continued explosion of killer AI apps, tech giants' compute arms race, and sovereign AI construction demand from various nations. Concurrently, this report identifies four growth constraints — budget, US energy bottlenecks, China chip capacity, regulation — whose essence is supply lagging demand, not demand itself cooling.
Long-term, three structural variables warrant caution:
1) Tech inflation (rising wafer/packaging-testing/memory costs compress chip design company profits);
2) AI cannibalization effect (supply chain resources tilt towards AI, marginalizing non-AI semiconductors);
3) DeepSeek effect (low-cost inference validated, accelerating release of China's domestic inference demand, simultaneous improvement in domestic foundry supply chain's AI GPU production capacity). Combined, these three constitute the underlying logical framework for all subsequent track judgments in the report.
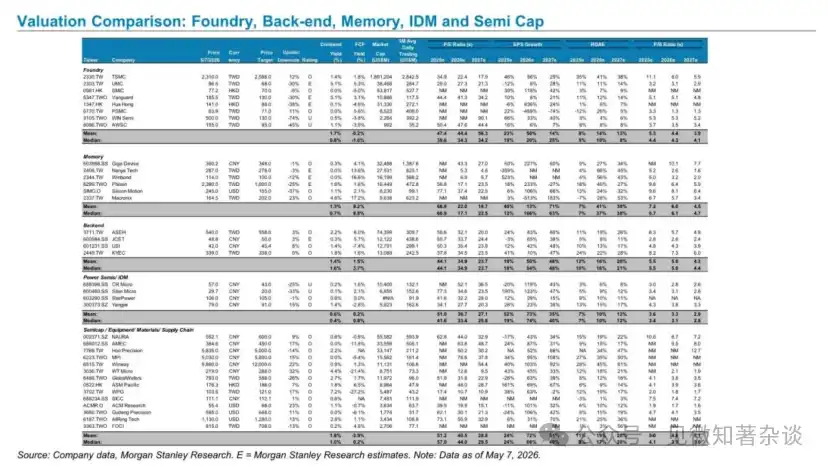
Valuation Comparison: Foundry, Backend, Memory, IDM & Semiconductor Equipment
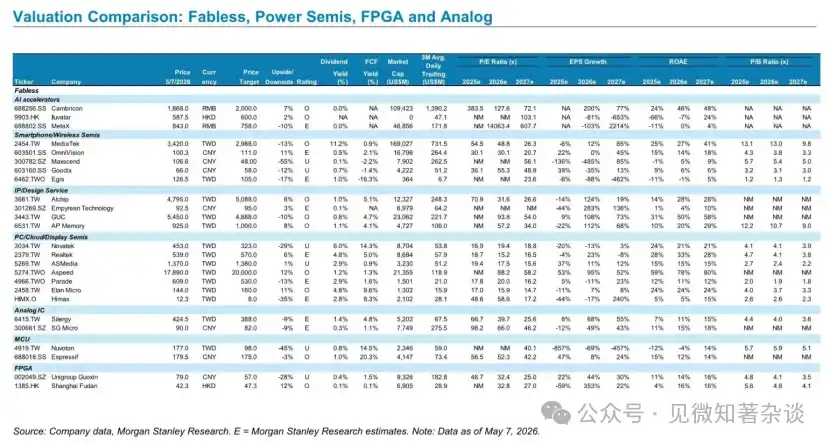
Valuation Comparison: Fabless, Power Semiconductors, FPGA & Analog Chips
The Semiconductor Super-Cycle
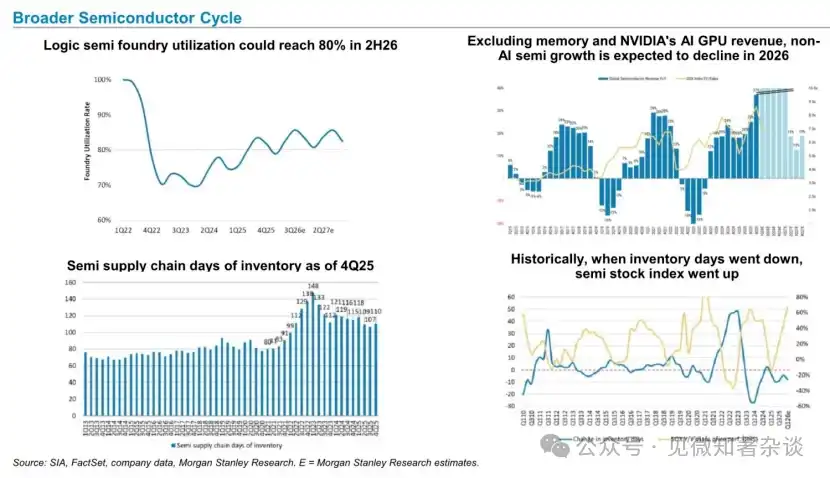
The core conclusion is cycle divergence rather than overall recovery: Logic foundry utilization expected to recover to 80% in 2H26, but excluding NVIDIA AI GPU and memory, non-AI semiconductor growth is expected to decline significantly in 2026; declining inventory days from peak is a positive signal, historical data shows inventory down cycles often correspond to semiconductor stock index rises, but the degree of structural divergence in this recovery far exceeds past ones.
AI Semiconductor Supply Chain & Niche Memory

By 2030, the global semiconductor industry market size could reach $1.5 trillion, with half coming from AI semiconductors
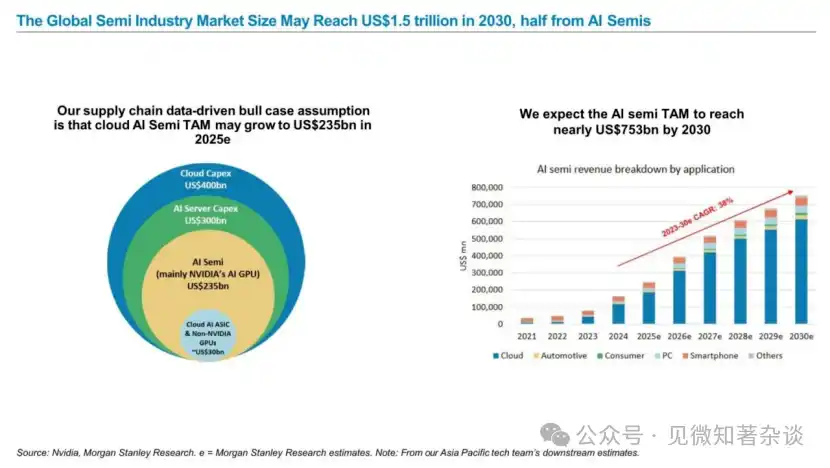
A crucial long-term anchor: The global semiconductor market may reach $1.5T by 2030, with AI semiconductors contributing ~$753B; the bull case assumption for cloud AI semiconductor TAM is $235B in 2025 (mainly from NVIDIA AI GPU), with a 2023-2030 CAGR of 38%, providing top-level market space justification for subsequent valuations across all tracks.
Cloud Semiconductors: A Brighter Outlook
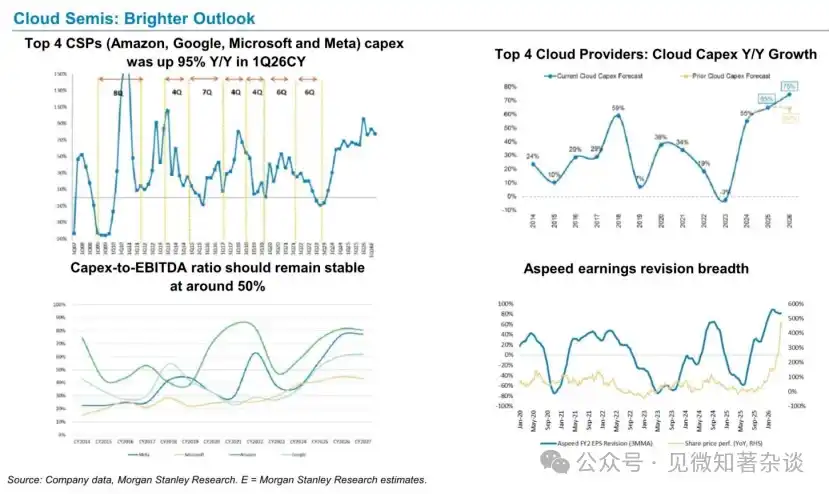
The four major cloud vendors' (AWS/Google/Microsoft/Meta) Q1 2026 capex increased 95% YoY, the strongest single data point on the demand side in the entire report; the Capex/EBITDA ratio is expected to remain stable at ~50%, indicating the financial sustainability of cloud vendor expansion willingness; Aspeed's earnings forecasts are continuously revised upward, as the leading BMC chip supplier for cloud AI servers, its revision trend confirms the authenticity of cloud demand.
Cloud Capex from Major Cloud Service Providers Remains Strong
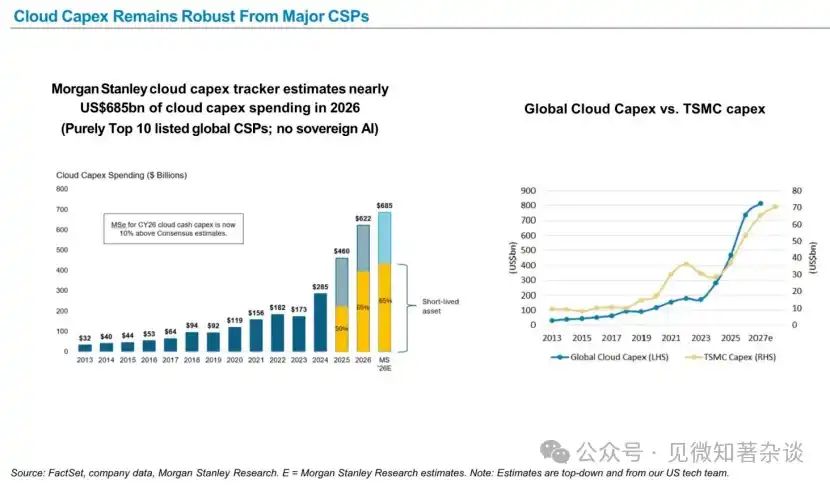
The MS cloud Capex tracker projects global Top 10 cloud vendor capex to reach $685B in 2026, ~10% higher than market consensus; historical charts showing highly synchronous climbs in global cloud Capex and TSMC capex are core visual evidence supporting the judgment "this is not a short cycle"; ~65% share of short-life assets means cloud vendors must continuously purchase annually, giving demand rigidity.
Announced Power Deployment Impact for TSMC
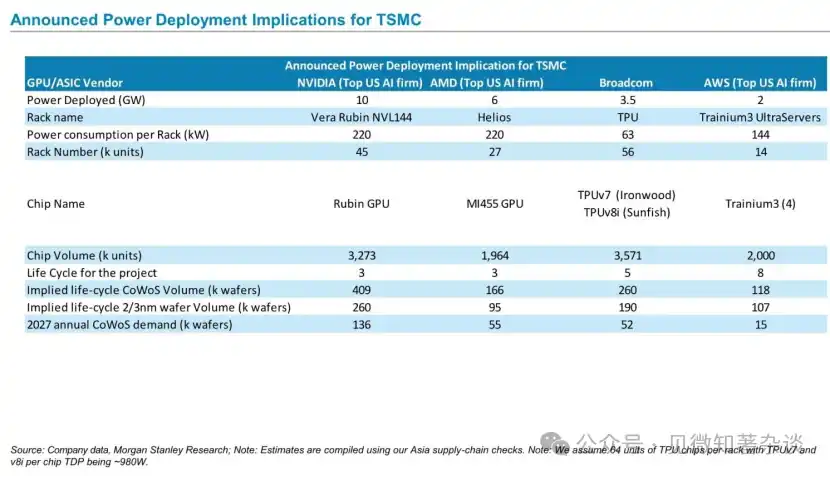
Bottom-up calculation of CoWoS wafer demand through rack specifications and deployment power of four key customers: NVIDIA, AMD, Broadcom, AWS; NVIDIA Rubin NVL144 rack power 220kW, 45k racks, implies annual CoWoS demand of 136k wafers in 2027, a core quantitative basis for the report's judgment of CoWoS supply-demand tightness.
Given sustained strong AI demand, TSMC may expand CoWoS capacity to 165k wpm by 2027
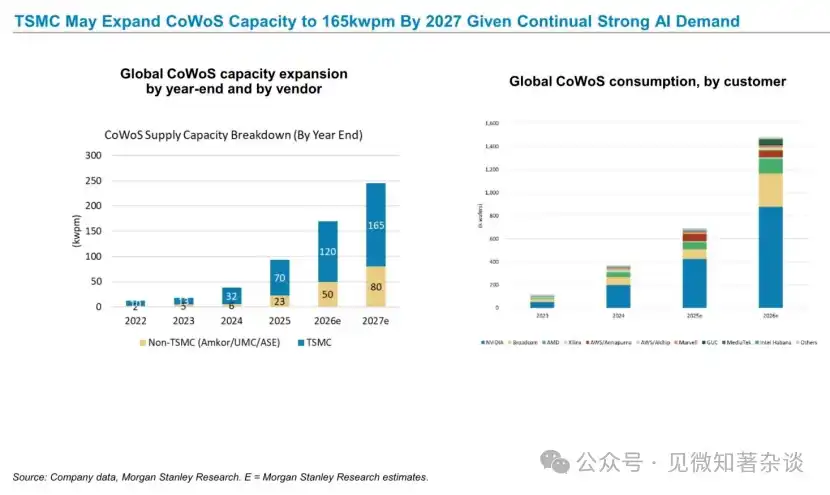
Direct CoWoS supply-side data: TSMC capacity expands from 120kwpm end-2025 to 165kwpm end-2027, Non-TSMC (Amkor/UMC/ASE) capacity expands from 23kwpm to 80kwpm; on the consumption side, NVIDIA accounts for ~59% of total CoWoS consumption, Broadcom ~20%, high concentration means demand changes from a few customers have massive impact on TSMC.
SoIC (System on Integrated Chips) expansion will be a key focus for TSMC in coming years
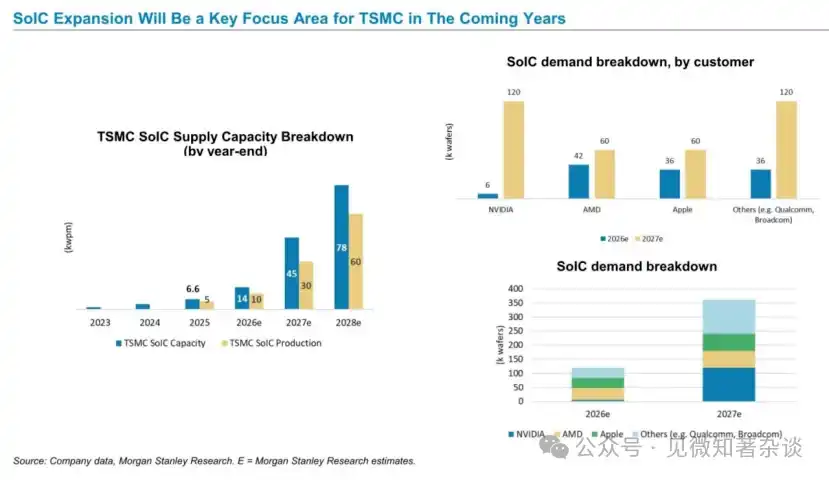
SoIC is defined as a key strategic direction for TSMC in coming years: capacity expands from 45kwpm end-2025 to 78kwpm end-2027, demand side includes NVIDIA, AMD, Apple, Qualcomm/Broadcom; SoIC offers higher integration and deeper technical barriers than CoWoS, is TSMC's second growth curve in advanced packaging following CoWoS, entering rapid ramp-up in 2026-2027.
TSMC may double CoWoS and SoIC capacity in 2025, we expect this trend to continue into 2026
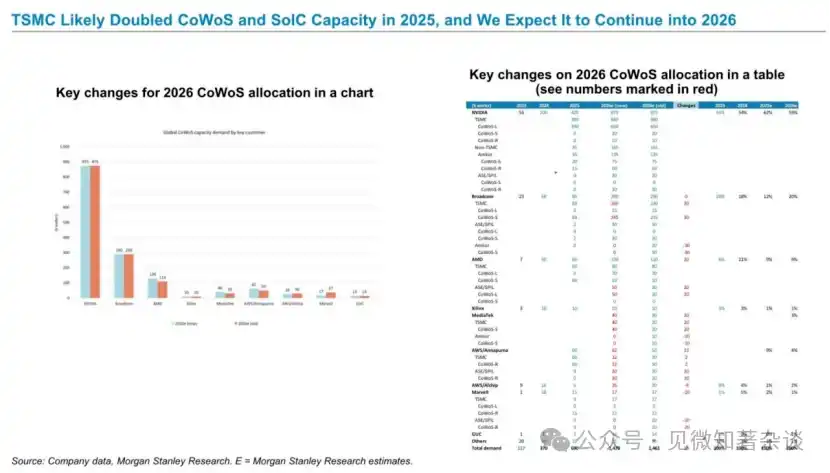
2026 AI compute wafer consumption value could reach $27.2B, with NVIDIA dominating most
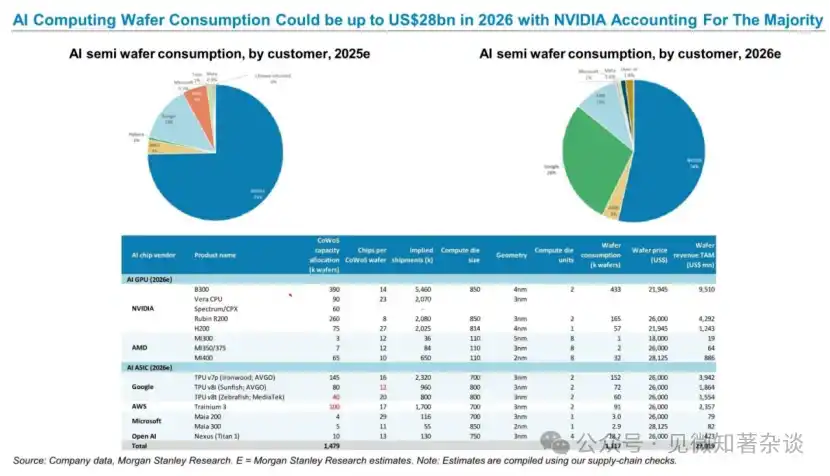
Bottom-up listing of CoWoS capacity allocation, chip shipment volume, wafer consumption, and wafer value for all major 2026 AI chips (NVIDIA B300/Rubin/H200, Google TPU, AWS Trainium3, Microsoft Maia, OpenAI Nexus); summary shows total 2026 AI chip wafer consumption value ~$27.2B, NVIDIA dominates, providing the most persuasive underlying calculation for TSMC's AI revenue scale in the report.
2026 HBM (High Bandwidth Memory) Consumption — Up to 32B Gb
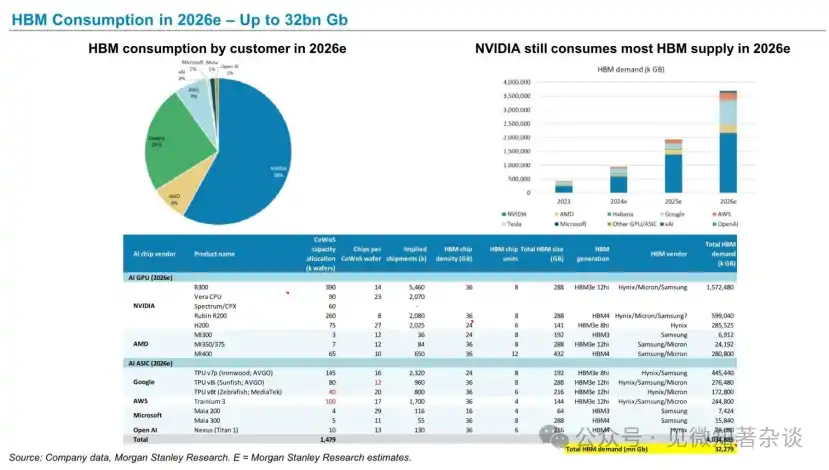
Total 2026 HBM demand ~32,279mn Gb, NVIDIA consumption share ~58%; lists HBM specs (capacity, generation, supplier) for each AI chip; Google TPU series mainly consumes HBM3e 12hi, AWS/Microsoft consume HBM3/HBM4; supply split among Hynix, Samsung, Micron, Hynix benefits most due to HBM technology leadership.
NVIDIA GB200/300 Rack Production Estimates
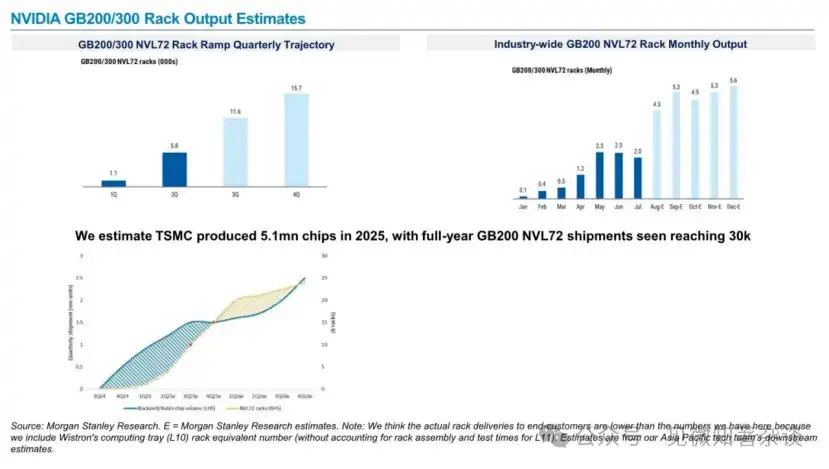
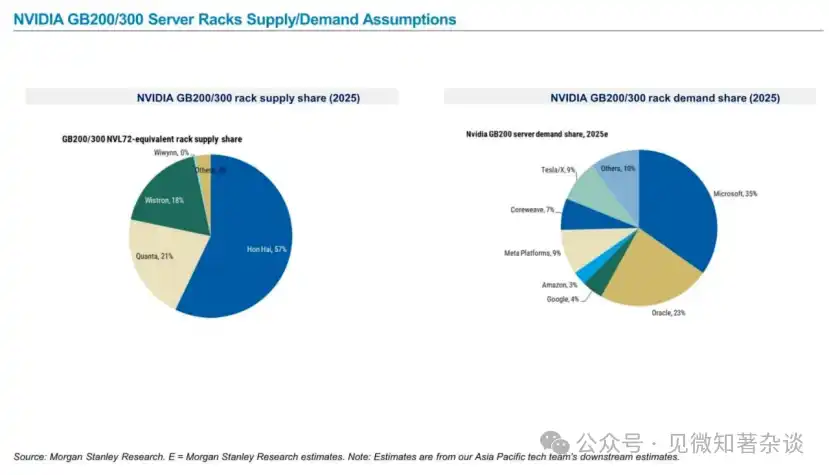
NVIDIA GB200/300 Server Rack Supply-Demand Assumptions
TSMC AI semiconductor revenue share could reach 60% between 2024 and 2029
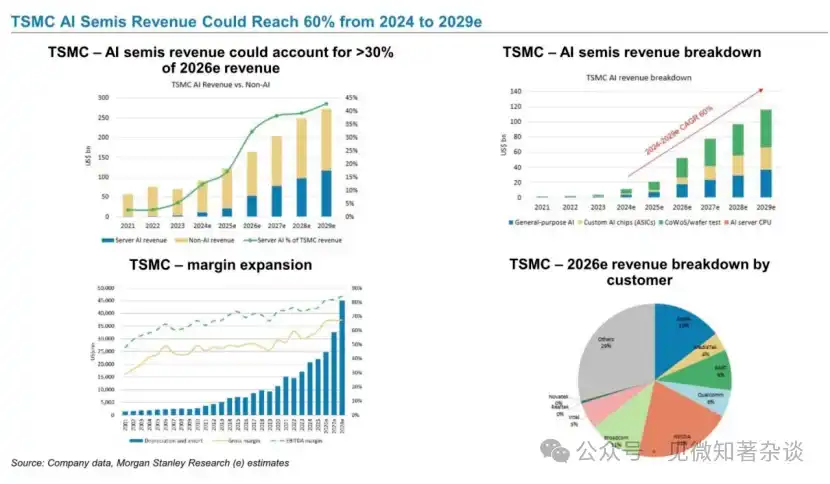
TSMC AI chip revenue CAGR 2024-2029 reaches 60%, AI revenue exceeds 30% of total revenue in 2026; revenue composition covers general AI chips, custom ASICs, CoWoS packaging & test, AI server CPUs four segments; customer structure: Apple 19%, NVIDIA 21%, Broadcom 11%; gross margin and EBITDA margin continue to expand, confirming the positive pull of AI business on TSMC's overall profitability quality.
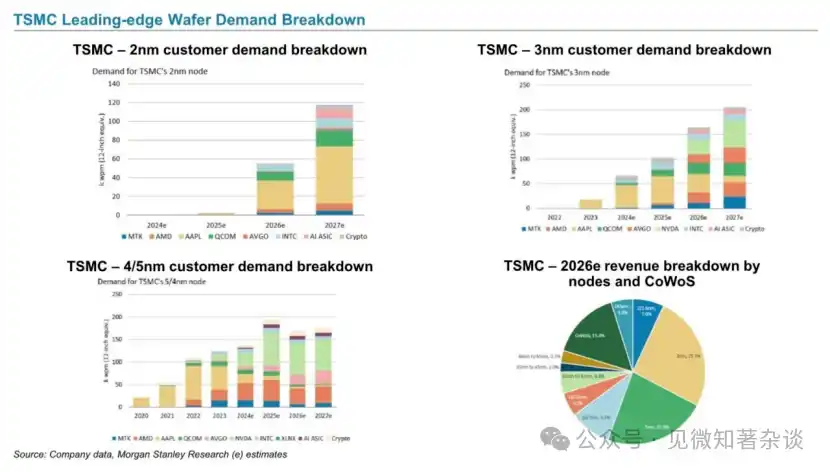
TSMC Leading-Edge Wafer Demand Breakdown
Agentic AI — Expanding CPU Opportunity
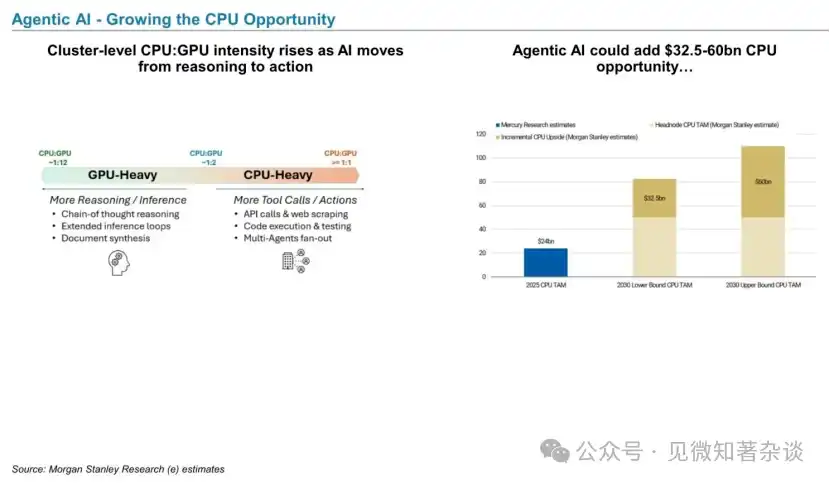
AI moving from inference to "action" phase, CPU/GPU ratio shifting from GPU-heavy (1:12) to CPU-heavy (≥1:1), driven by tool-use tasks like API calls, code execution, multi-agent concurrency; MS estimates Agentic AI could add $32.5-60B CPU market space (by 2030), MediaTek as an AI server CPU designer is a named beneficiary in the report.
AI Storage Causing NAND Shortage; We Expect NOR Flash Tightness to Last into 2026
DDR4 Shortage to Persist into 2H26; While Spot Prices Have a Ceiling
AI ASIC, CPO & Chip Testing
AI Semiconductors: Now & Future — 「Key Drivers」
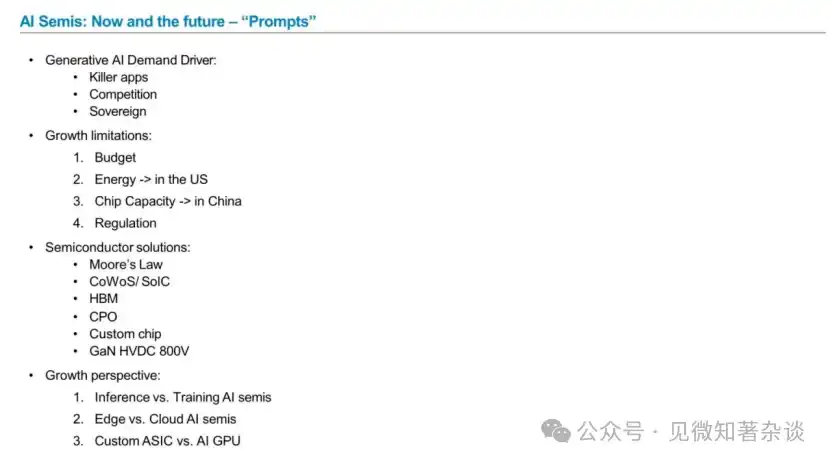
Presents four dimensions of AI semiconductors side-by-side: Drivers, Constraints, Technology Solutions, Growth Perspectives; specifically lists three sets of growth perspective contrasts — Inference vs Training, Edge vs Cloud, Custom ASIC vs AI GPU — these three contrasts serve as a mental map for understanding divergence points in all subsequent track judgments in the report.
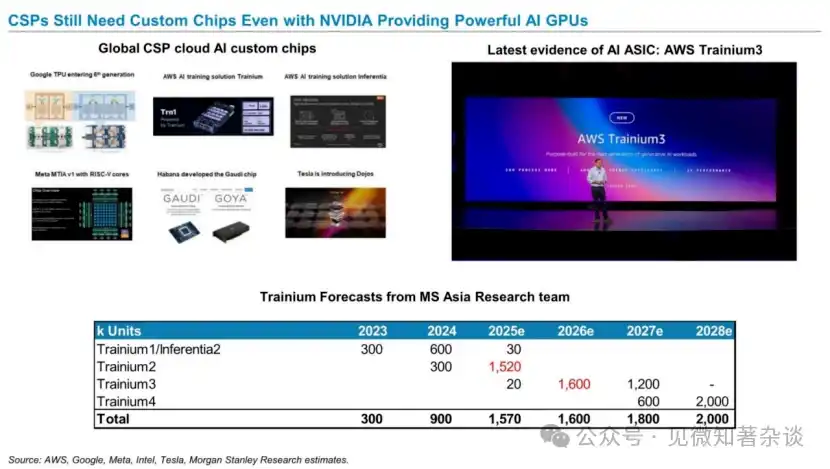
Cloud Service Providers (CSPs), Even with NVIDIA's Strong AI GPUs, Still Need Custom Chips
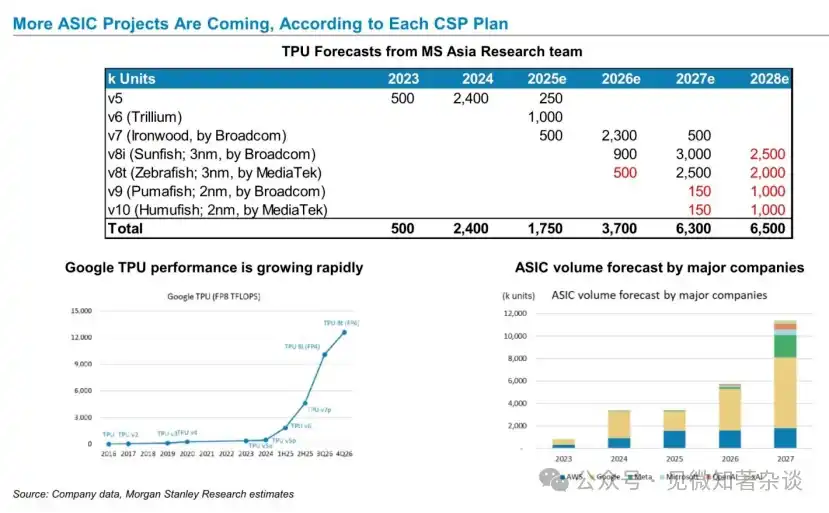
More ASIC Projects Coming Based on CSP Plans
What is the Competition Status Between TSMC CoWoS and Intel EMIB?
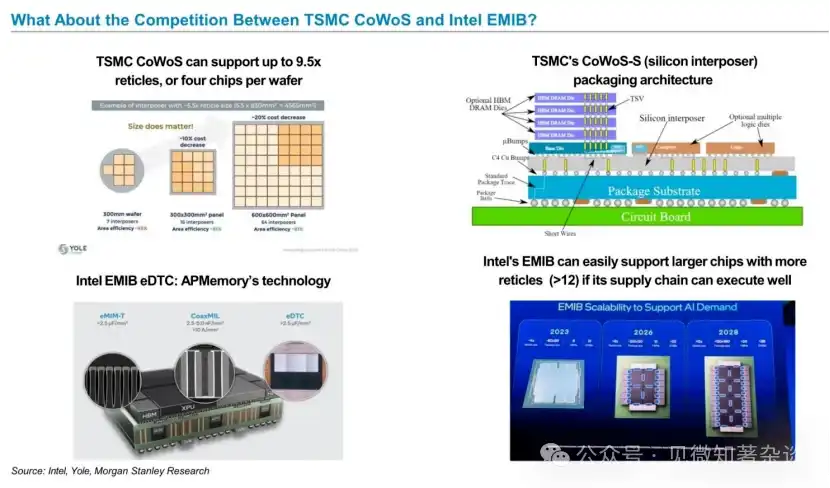
Larger Package Sizes Becoming Key Industry Trend
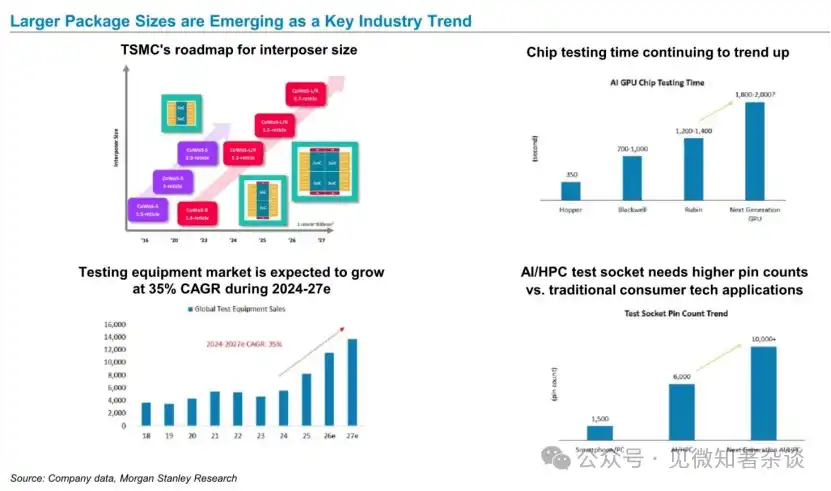
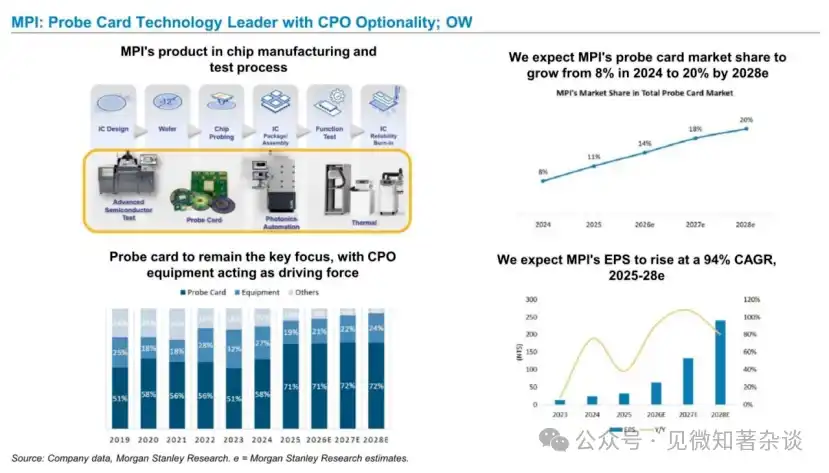
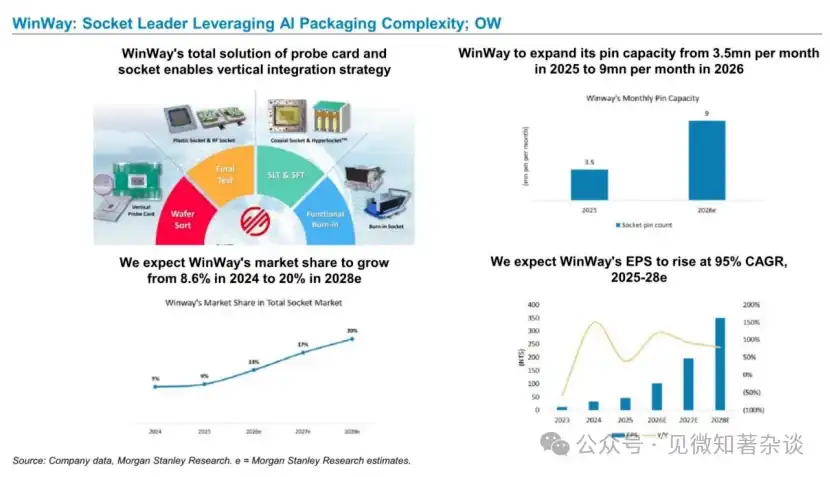
Chip test time soaring from Hopper's 350 seconds to next-gen GPU's 1800-2000 seconds is the core structural driver data for the test equipment track; test socket pin count jumping from mobile/PC level 1500 to AI/HPC level 6000 and next-gen 10000+; global test equipment market CAGR 2024-2027 projected at 35%, TSMC package size roadmap simultaneously shows interposer continuously enlarging, both supporting long-term bullishness for test equipment.
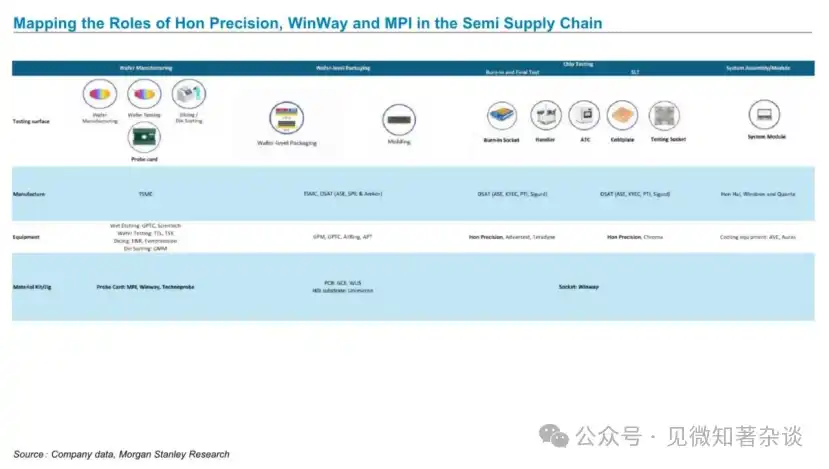
Depicting Role Division of Hon Precision, WinWay and MPI in Semiconductor Supply Chain
New Evolution in Test Equipment & Components: Co-Packaged Optics (CPO)
Hon Hai Precision: A Key Winner Benefiting from Structural Trend of Longer Test Times; MS Rating: Overweight (OW)
MPI: Leader in Probe Card Technology with CPO Options; MS Rating: Overweight (OW)
WinWay Technology: Test Socket Leader with Advantage from AI Packaging Complexity; Rating: Overweight (OW)
China Semiconductors: OSAT, Compound Semiconductors, MCU & AI GPU
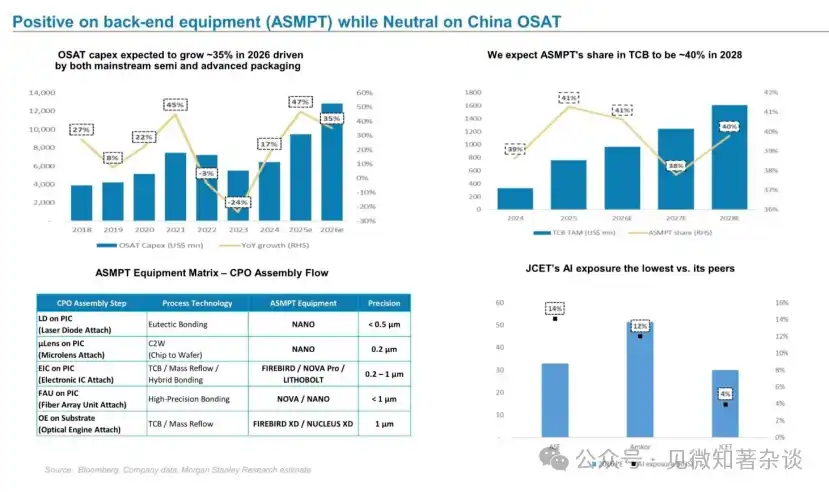
Bullish on Backend Equipment (ASMP), But Neutral on China OSAT
Prefer SiC (Silicon Carbide) Over GaN (Gallium Nitride): SICC (Overweight) vs InnoScience (Underweight)
MCU: Bottomed But Not Recovering
Domestic AI Semiconductor Market Size & Share Growing
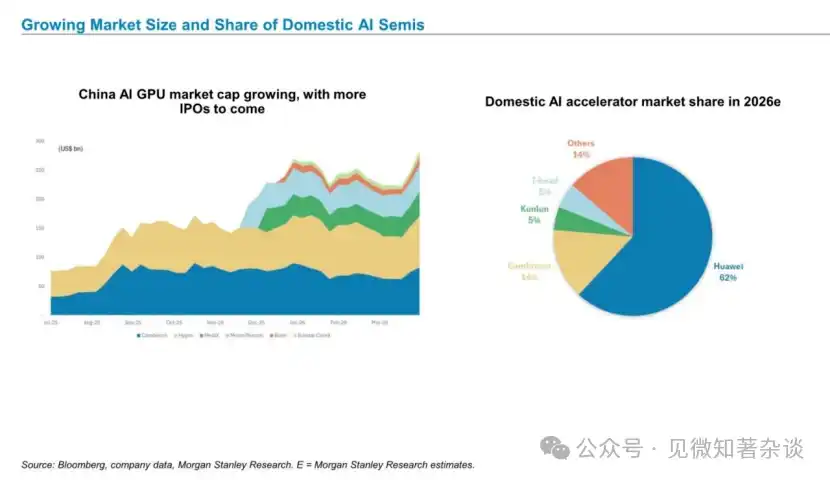
China domestic AI accelerator landscape is clear: Huawei dominant with 62%, Cambricon 14%, all other players under 10%; China AI GPU company market caps keep growing with more IPOs pending, market size expansion proceeds alongside capital market activity, forming the background for subsequent key stock analysis.
We Expect China AI GPU Total Addressable Market (TAM) to Grow to $67B by 2030
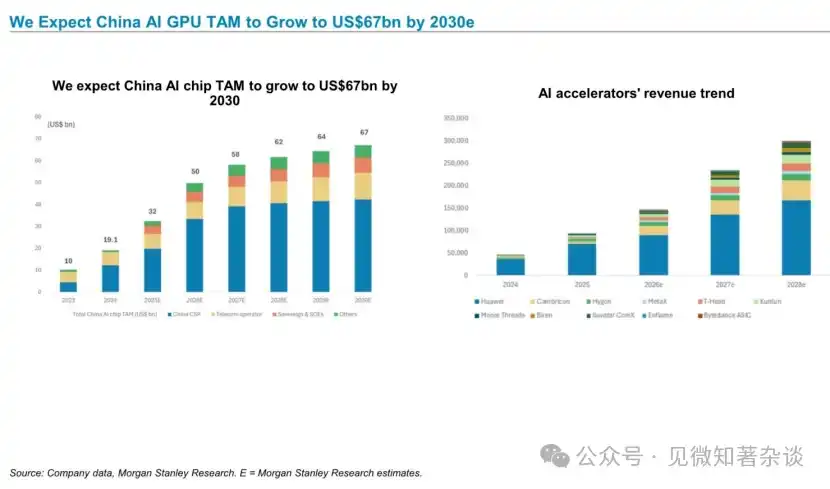
China Advanced Node Capacity Expansion to Meet Domestic AI GPU Production Demand
Recent Market Tracking of China AI GPU Demand
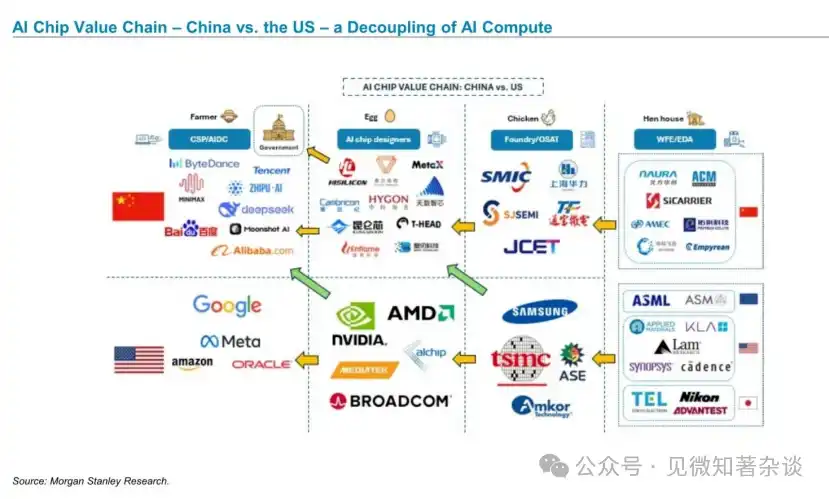
AI Chip Value Chain — China vs US — Decoupling of AI Compute
China's Infrastructure Capability is Narrowing the Perceived Technology Gap
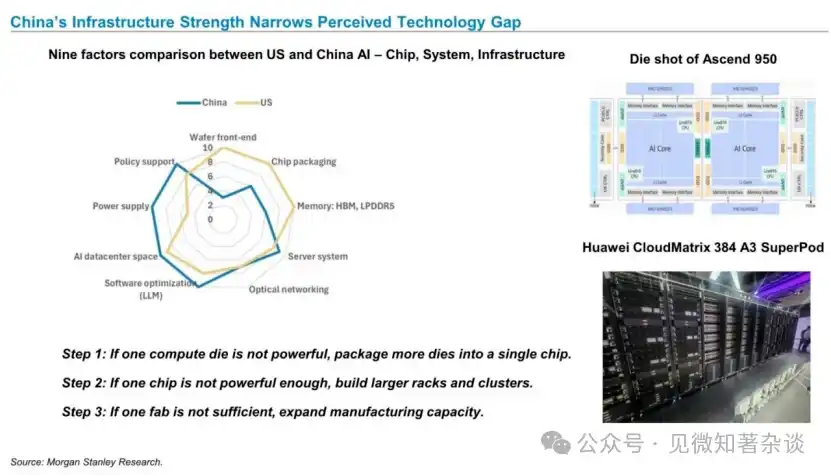
Radar chart comparing China-US AI infrastructure capability gap across nine dimensions: China scores close to US in policy support, AI data center space, software optimization (LLM); main gaps concentrated in wafer front-end, HBM memory, optical networking; proposes China's three-step strategy to offset single-chip compute deficiency — multi-die packaging → larger racks & clusters → manufacturing capacity expansion, Huawei CloudMatrix 384 A3 SuperPod is a real-world validation of this strategy.
Inference Economics: Total Cost of Ownership (TCO) & Per Token Cost
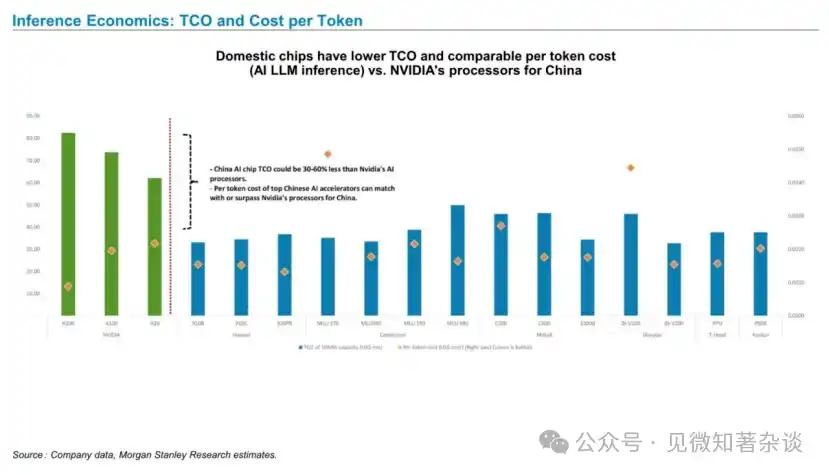
Domestic AI chip TCO is 30-60% lower than NVIDIA, and per token inference cost of top domestic accelerators can match or even surpass NVIDIA; this conclusion is core evidence that "China's domestic substitution is not just political necessity, but also economically rational", directly supporting the report's long-term bullish judgment on the China AI chip track.
Order Status & Potential Orders for Domestic AI Accelerator Developers
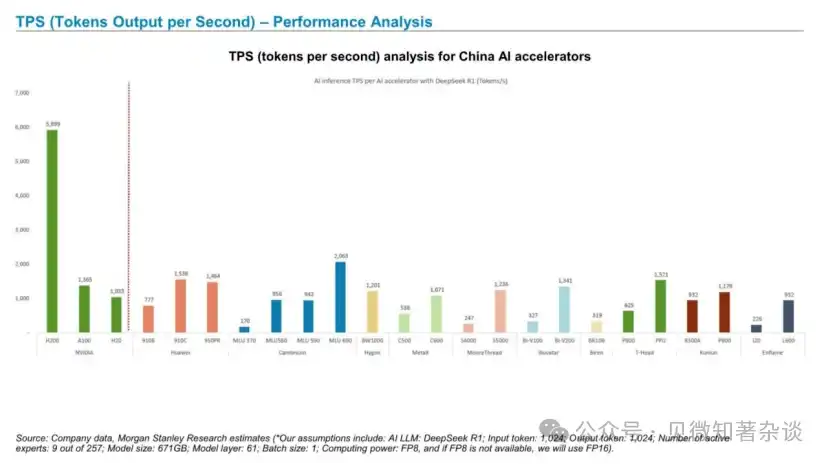
TPS (Tokens Per Second) — Performance Analysis
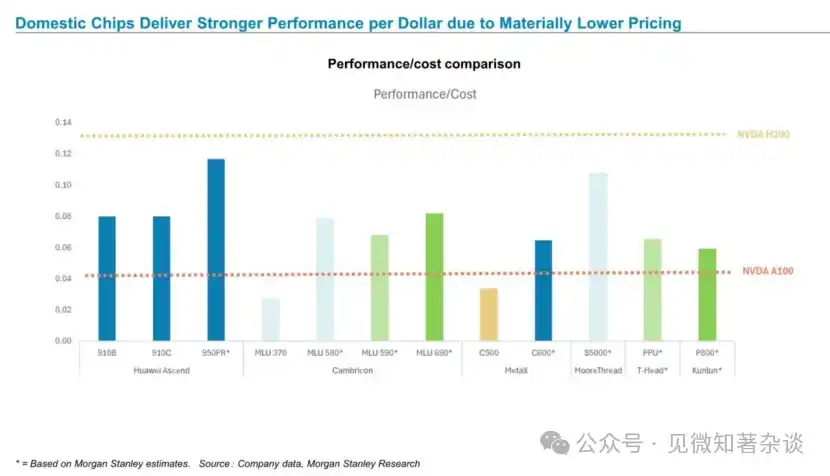
Domestic Chips Achieve Stronger Performance Per Dollar Due to Significantly Lower Prices
China's AI GPGPU "Ten Dragons". We Focus on Cambricon, MetaX, Iluvatar
Comparison of Cambricon, MetaX and Iluvatar
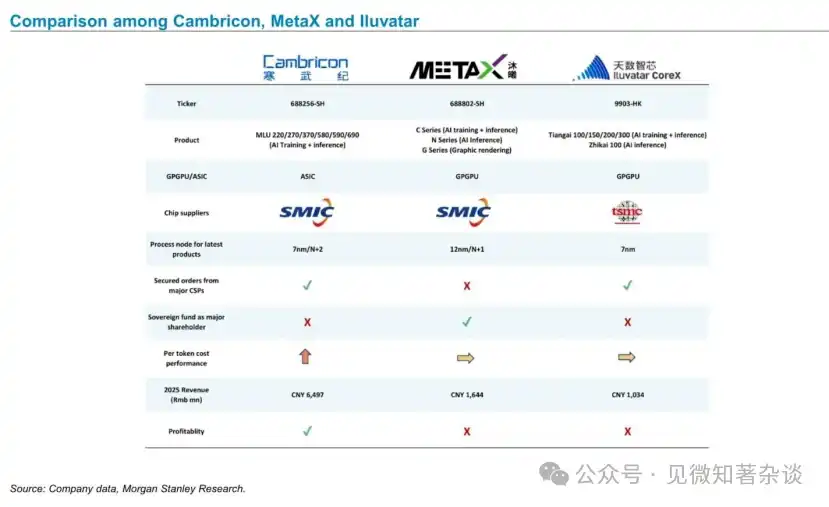
Side-by-side comparison of three most-watched China AI chip companies: Cambricon (SMIC 7nm ASIC, large customers locked in, only profitable one), MetaX (SMIC 12nm GPGPU, sovereign fund shareholding, clear technology gap), Iluvatar (TSMC 7nm GPGPU, strong supply chain resilience); considering profitability, customer structure, process node comprehensively, Cambricon's highest certainty is the report's implied conclusion.
Cambricon: Leads in Inference Performance (TFLOPS) & Customer Lock-in; Overweight Rating (OW)
Iluvatar: Relying on Strong Order Visibility & Supply Chain Resilience; Overweight Rating (OW)