Miners aren’t selling, yet Bitcoin is falling – What’s changed?

ambcryptoPubblicato 2026-03-26Pubblicato ultima volta 2026-03-26

Introduzione

Despite the common belief that Bitcoin's recent price decline was driven by miners selling due to rising post-halving costs, data suggests otherwise. The Miner Supply Ratio, which tracks BTC transfers from miners to exchanges, has been steadily falling since early 2025, indicating miners are actually selling less. Instead, the downturn may be attributed to weak demand and concerns about the market's ability to absorb supply. The next price movement will likely depend on whether buying interest returns.

Despite popular belief, Bitcoin’s [BTC] recent price decline was not because of the miners.

Instead, the downturn might be tied to weak demand. So, there are concerns about the market’s ability to absorb supply. With miner selling near lows, the next move will likely depend on whether buying interest returns or not.

Are loss-making miners causing the sell-off?

A common market narrative of recent times is that Bitcoin’s recent weakness has been caused by distressed miners offloading supply. Rising post-halving costs (spanning electricity, hardware, and operations) have allegedly pushed many miners close to or below breakeven, forcing them to sell.

Source: Cryptoquant

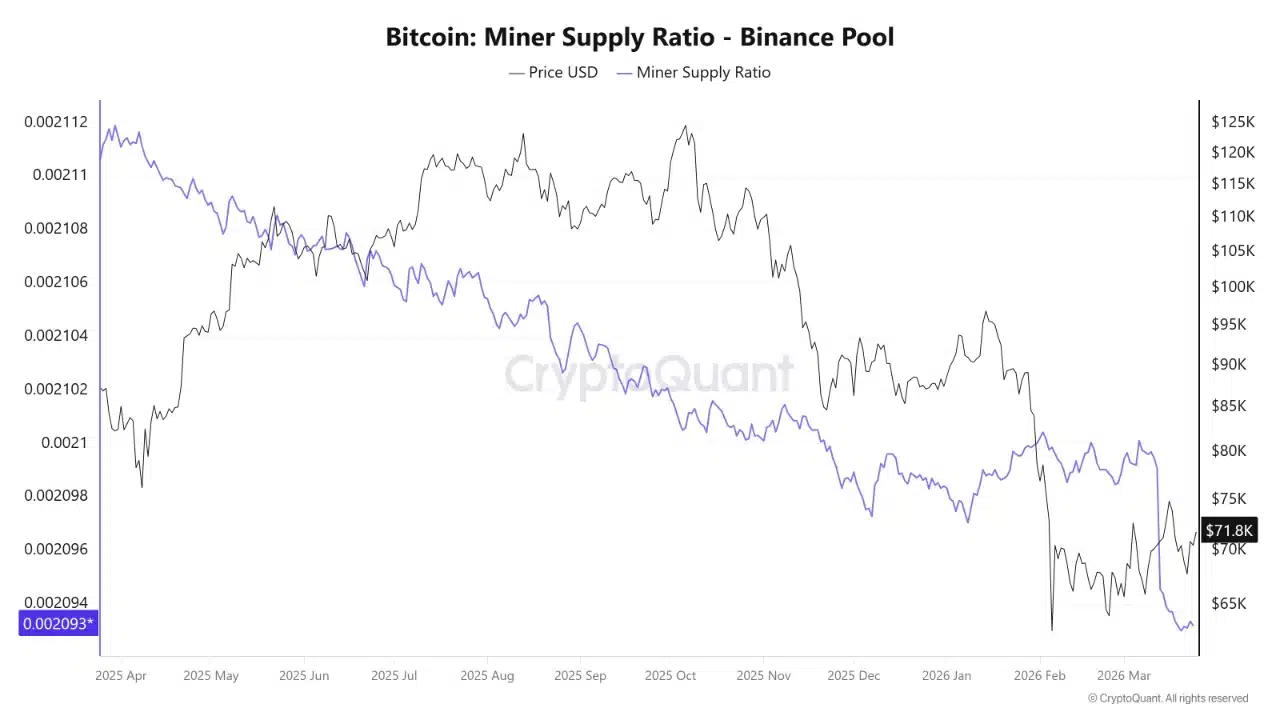
However, here’s a contrarian view. Miner Supply Ratio, which tracks BTC sent from miners to exchanges like Binance, has been steadily falling since early 2025.

Basically, miners are selling less, not more. Even so, Bitcoin’s price first rallied and then dropped during this period.

Key metric continues to fall

Domande pertinenti

QWhat is the main reason for Bitcoin's recent price decline according to the article?

AThe downturn is tied to weak demand rather than miner selling, with concerns about the market's ability to absorb supply.

QWhat common market narrative about Bitcoin's weakness does the article challenge?

AIt challenges the narrative that Bitcoin's recent weakness was caused by distressed miners offloading supply due to rising post-halving costs.

QWhat is the Miner Supply Ratio and what does it indicate about miner activity?

AThe Miner Supply Ratio tracks BTC sent from miners to exchanges and has been steadily falling since early 2025, indicating miners are selling less, not more.

QHow did Bitcoin's price behave during the period when miner selling was decreasing?

ABitcoin's price first rallied and then dropped during the period when miner selling was decreasing.

QWhat will Bitcoin's next move likely depend on according to the article?

AThe next move will likely depend on whether buying interest returns or not.

Letture associate

Bitcoin Monthly Chart Adjustment Structure Established, HYPE Entry Opportunity Emerges | Exclusive Analysis

Bitcoin Monthly Correction Structure Confirmed, HYPE Entry Opportunity Emerges | Guest Analysis Last week's analysis correctly identified that the $60,000 level for Bitcoin was an intermediate point, not the bottom of the current correction. This was validated on June 5th when the price broke below this key support, dropping to around $59,100. The monthly-level a-b-c three-wave corrective structure from the October 2025 high of $126,200 is now fully established, with the market currently in the c-wave decline phase. The cumulative adjustment time is less than 35 days, indicating the structure is far from complete. This week's focus will be tracking the rebound's strength and resistance performance. The two key resistance zones of $65,000 and $69,500~$70,500 will be crucial observation points for determining the subsequent trend. For HYPE, last week's top warning signal was also validated, with the price falling up to 27% from its $75.87 high. The token has now entered a support zone, presenting a potential short-term entry opportunity. From a strategic standpoint, the medium-term outlook remains bearish, awaiting optimal timing to add short positions upon a rebound. **Key Trading Views Summary:** * **BTC:** The analysis maintains a bearish medium-term bias. Strategy involves building short positions on rebounds towards $65,000 or the $69,500~$70,500 resistance area. A break below the $59,000-$60,000 support could trigger additional short entries. Short-term trading (30% capital) focuses on range-bound opportunities. * **HYPE:** Following a confirmed correction from the $75.87 high, the short-term strategy shifts to "buying on dips." Consider light long positions (under 30%仓位) if the price finds support and shows stabilization signals in the $55-$57 or deeper $47-$49 support zones, contingent on confirming technical signals. The key resistance to watch is the $62.5-$64.57 area. **Risk Management Reminder:** Always set an initial stop-loss immediately upon opening a position. Move the stop-loss to breakeven upon achieving 1% profit, and subsequently trail it to lock in gains. Market conditions change rapidly; this analysis is for informational purposes only and not investment advice.

marsbit14 min fa

Bitcoin Monthly Chart Adjustment Structure Established, HYPE Entry Opportunity Emerges | Exclusive Analysis

marsbit14 min fa

Valuation Surpasses 200 Billion, Kimi Reportedly Raises 13.6 Billion More, Speeds Up Hong Kong IPO

Beijing-based AI unicoth MoonDark (Kimi) is reportedly in talks for a new funding round aiming to raise up to $20 billion (approximately RMB 136 billion), targeting a post-money valuation of $300 billion (approximately RMB 2.035 trillion). If successful, this would mark its third round in six months and a six-fold increase from its $43 billion valuation in December last year. Last month, the company completed a $20 billion funding round led by Meituan Longzhu, reaching a valuation exceeding $200 billion. According to reports, MoonDark has raised over RMB 376 billion across six rounds, making it the most funded large language model startup in China. Founded in 2023 by CEO Yang Zhilin, the company's core product is the Kimi AI Assistant. In April, it launched and open-sourced its flagship model, Kimi K2.6, which has demonstrated performance comparable to top models like GPT-5.4 in certain benchmarks. Recently, it began beta testing for Kimi Work, a local AI agent for knowledge workers. Commercially, the company's Annual Recurring Revenue (ARR) reportedly surpassed $2 billion in April. Regarding its IPO plans, Bloomberg reported in March that MoonDark is preparing for a listing in Hong Kong, though the process remains in early stages. The funding and IPO pace for leading Chinese AI firms has accelerated notably in 2026, mirroring global trends where companies like OpenAI and Anthropic are also setting new fundraising and valuation records. Securing substantial capital is becoming a critical factor in the competitive landscape alongside model capabilities.

marsbit18 min fa

Valuation Surpasses 200 Billion, Kimi Reportedly Raises 13.6 Billion More, Speeds Up Hong Kong IPO

marsbit18 min fa

South Korea's KOSPI Plunges 8.37% at Opening, Triggers Circuit Breaker: The 'Two Stocks' That Powered the Bull Market Recoil in a Single Day

On June 8th, South Korea's KOSPI index plunged 8.37% within minutes of market open, triggering a circuit breaker and halting trading. The crash was driven by a massive sell-off in heavyweight stocks Samsung Electronics and SK Hynix, which each fell 10%. These two chip giants alone account for over half of the KOSPI's total market capitalization and had contributed roughly 70% of the index's gains year-to-date, pushing it to become the world's sixth-largest stock market. The sell-off was ignited by negative guidance from U.S. chipmaker Broadcom on June 3rd, which sparked a global semiconductor stock rout. This shockwave hit South Korean markets on June 5th, with foreign investors leading a sustained exodus. The sharp decline on June 8th was exacerbated by high levels of retail margin debt (over 38 trillion KRW), forced liquidations, leveraged ETFs tied to the top stocks, and automated program trading, creating a vicious cycle. The Korean won also weakened significantly, further fueling foreign capital outflow. South Korean authorities issued emergency statements to calm markets, echoing recent warnings from the central bank governor about the risks of debt-driven investing. While some institutions like Goldman Sachs maintain long-term bullish targets for the KOSPI, the crash exposed the extreme market concentration and fragility behind its historic rally.

marsbit20 min fa

South Korea's KOSPI Plunges 8.37% at Opening, Triggers Circuit Breaker: The 'Two Stocks' That Powered the Bull Market Recoil in a Single Day

marsbit20 min fa

The Compounding Crisis in an Era of High Valuations: Is the US Stock Market Facing a New 'Lost Decade'?

This article analyzes the long-term structural risks in US equity markets, challenging the assumption that "time in the market" always ensures positive returns. Drawing on 155 years of historical data, it identifies three prolonged periods—1929-1954, 1966-1982, and 2000-2013—where real buy-and-hold returns were near zero or negative. Collectively, these "lost decades" represent roughly 35% of market history since 1871 and cause not just delayed wealth accumulation but permanent damage to compound growth paths due to the mathematics of recovering from significant drawdowns. Crucially, the authors argue that current conditions mirror historical precursors to such phases. Multiple valuation indicators, including the CAPE ratio (near its 99th percentile), the Buffett Indicator, and Tobin's Q, signal extreme overvaluation, historically associated with lower future 10-year real returns (averaging 3.6%). The paper debunks the common objection to tactical management—fear of missing the "best days" in the market—by showing that the vast majority of these top-performing days occur during bear markets and crises, often adjacent to the worst days. Therefore, avoiding major drawdowns inherently means missing these volatile surges. A key framework proposed involves monitoring market breadth (advance/decline data), which tends to deteriorate before major indices peak, providing an early warning signal. Combined with high valuations, breadth analysis offers a more robust risk-assessment tool. The conclusion for investors and advisors is not a forecast of an inevitable downturn, but a call to move from complacency to preparedness. The empirical evidence suggests that the conditions preceding lost decades are identifiable. A disciplined, adaptive strategy focused on valuation and breadth signals, rather than precise timing, can help protect long-term compounding from permanent impairment.

marsbit38 min fa

The Compounding Crisis in an Era of High Valuations: Is the US Stock Market Facing a New 'Lost Decade'?

marsbit38 min fa

Trading

Spot
Futures

Articoli Popolari

Come comprare T

Benvenuto in HTX.com! Abbiamo reso l'acquisto di Threshold Network Token (T) semplice e conveniente. Segui la nostra guida passo passo per intraprendere il tuo viaggio nel mondo delle criptovalute.Step 1: Crea il tuo Account HTXUsa la tua email o numero di telefono per registrarti il tuo account gratuito su HTX. Vivi un'esperienza facile e sblocca tutte le funzionalità,Crea il mio accountStep 2: Vai in Acquista crypto e seleziona il tuo metodo di pagamentoCarta di credito/debito: utilizza la tua Visa o Mastercard per acquistare immediatamente Threshold Network TokenT.Bilancio: Usa i fondi dal bilancio del tuo account HTX per fare trading senza problemi.Terze parti: abbiamo aggiunto metodi di pagamento molto utilizzati come Google Pay e Apple Pay per maggiore comodità.P2P: Fai trading direttamente con altri utenti HTX.Over-the-Counter (OTC): Offriamo servizi su misura e tassi di cambio competitivi per i trader.Step 3: Conserva Threshold Network Token (T)Dopo aver acquistato Threshold Network Token (T), conserva nel tuo account HTX. In alternativa, puoi inviare tramite trasferimento blockchain o scambiare per altre criptovalute.Step 4: Scambia Threshold Network Token (T)Scambia facilmente Threshold Network Token (T) nel mercato spot di HTX. Accedi al tuo account, seleziona la tua coppia di trading, esegui le tue operazioni e monitora in tempo reale. Offriamo un'esperienza user-friendly sia per chi ha appena iniziato che per i trader più esperti.

411 Totale visualizzazioniPubblicato il 2024.12.10Aggiornato il 2026.06.02

Come comprare T

Discussioni

Benvenuto nella Community HTX. Qui puoi rimanere informato sugli ultimi sviluppi della piattaforma e accedere ad approfondimenti esperti sul mercato. Le opinioni degli utenti sul prezzo di T T sono presentate come di seguito.

活动图片